ESSDD
8, 279–315, 2015The Global Terrestrial Network for Permafrost Database
B. K. Biskaborn et al.
Title Page
Abstract Instruments
Data Provenance & Structure
Tables Figures
◭ ◮
◭ ◮
Back Close
Full Screen / Esc
Printer-friendly Version Interactive Discussion
Discussion
P
a
per
|
Discussion
P
a
per
|
Discussion
P
a
per
|
Discussion
P
a
per
|
Earth Syst. Sci. Data Discuss., 8, 279–315, 2015 www.earth-syst-sci-data-discuss.net/8/279/2015/ doi:10.5194/essdd-8-279-2015
© Author(s) 2015. CC Attribution 3.0 License.
This discussion paper is/has been under review for the journal Earth System Science Data (ESSD). Please refer to the corresponding final paper in ESSD if available.
The Global Terrestrial Network for
Permafrost Database: metadata statistics
and prospective analysis on future
permafrost temperature and active layer
depth monitoring site distribution
B. K. Biskaborn1, J.-P. Lanckman2, H. Lantuit1,3, K. Elger4, D. A. Streletskiy5,
W. L. Cable6, and V. E. Romanovsky6
1
Alfred Wegener Institute, Helmholtz Centre for Polar and Marine Research, Potsdam, Germany
2
Arctic Portal, Akureyri, Iceland
3
Institute for Earth and Environmental Sciences, University of Potsdam, Potsdam, Germany
4
Helmholtz Zentrum Potsdam Deutsches Geoforschungszentrum GFZ, Germany
5
Department of Geography, George Washington University, Washington, USA
6
ESSDD
8, 279–315, 2015The Global Terrestrial Network for Permafrost Database
B. K. Biskaborn et al.
Title Page
Abstract Instruments
Data Provenance & Structure
Tables Figures
◭ ◮
◭ ◮
Back Close
Full Screen / Esc
Printer-friendly Version Interactive Discussion
Discussion
P
a
per
|
Discussion
P
a
per
|
Discussion
P
a
per
|
Discussion
P
a
per
|
Received: 15 February 2015 – Accepted: 22 February 2015 – Published: 9 March 2015
Correspondence to: B. K. Biskaborn (boris.biskaborn@awi.de)
ESSDD
8, 279–315, 2015The Global Terrestrial Network for Permafrost Database
B. K. Biskaborn et al.
Title Page
Abstract Instruments
Data Provenance & Structure
Tables Figures
◭ ◮
◭ ◮
Back Close
Full Screen / Esc
Printer-friendly Version Interactive Discussion
Discussion
P
a
per
|
Discussion
P
a
per
|
Discussion
P
a
per
|
Discussion
P
a
per
|
Abstract
The Global Terrestrial Network for Permafrost (GTN-P) provides the first dynamic database associated with the Thermal State of Permafrost (TSP) and the Circumpolar Active Layer Monitoring (CALM) programs, which extensively collect permafrost tem-perature and active layer thickness data from Arctic, Antarctic and Mountain permafrost
5
regions. The purpose of the database is to establish an “early warning system” for the consequences of climate change in permafrost regions and to provide standardized thermal permafrost data to global models. In this paper we perform statistical analysis of the GTN-P metadata aiming to identify the spatial gaps in the GTN-P site distribution in relation to climate-effective environmental parameters. We describe the concept and
10
structure of the Data Management System in regard to user operability, data transfer and data policy. We outline data sources and data processing including quality con-trol strategies. Assessment of the metadata and data quality reveals 63 % metadata completeness at active layer sites and 50 % metadata completeness for boreholes.
Voronoi Tessellation Analysis on the spatial sample distribution of boreholes and
ac-15
tive layer measurement sites quantifies the distribution inhomogeneity and provides potential locations of additional permafrost research sites to improve the representa-tiveness of thermal monitoring across areas underlain by permafrost. The depth dis-tribution of the boreholes reveals that 73 % are shallower than 25 m and 27 % are deeper, reaching a maximum of 1 km depth. Comparison of the GTN-P site
distribu-20
tion with permafrost zones, soil organic carbon contents and vegetation types exhibits different local to regional monitoring situations on maps. Preferential slope orientation at the sites most likely causes a bias in the temperature monitoring and should be taken into account when using the data for global models. The distribution of GTN-P sites within zones of projected temperature change show a high representation of
ar-25
ESSDD
8, 279–315, 2015The Global Terrestrial Network for Permafrost Database
B. K. Biskaborn et al.
Title Page
Abstract Instruments
Data Provenance & Structure
Tables Figures
◭ ◮
◭ ◮
Back Close
Full Screen / Esc
Printer-friendly Version Interactive Discussion
Discussion
P
a
per
|
Discussion
P
a
per
|
Discussion
P
a
per
|
Discussion
P
a
per
|
1 Introduction
1.1 Background and motivation
Research on the cryosphere has shown over the last few decades that it has warmed rapidly since the beginning of industrialisation. This warming will probably greatly ex-ceed the global average temperature increase (ACIA, 2004; Groisman and Soja, 2009;
5
Miller et al., 2010; Stocker et al., 2013). Permafrost is defined as ground that remains frozen for at least two consecutive years (Van Everdingen, 1998) and it underlies about one quarter of the Northern Hemisphere landmass, widespread in the Arctic, Antarc-tic and mountain areas. Further increases in air temperature will induce a warming of subsurface conditions, leading to the thawing of permafrost in some areas.
On-10
going permafrost warming (Romanovsky et al., 2010b) and near-surface thawing in permafrost regions associated with rising air temperatures are considered to reinforce warming of the atmosphere through the conversion of the large soil organic carbon pool in permafrost into greenhouse gases, a process termed “permafrost carbon feedback” (Grosse et al., 2011; Hugelius et al., 2013; Schaefer et al., 2014; Schuur et al., 2013).
15
A recent study shows that a global temperature increase of 3◦C could result in an irre-versible loss of 30 to 85 % of the near-surface permafrost, with a corresponding release of carbon dioxide between 43 to 135 Gt by 2100 (Schaefer et al., 2014). Monitoring permafrost is essential to understand the impact of climate change on its thermal state and to assess the impact of permafrost thaw on the Earth climate system. Increase
20
of permafrost temperature and thickening of the active layer could also result in sub-stantial effects on northern infrastructure, forcing local, regional and national govern-ments to devise new adaptation and mitigation plans for permafrost regions (Schaefer et al., 2012). This is why permafrost temperature and active layer thickness have been together identified as an Essential Climate Variables (ECV) by the World
Meteorolog-25
ESSDD
8, 279–315, 2015The Global Terrestrial Network for Permafrost Database
B. K. Biskaborn et al.
Title Page
Abstract Instruments
Data Provenance & Structure
Tables Figures
◭ ◮
◭ ◮
Back Close
Full Screen / Esc
Printer-friendly Version Interactive Discussion
Discussion
P
a
per
|
Discussion
P
a
per
|
Discussion
P
a
per
|
Discussion
P
a
per
|
characteristics (Fig. 1). GTN-P, formerly known as GTNet-P, was developed in 1999 by the International Permafrost Association (IPA) with active support by the Canadian Geological Survey (Brown et al., 2000; Burgess et al., 2000) under the Global Climate Observing System (GCOS) and the Global Terrestrial Observing Network (GTOS) of the World Meteorological Organization (WMO). Two components of GTN-P, the
Circum-5
polar Active Layer Monitoring program (CALM) and the Thermal State of Permafrost (TSP) currently serve as the major providers of permafrost and active-layer data (Ro-manovsky et al., 2010b; Shiklomanov et al., 2012).
1.2 State of the art and research gaps
The GTN-P experienced substantial growth at the beginning of the 21st century. About
10
350 boreholes for temperature monitoring were established and a considerable amount of active layer depth observations were collected during the 4th International Polar Year (IPY) from March 2007 to March 2009 (Brown, 2010). Efforts of the IPA and the GTN-P at the end of the IPY resulted in reports on the thermal state of permafrost in high latitudes and high altitudes which were called the “IPA snapshot” (Christiansen et al.,
15
2010; Romanovsky et al., 2010a; Smith et al., 2010; Vieira et al., 2010; Zhao et al., 2010).
The growing amount of high-resolution measurements and annual collection of per-mafrost data clearly prompted the need for comprehensive management of the GTN-P, including its data management system. Several databases exist for particular regions,
20
e.g. NORPERM (Juliussen et al., 2010), a database for Norwegian permafrost data (including Svalbard); and PERMOS, the Swiss Permafrost Monitoring Network (PER-MOS, 2013). The permafrost thermal data from the USA is archived with ACADIS (Ad-vanced Cooperative Arctic Data and Information Service), which took over for the for-mer CADIS (Cooperative Arctic Data and Information Service) as a repository for all
25
ESSDD
8, 279–315, 2015The Global Terrestrial Network for Permafrost Database
B. K. Biskaborn et al.
Title Page
Abstract Instruments
Data Provenance & Structure
Tables Figures
◭ ◮
◭ ◮
Back Close
Full Screen / Esc
Printer-friendly Version Interactive Discussion
Discussion
P
a
per
|
Discussion
P
a
per
|
Discussion
P
a
per
|
Discussion
P
a
per
|
(Allard et al., 2014). The Geological Survey of Canada (GSC) also spent great efforts to collect and store thermal permafrost data from the western Arctic, feeding the data into the former GTN-P data management system. The Thermal State of Permafrost (TSP, Brown et al., 2010) and the Circumpolar Active Layer Monitoring (CALM, Shiklo-manov et al., 2008) programs oversee the collection permafrost temperature and active
5
layer thickness data from Arctic, Antarctic and Mountain permafrost regions. These pro-grams provide the majority of the content to the GTN-P Database (Fig. 1). Both TSP and CALM provide an online data repository and are actively expanding observational network. However, all existing permafrost repositories so far were conceived as rather static aggregations of data and the modern permafrost community lacks of a dynamic
10
database with the capability to interlink between field scientists in polar research and scientists working on global climate and permafrost models.
1.3 Aims
The long term goal of GTN-P is to obtain a comprehensive view of the spatial structure, trends and variability in permafrost temperature as well as active layer thickness
(GTN-15
P Strategy and Implementation Plan 2012–2016). While the overall aim of the GTN-P Database is to function as an “early warning system” for the impacts of climate change in permafrost regions and provide standardized permafrost data needed as input to global climate models.
In this paper, we introduce the first dynamic database for parameters measured by
20
the GTN-P. The new GTN-P Database is a state-of-the-art tool for storing, process-ing and sharprocess-ing parameters relevant to the permafrost ECV measured in the Arctic, Antarctic and mountain regions. It is hosted at the Arctic Portal in Akureyri (Iceland) and managed in close cooperation with the Alfred Wegener Institute, Helmholtz Cen-tre for Polar and Marine Research (AWI) in Potsdam (Germany) and supported by the
25
European Union 7th framework programme project PAGE21.
ESSDD
8, 279–315, 2015The Global Terrestrial Network for Permafrost Database
B. K. Biskaborn et al.
Title Page
Abstract Instruments
Data Provenance & Structure
Tables Figures
◭ ◮
◭ ◮
Back Close
Full Screen / Esc
Printer-friendly Version Interactive Discussion
Discussion
P
a
per
|
Discussion
P
a
per
|
Discussion
P
a
per
|
Discussion
P
a
per
|
performing spatial analyses on the metadata; and (iii) to identify spatial gaps in GTN-P by comparing its site distribution with relevant environmental geospatial datasets.
2 Description of the data management system
2.1 Database design and web interface
The GTN-P Database is accessible online at the URL http://gtnpdatabase.org or
5
through the GTN-P website at http://gtnp.org. The general framework of the GTN-P data management system (DMS) is based on open source technologies following an object-oriented data model (Fig. 2) implemented with Cakephp and the database Post-GIS, the spatial version of PostgreSQL (Obe and Hsu, 2011). The database distin-guishes between permafrost temperatures and annual thaw depths (i.e. active layer
10
depths). To ensure interoperability and enable inter-database search, metadata field names are based on a controlled vocabulary registry. The documentation of the DMS is available and regularly updated on gtnp.org (ISSN 2410-2385) as the database frame-work and content evolves.
The online interface of the GTN-P Database was developed to maximize usability
15
both for the data submitter and the user of the data products. The resulting roles (data administrator, data submitter and data user) are built into the database providing dif-ferent rights to read, edit or modify data. Data users can access the database without account and password and have access to (i) permafrost temperatures, (ii) annual thaw depths and (iii) help sections. While administrators have full access and data
submit-20
ESSDD
8, 279–315, 2015The Global Terrestrial Network for Permafrost Database
B. K. Biskaborn et al.
Title Page
Abstract Instruments
Data Provenance & Structure
Tables Figures
◭ ◮
◭ ◮
Back Close
Full Screen / Esc
Printer-friendly Version Interactive Discussion
Discussion
P
a
per
|
Discussion
P
a
per
|
Discussion
P
a
per
|
Discussion
P
a
per
|
2.2 Data structure and upload
The GTN-P Database is compliant with existing international standards for geospatial metadata ISO 19115/2 and TC/221 (www.iso.org). The database specifically builds on the GTN-P metadata form that was developed as a standard by the GTN-P leadership in 1999 (Burgess et al., 2000). Site metadata must be entered and selected from
pa-5
rameters and properties, which are selectable in dropdown lists in the upload interface. Tutorials and templates of data files provide the necessary information to bring the data into the right CSV format, prior to data upload. The maximum file size for upload is 1.5 MB.
The data upload procedure was conceived to eliminate the need for any prior
knowl-10
edge of databases by the user. National Correspondents (NC’s) from all participating countries were nominated by the national committees and by the scientific international permafrost community to input data on an annual basis, collecting information from the investigators and data managers from that country. NC’s are listed on the GTN-P web-site and can be contacted by permafrost researchers interested in contributing
moni-15
toring data to the GTN-P Database. NC’s are also encouraged by the GTN-P Executive Committee to pro-actively engage national investigators in the process to ensure a con-tinuous data upload into the system.
2.3 Data search and output
The GTN-P Database features both (i) basic search and (ii) custom search functions.
20
The goal of these functions is to narrow down the number of data records based on a set of criteria. While the basic search is a simple filter by manual character input, the advanced custom search allows the use of multiple search criteria to retrieve a de-fined list of data records from the repository. The data and metadata associated with the search results can be downloaded by the data user as compressed file packages
25
in-ESSDD
8, 279–315, 2015The Global Terrestrial Network for Permafrost Database
B. K. Biskaborn et al.
Title Page
Abstract Instruments
Data Provenance & Structure
Tables Figures
◭ ◮
◭ ◮
Back Close
Full Screen / Esc
Printer-friendly Version Interactive Discussion
Discussion
P
a
per
|
Discussion
P
a
per
|
Discussion
P
a
per
|
Discussion
P
a
per
|
consistency of the time series, in regards to completeness, frequency and geometry does not allow their direct use within climate models, as they do not comply with the CF 1.6 convention (for Climate and Forecast).
To address this issue, the GTN-P Data Management System processes and aggre-gates all data on-the-fly through a set of internal functions and Python libraries. All
5
eligible datasets are aggregated into a NetCDF file that has been formatted to catch the geometry of the data. NetCDF (Network Common Data Form) is a set of software libraries and self-describing, machine-independent data formats that support the cre-ation, access, and sharing of array-oriented scientific data.
TSP datasets are linearly interpolated at consistent 0, 1, 2, 3, 5, and 10 m borehole
10
depths. The results are two products in NetCDF format: a TSP dataset of annual time series borehole temperature profiles in an orthogonal relation and a CALM dataset of annual time series of active layer thickness in a time orthogonal template.
Future work focuses on the establishment of data quality control and flags for the data as well as on the conversion of the stations distributed data to a regular grid at
15
locations where the monitoring sites’ scattering allows it.
2.4 Data policy
GTN-P follows an open-access policy in line with the IPY data policy. The data man-agement unit of PAGE21 mediates between the GTN-P Database and the PANGAEA Data Publisher for Earth and Environmental Science (Diepenbroek et al., 2002) which
20
provides digital object identifiers (DOI’s) for the data products. PANGAEA follows the Principles and Responsibilities of the ICSU World Data System (WDS) and the “Princi-ples and Guidelines for Access to Research Data from Public Funding” established by the Organisation for Economic Co-operation and Development (www.oecd.org). It has also adopted the Creative Commons license procedure, which provides a simple,
stan-25
ESSDD
8, 279–315, 2015The Global Terrestrial Network for Permafrost Database
B. K. Biskaborn et al.
Title Page
Abstract Instruments
Data Provenance & Structure
Tables Figures
◭ ◮
◭ ◮
Back Close
Full Screen / Esc
Printer-friendly Version Interactive Discussion
Discussion
P
a
per
|
Discussion
P
a
per
|
Discussion
P
a
per
|
Discussion
P
a
per
|
The GTN-P Executive Committee decided for a general embargo period of one year. This means that data from 2015 will be available at the earliest in 2016 in order to allow investigators the first opportunity to publish their data. For special cases, e.g. doctoral dissertations, this embargo may be extended on demand.
The data will be made freely available to the public and the scientific community
5
in the belief that their wide dissemination will lead to greater understanding and new scientific insights and that global scientific problems require international cooperation. Data download is unrestricted and requires only a free registration needed for web security reasons. Before being able to download data, users must accept the terms and conditions of the data use policy. Therein, the user is asked to contact the site PI’s prior
10
to publication to prevent potential misuse or misinterpretation of the data. In addition, an email is automatically sent to the contact person of each dataset downloaded to inform them of the interest in the data.
3 Data quality
3.1 Data sources
15
A thorough data mining effort was conducted prior to the creation of the GTN-P Database in order to recover as much archive permafrost temperature and active layer thickness data as possible. The recovered datasets were characterized by an extreme diversity. These included global datasets on active layer temperature from the CALM data collection (Shiklomanov et al., 2008), but also datasets aggregated
the-20
matically, geographically or institutionally. These other sources include the Advanced Cooperative Arctic Data and Information Service (www.aoncadis.org) at the National Snow and Ice Data Center (http://nsidc.org), the Permafrost Laboratory (University of Alaska, Fairbanks), NORPERM (Juliussen et al., 2010) and PERMOS (PERMOS, 2013), among others. Part of the data was provided by individual permafrost research
25
ESSDD
8, 279–315, 2015The Global Terrestrial Network for Permafrost Database
B. K. Biskaborn et al.
Title Page
Abstract Instruments
Data Provenance & Structure
Tables Figures
◭ ◮
◭ ◮
Back Close
Full Screen / Esc
Printer-friendly Version Interactive Discussion
Discussion
P
a
per
|
Discussion
P
a
per
|
Discussion
P
a
per
|
Discussion
P
a
per
|
In addition to GTN-P standard datasets on temperature and active layer thickness, several ancillary existing datasets were opportunistically added to the database. These include in particular remotely sensed land surface temperature and surface soil mois-ture values that were transferred from ESA DUE Permafrost (Bartsch and Seifert, 2012; DUE-Permafrost-Project-Consortium, 2012).
5
At the time of submission of this paper the GTN-P Database contained metadata from 1074 TSP boreholes and 274 CALM active layer monitoring sites. 31 boreholes are located in the mountain permafrost regions and 72 in Antarctica. Currently, 277 borehole sites have temperature data and 78 active layer monitoring sites have thaw depth data. Due to the fact that one site can have more than one measurement unit or
10
period, the total number of datasets is 1300, including ground temperature, active layer thickness, surface soil moisture, air temperature, and surface temperature.
3.2 Data quality control
Data being entered into the database undergoes several steps of quality control before receiving approval for data output. To harmonize the different data formats and produce
15
one standard format within the GTN-P Database, every dataset retrieved from external sources underwent a review and if necessary a standardization (“cleansing”) procedure to bring the file into the format needed for upload. This includes in particular conversion of file structures, date formats, reference points and null values. To match the metadata that accompanied older datasets to ISO standards, a set of obligatory metadata
infor-20
mation were developed considering the existing metadata forms from the old GTN-P web repository (closed in 2014). Metadata input must be compliant with the database rules and include a number of mandatory fields following the terminology of code lists and control vocabulary associated with the GTN-P Database as documented on the GTN-P website. The interface for metadata input is arranged as drop-down menus that
25
ESSDD
8, 279–315, 2015The Global Terrestrial Network for Permafrost Database
B. K. Biskaborn et al.
Title Page
Abstract Instruments
Data Provenance & Structure
Tables Figures
◭ ◮
◭ ◮
Back Close
Full Screen / Esc
Printer-friendly Version Interactive Discussion
Discussion
P
a
per
|
Discussion
P
a
per
|
Discussion
P
a
per
|
Discussion
P
a
per
|
correctness and consistency of the dataset. Screening for obvious errors follows with the help of automated data visualization during and after the upload procedure. Inter-active and adjustable data plots on the database website serve also as on-the-fly data visualization for scientific purposes.
According to the GTN-P Strategy and Implementation Plan (2012–2016) metadata
5
and data considered for input into the GTN-P Database will be coordinated and re-viewed by National Correspondents (NC’s) on a regular basis, at least once per year. Datasets are published only after approval by the NC’s.
Additionally, overall quality verification is inherently provided by the production of this article. As stated in the online ESSD journal description, the peer-review process
10
this paper went through secures that the involved data sets are (i) plausible without detectable problems, (ii) of sufficiently high quality with clearly stated limitations and (iii) well annotated by standard metadata.
3.3 Quality assessment and limits
In geoscience, errors start to emerge already at the measurement stage. The most
15
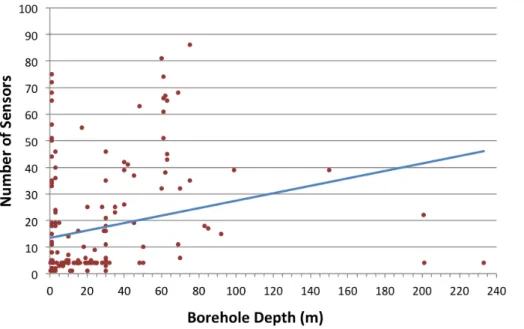
common technique of continuously recording borehole ground temperatures at spe-cific depths is the use of permanently installed multi-thermistor cables, providing an accuracy and precision between ca. 0.02 and 0.1◦C (Brown et al., 2000; Romanovsky et al., 2010b). The logger resolution and measurement frequency, however, varies with the type and the depth of the individual borehole. Due to active layer dynamics, the
20
relative vertical position of measurement probes can change and hence introduce an error in the depth indications of old boreholes in sensitive areas. Additionally, the num-ber of vertical positions of sensors varies not only between and within boreholes (and research groups) but also through time. Commonly, sensors are placed every 0.2– 0.4 m until 2 m depth, every 0.5 m until ca. 4–5 m depth, every 1–3 m until 15 m depth
25
ESSDD
8, 279–315, 2015The Global Terrestrial Network for Permafrost Database
B. K. Biskaborn et al.
Title Page
Abstract Instruments
Data Provenance & Structure
Tables Figures
◭ ◮
◭ ◮
Back Close
Full Screen / Esc
Printer-friendly Version Interactive Discussion
Discussion
P
a
per
|
Discussion
P
a
per
|
Discussion
P
a
per
|
Discussion
P
a
per
|
Based on this data, however, the average SD of the number of temperature recordings within a borehole at different dates is 14.0. The maximum difference in the number of measurements between dates is 57. Minimum is 0. The GTN-P Database support group established an IPA action group to develop strategies for profound numerical assessment and control of the GTN-P data quality.
5
The active layer thickness data (CALM) have generally fewer numbers of potential biases due to the majority of sites performing measurements of summer thaw depths using mechanical probing either in grids or transects resulting in multiple measure-ments compared to point locations associated with sites using thaw tubes or tempera-ture boreholes. The complex natempera-ture of grid metadata, however, created inconsistencies
10
in the structure of the primary data files. Even though the files were standardized be-fore implementation, the low resolution of a number of CALM grid references and TSP borehole coordinates led to imprecise geopositioning; 275 longitudes and 287 latitudes have less than 4 decimal places. 374 datasets had coordinates with decimal degree precision below 4 decimal places of either the latitude or the longitude or both. These
15
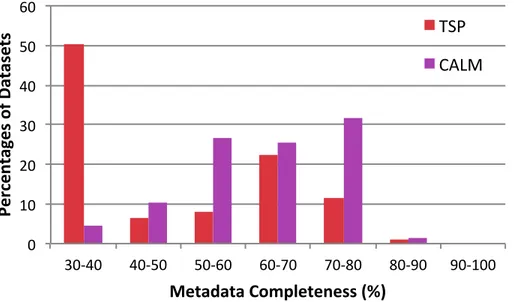
datasets have been flagged and will be submitted to the NC’s for revision. We as-sessed the overall metadata completeness for TSP and CALM datasets by calculating the percentage of available fields that are filled in. Figure 4 indicates the percentages of both data types according to the metadata completeness. CALM metadata is generally more complete with values between 50 and 80 % (average 63 %). TSP metadata has
20
a bimodal distribution of completeness with most datasets between 31 and 40 % and a second peak between 61–70 % (average 50 %).
Metadata fields with the most missing information are accessibility, distance from disturbance, bibliographic references, terrain morphology, hydrology, slope and aspect, borehole diameter and permafrost thickness. While these “extra” information are not
25
ESSDD
8, 279–315, 2015The Global Terrestrial Network for Permafrost Database
B. K. Biskaborn et al.
Title Page
Abstract Instruments
Data Provenance & Structure
Tables Figures
◭ ◮
◭ ◮
Back Close
Full Screen / Esc
Printer-friendly Version Interactive Discussion
Discussion
P
a
per
|
Discussion
P
a
per
|
Discussion
P
a
per
|
Discussion
P
a
per
|
4 GTN-P metadata statistics
4.1 Spatial sample representation of TSP and CALM sites
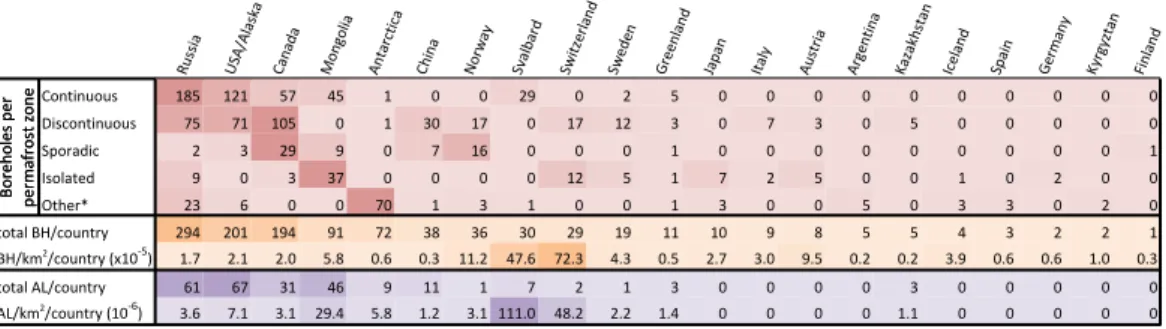
Table 1 summarizes the distribution of boreholes and active layer monitoring sites per country. The total numbers per country and permafrost zone were calculated by plotting the sites as points and the areas as polygons in ArcGIS. During the analyses some
5
polygons and site coordinates suffered from inaccuracy – e.g. terrestrial boreholes with imprecise coordinates were shown as “offshore” sites. In these cases, land-ocean polygon boundaries were slightly shifted and the land polygons extended to capture the relevant points. For calculating the borehole per area ratios, however, we used the original polygon dimensions.
10
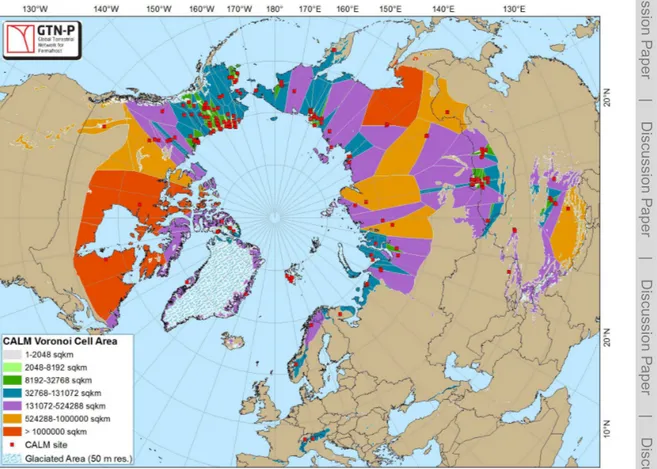
In order to measure the degree of inhomogeneous sampling and to identify the main geographical gaps, we performed a numerical quantification of the distribution of bore-holes and active layer grids in the Northern Hemisphere with the help of a Voronoi Tessellation Analysis (VTA) as suggested by Molkenthin et al. (2014). To reduce the potential bias that result from multiple boreholes or active layer monitoring grids around
15
the same coordinate or which are very close to each other, buffers of 1 km radius for each coordinate were created in ArcGIS. Sites with site-to-site distance of≤2 km were merged and the gravitational centers of the resulting buffer areas were converted to points for further calculations. With the help of this method we reduced 1073 TSP co-ordinates to 614 buffered TSP sites and 242 CALM coordinates to 187 buffered CALM
20
sites. Voronoi cells were calculated using the Thiessen polygon tool and subsequently clipped to the extension of the IPA map of permafrost zones.
The VTA creates a mosaic by drawing area (cell) boundaries exactly in the middle between neighboring nodes: TSP sites (Fig. 5) and CALM sites (Fig. 6). Every point within a cell is closer to its node than to any other node. Glaciated areas (shapefile from
25
ESSDD
8, 279–315, 2015The Global Terrestrial Network for Permafrost Database
B. K. Biskaborn et al.
Title Page
Abstract Instruments
Data Provenance & Structure
Tables Figures
◭ ◮
◭ ◮
Back Close
Full Screen / Esc
Printer-friendly Version Interactive Discussion
Discussion
P
a
per
|
Discussion
P
a
per
|
Discussion
P
a
per
|
Discussion
P
a
per
|
mean Voronoi cell size. Hence, to quantify the overall deviation from equidistant sam-pling of the terrestrial Northern Hemisphere permafrost and glacier-free area, we used the SD of the Voronoi cell size distribution from TSP (SD: 9.08×10⁴km2) and CALM (SD: 8.68×10⁴km2). For visualization, we calculated the number of Voronoi cells in
a cubic size sequencex2 (1 to 2, 2 to 4, 4 to 8,. . . , 1.05×10⁶to 2.10×10⁶km2) and
5
plotted the results on a logarithmic scale (Fig. 7). Voronoi Cell Size Ranges were at-tributed to the same colors types as in Figs. 5 and 6. According to the VTA, the TSP cell size distribution peaks two times at smaller values than theAtotal/Ncells=3.79×10
4
km2 indicating a significantly clustered sample distribution. TSP bimodal size distribution is attributed to (i) linear spatial sample configuration along transportation corridors in
ar-10
eas with developed economic and infrastructure as well as several high-density bore-hole transects and (ii) to the good coverage and high number of borebore-holes in Alaska, both indicated in green color. The CALM cell size peaks at about the same values as Atotal/Ncells=1.25×10
5
km2. The plateau between 2×10⁴km2 and ca. 6×10⁵km2,
however, indicates a clustered sample distribution, albeit the panarctic CALM sampling
15
is clustered to a lesser degree than the borehole configuration. High skewness of both TSP (4.99) and CALM (6.52) cell size distributions indicates that the peaks are inclined towards higher cell size values demonstrating inhomogeneous sample distribution.
The boundaries of the bigger Voronoi cells (orange and red) and especially their intersections (Figs. 5, 6 and 9) indicate locations with the highest potential for
improv-20
ing the representativeness of permafrost monitoring from hemispherical or global per-spective. However, this statement is based on a purely statistical view of the Northern Hemisphere and is not taking into account disturbing landscape features such as water bodies, forest fires, infrastructure, areas of deforestation, urbanization, farming, mining and wetland drainage.
25
4.2 TSP borehole depth distribution
ESSDD
8, 279–315, 2015The Global Terrestrial Network for Permafrost Database
B. K. Biskaborn et al.
Title Page
Abstract Instruments
Data Provenance & Structure
Tables Figures
◭ ◮
◭ ◮
Back Close
Full Screen / Esc
Printer-friendly Version Interactive Discussion
Discussion
P
a
per
|
Discussion
P
a
per
|
Discussion
P
a
per
|
Discussion
P
a
per
|
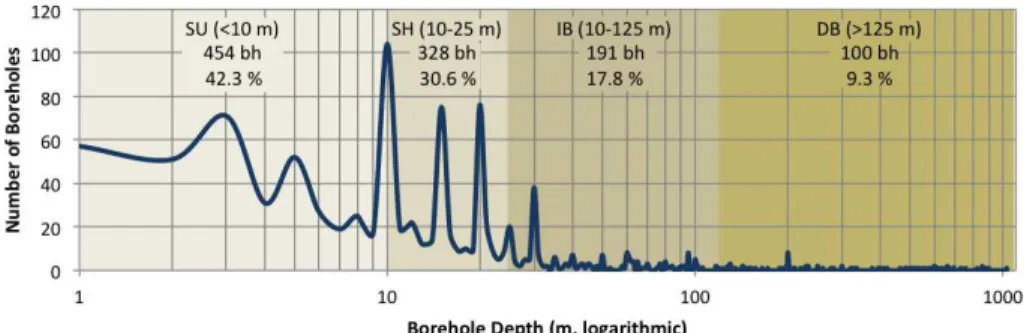
(“SU”,<10 m). In general, there are more shallow (30.6 % “SH”, 10–25 m) and interme-diate (17.8 % “IB”, 10–125 m) than deep boreholes (9.3 % “DB”,>125 m). The peaks in the borehole depth distribution correspond to commonly chosen depths (3, 5, 10, 15, 20, 25 and 30 m). These were often defined prior to drilling to capture specific per-mafrost features such as the depth of zero annual amplitude (DZAA). Deep boreholes
5
are generally older than shallow boreholes. The average drilling dates (AD) for the GTN-P depth classes are as follows: SU=2003; SH=1997; IB=1993; DB=1984. The overall average drilling date of boreholes is 1997. However, only 82 % of TSP datasets contain metadata information about borehole ages. The lack of age metadata affects all depth classes. The average borehole depth of datasets without age
informa-10
tion is 29 m. The oldest borehole currently present in the database is located in Russia (Vorkuta K-887) and was drilled to 85 m depth in 1957.
4.3 Site distribution compared with soil organic carbon content and vegetation
To identify the main geographical gaps in the distribution of boreholes and active layer monitoring sites, we compared the GTN-P metadata with environmental data from
dif-15
ferent sources. Permafrost thaw is likely to foster the metabolization of the greatest organic carbon pools in the Northern Hemisphere and is believed to create a positive feedback to the Earth’s climate system by releasing enormous amount of greenhouse gases (Grosse et al., 2011; Schaefer et al., 2014). Together with the TSP and CALM Voronoi cell boundaries and simplified permafrost zones, we illustrated the panarctic
20
distribution of soil organic carbon content within the top two meters by using data from the Northern Circumpolar Soil Carbon Database (Hugelius et al., 2013) in Table 2. The distribution of CALM and TSP point coordinates was calculated within the different car-bon content groups and shows that, at the circumpolar scale, 25.2 % of all boreholes and almost 29 % of all CALM sites are located in permafrost areas that contain more
25
ESSDD
8, 279–315, 2015The Global Terrestrial Network for Permafrost Database
B. K. Biskaborn et al.
Title Page
Abstract Instruments
Data Provenance & Structure
Tables Figures
◭ ◮
◭ ◮
Back Close
Full Screen / Esc
Printer-friendly Version Interactive Discussion
Discussion
P
a
per
|
Discussion
P
a
per
|
Discussion
P
a
per
|
Discussion
P
a
per
|
We conducted a similar analysis using vegetation zones. For this, we used the vege-tation zone information provided in the original GTN-P metadata. Locations with miss-ing vegetation information were attributed to vegetation zones by usmiss-ing photographs of the site (if available) and/or other sources such as atlases of the local flora. This information is provided in Table 2. Because of the wide variety of sources used to
de-5
fine vegetation zones, we prefer not to base recommendations for future locations of monitoring sites based on this information. However, the treeline (Walker et al., 2005), through its function as a major ecotone between forest and tundra, offers high poten-tial for sensitive recording of climate change signals (Biskaborn et al., 2012) and is therefore shown in Fig. 9.
10
4.4 Preferential slope orientation
Topography and in particular slope orientation influences the amount of solar radiation received by the ground surface and the accumulation of snow. Due to orbital parame-ters, in mountainous regions of lower latitudes, permafrost occurs preferably on north-facing slopes in the Northern Hemisphere. Similarly, in continuous permafrost regions,
15
the active layer is usually thinner on north-facing slopes (French, 2007). To inspect the monitoring bias that might be caused by preferential slope orientation, we analyzed the slope and aspect for boreholes and active layer sites.
Only few of the original GTN-P metadata collections contained slopes and aspects of the ground surface at the permafrost borehole or the active layer grid sites. This
infor-20
mation also existed in various formats. We used the ESA DUE Permafrost Circumpolar digital elevation model (Santoro and Strozzi, 2012) in ArcGIS to calculate slope and aspect from the Northern Hemisphere topography. This remote sensed derived model, however, has a resolution of 100 m and therefore, the calculated values (in degree units) for each site north of 60◦N should be evaluated carefully. Figure 10 shows the
25
ESSDD
8, 279–315, 2015The Global Terrestrial Network for Permafrost Database
B. K. Biskaborn et al.
Title Page
Abstract Instruments
Data Provenance & Structure
Tables Figures
◭ ◮
◭ ◮
Back Close
Full Screen / Esc
Printer-friendly Version Interactive Discussion
Discussion
P
a
per
|
Discussion
P
a
per
|
Discussion
P
a
per
|
Discussion
P
a
per
|
equal-angle projections and (ii) the frequencies of slope aspects as rose diagrams with a bin size of 30◦. A comparison between the original metadata and the DEM-derived values shows major differences in the CALM sites, amplified (i) by the very low amount of slope metadata entries (n=8) and (ii) due to the fact that most active layer moni-toring sites are located on a more or less flat terrain. It must be considered, however,
5
that recent CALM sites are usually selected by constant geophysical conditions on flat watersheds and only few historically adapted sites are located on slopes.
The closer the slope values are to zero, the higher the potential uncertainty in the aspect values. Aspects in the original TSP and CALM metadata had various formats in-cluding verbal descriptions and abbreviations of main (rough) geographical directions.
10
Accordingly, these rose diagrams and planes are concentrated in categorized direc-tions such as N, NW, WNW etc. A higher overall number of TSP borehole slopes and aspects (n=48) from the metadata than for CALM sites enabled a more reliable com-parison between original and calculated values. For all TSP sites north of 60◦N, 25 % of the original metadata and 20 % of the DEM derived data rank in the bin between 271
15
and 300◦. Both mean vectors point towards a WSW direction, as indicated in Fig. 10 by the arrows. The fact that slopes at the borehole and CALM sites are dipping towards a preferential direction indicates, that there is a different amount of incoming solar energy received by the monitored ground than compared to the average. Therefore, preferential slope orientation causes a bias in the overall representativeness of
tem-20
perature monitoring and should be taken into account when using the data for global models.
4.5 The distribution of GTN-P sites within zones of projected temperature
change
Climate models project temperature increases in the Arctic towards the end of the
25
ESSDD
8, 279–315, 2015The Global Terrestrial Network for Permafrost Database
B. K. Biskaborn et al.
Title Page
Abstract Instruments
Data Provenance & Structure
Tables Figures
◭ ◮
◭ ◮
Back Close
Full Screen / Esc
Printer-friendly Version Interactive Discussion
Discussion
P
a
per
|
Discussion
P
a
per
|
Discussion
P
a
per
|
Discussion
P
a
per
|
(Koven et al., 2013) and boreal landscapes will most likely lose all present discontinu-ous permafrost zones by the end of the 21st Century (Slater and Lawrence, 2013). To assess the distribution quality of present permafrost temperature monitoring, we calcu-lated the number of TSP and CALM sites per zone of projected temperature change for 15 different climate models. Differences of mean annual near surface temperature
be-5
tween 2070–2099 AD and 1970–2000 AD for representative concentration pathways (rcp’s) 4.5 and 8.5 were taken into account for following models: ACCESS1-0, bcc-csm1-1, CanESM2, CCSM4, CNRM-CM5, CSIRO-MK3-6-0, GISS-E2-H, GISS-E2-H, GISS-E2-R, HadGEM2-ES, inmcm4, IPSL-CM5A-LR, MPI-ESM-LR, MRI-CGCM3 and NorESM1-M. Figure 11 shows that in rcp 4.5, an intermediate greenhouse gas
emis-10
sion scenario, most boreholes and CALM sites are located in relatively narrow zones of less extreme projected temperature change (ca. 3–6◦C for TSP and ca. 2–5◦C for CALM). The high-emission scenario rcp 8.5 projects a more extreme temperature in-crease for larger areas and more GTN-P monitoring sites are located in zones of up to a 10◦C potential temperature rise. A comparison of the applied models shows that,
15
depending on the model uncertainties and variety of possible climate futures, the spa-tial distribution of projected temperature change varies from model to model. This is why increasing the number of soil temperature and active layer monitoring sites by fill-ing main geographical gaps is critically important to constrain projections of climate change’s impact on permafrost.
20
5 Conclusions
The GTN-P Database contains standardized and quality checked permafrost temper-ature and active layer thaw depth data from the Earth’s permafrost regions: 1074 TSP boreholes and 274 CALM sites. The associated Data Management System provides automated visualization and data output formats developed for the needs of a high
25
ESSDD
8, 279–315, 2015The Global Terrestrial Network for Permafrost Database
B. K. Biskaborn et al.
Title Page
Abstract Instruments
Data Provenance & Structure
Tables Figures
◭ ◮
◭ ◮
Back Close
Full Screen / Esc
Printer-friendly Version Interactive Discussion
Discussion
P
a
per
|
Discussion
P
a
per
|
Discussion
P
a
per
|
Discussion
P
a
per
|
GTN-P metadata statistics can help to identify potential new monitoring sites. Veg-etation types, soil organic carbon content and the slope orientation at boreholes and active layer depth monitoring sites show the existence of biases and hinder the repre-sentativeness of these sites at the global level. The distribution of GTN-P sites accord-ing to projected temperature change shows a high representation of areas with smaller
5
expected temperature rise but a lower number of sites within arctic areas where climate models project extreme temperature rise.
We conclude that for gaining a representative global view on the thermal develop-ment of the Earth’s permafrost landscapes, more permafrost monitoring sites must be established at key sites and entered into the GTN-P Database. These sites should be
10
preferentially located in areas where monitoring is lacking, but also where soil organic carbon contents are high and projected temperature change is high. This paper offers a scientific basis and maps for planning future permafrost research monitoring sites, which could feed into existing planning efforts such as the Global Cryosphere Watch (GCW) Implementation Plan 2015 (http://globalcryospherewatch.org).
15
Author contributions. Leading author Boris K. Biskaborn (GTN-P scientific manager) was writ-ing the manuscript, performed statistics (together with the Arctic Portal). Co-authors Jean-Pierre Lanckman developed the Data Management System of the GTN-P database; Hugues Lantuit (PAGE21 data management leader) was the initiator and main advisor for this study; Kirsten Elger contributed as former GTN-P manager to the database and in the data policy
20
chapter of this article; Dmitry A. Streletskiy was the main advisor for CALM data; William L. Ca-ble was the advisor for technical aspects of boreholes; Vladimir E. Romanovsky (director of GTN-P) was the main advisor for TSP data.
Acknowledgements. The main sponsor for the establishment of the GTN-P Database is the PAGE21 Project with financial support by the European Commission (FP7-ENV-2011, Grant
25
Agreement no. 282700). The GTN-P Database was developed and is hosted at the Arctic Por-tal (Iceland) in collaboration with the Alfred Wegener Institute Helmholtz Centre for Polar and Marine Research (Germany). The authors thank Eleanor Burke and Sarah Chatburn for provid-ing materials and advice on climate models and NetCDF files. We further thank Kerstin Gillen, Almut Dreßler and Kira Rehfeld for their help with technical aspects and statistics.
ESSDD
8, 279–315, 2015The Global Terrestrial Network for Permafrost Database
B. K. Biskaborn et al.
Title Page
Abstract Instruments
Data Provenance & Structure
Tables Figures
◭ ◮
◭ ◮
Back Close
Full Screen / Esc
Printer-friendly Version Interactive Discussion
Discussion
P
a
per
|
Discussion
P
a
per
|
Discussion
P
a
per
|
Discussion
P
a
per
|
References
ACIA: Impacts of a Warming Arctic – Arctic Climate Impact Assessment, Cambridge University Press, Cambridge, 2004.
Allard, M., Sarrazin, D., and L’Hérault, E.: Borehole monitoring temperatures in northeastern Canada, v. 1.2 (1988–2014), Nordicana, D8, doi:10.5885/45291SL-34F28A9491014AFD,
5
2014.
Bartsch, A. and Seifert, F. M.: The ESA DUE Permafrost project – a service for high latitude research, Geoscience and Remote Sensing Symposium (IGARSS), 2012 IEEE International, 22–27 July 2012, Munich, Germany, 5222–5225, 2012.
Biskaborn, B. K., Herzschuh, U., Bolshiyanov, D., Savelieva, L., and Diekmann, B.:
Environ-10
mental variability in northeastern Siberia during the last similar to 13,300 yr inferred from lake diatoms and sediment–geochemical parameters, Palaeogeogr. Palaeocl., 329, 22–36, 2012.
Brown, J.: Report from the International Permafrost Association: the IPY Permafrost Legacy, Permafrost Periglac., 21, 215–218, 2010.
15
Brown, J., Ferrians Jr, O., Heginbottom, J., and Melnikov, E.: Circum-Arctic map of per-mafrost and ground-ice conditions, National Snow and Ice Data Center/World Data Center for Glaciology, Boulder, CO, Digital media, revised February 2001, 1998.
Brown, J., Hinkel, K., and Nelson, F.: The circumpolar active layer monitoring (calm) program: research designs and initial results, Polar Geography, 24, 166–258, 2000.
20
Brown, J., Kholodov, A., Romanovsky, V., Yoshikawa, K., Smith, S. L., Christiansen, H. H., Vieira, G., and Noetzli, J.: The Thermal State of Permafrost: the IPY-IPA snapshot (2007– 2009), Boulder, Proceed. Geo, 12–16, 2010.
Burgess, M., Smith, S., Brown, J., Romanovsky, V., and Hinkel, K.: The Global Terrestrial Net-work for Permafrost (GTNet-P): permafrost monitoring contributing to global climate
obser-25
vations, Current Research 2000 E14, Geological Survey of Canada, 2000.
Cardozo, N. and Allmendinger, R. W.: Spherical projections with OSXStereonet, Comput. Geosci., 51, 193–205, 2013.
Christiansen, H. H., Etzelmuller, B., Isaksen, K., Juliussen, H., Farbrot, H., Humlum, O., Jo-hansson, M., Ingeman-Nielsen, T., Kristensen, L., Hjort, J., Holmlund, P., Sannel, A. B. K.,
30
ESSDD
8, 279–315, 2015The Global Terrestrial Network for Permafrost Database
B. K. Biskaborn et al.
Title Page
Abstract Instruments
Data Provenance & Structure
Tables Figures
◭ ◮
◭ ◮
Back Close
Full Screen / Esc
Printer-friendly Version Interactive Discussion
Discussion
P
a
per
|
Discussion
P
a
per
|
Discussion
P
a
per
|
Discussion
P
a
per
|
The thermal state of permafrost in the Nordic Area during the International Polar Year 2007– 2009, Permafrost Periglac., 21, 156–181, 2010.
Diepenbroek, M., Grobe, H., Reinke, M., Schindler, U., Schlitzer, R., Sieger, R., and Wefer, G.: PANGAEA – an information system for environmental sciences, Comput. Geosci., 28, 1201– 1210, 2002.
5
DUE-Permafrost-Project-Consortium: ESA Data User Element (DUE) Permafrost: Circumpolar Remote Sensing Service for Permafrost (Full Product Set) with links to datasets, PANGAEA, doi:10.1594/PANGAEA.780111, (new versions 2013, 2014), 2012.
French, H. M.: The Periglacial Environment, Wiley, England, 2007.
Groisman, P. and Soja, A. J.: Ongoing climatic change in Northern Eurasia: justification for
ex-10
pedient research, Environ. Res. Lett., 4, 045002, doi:10.1088/1748-9326/4/4/045002, 2009. Grosse, G., Romanovsky, V., Jorgenson, T., Anthony, K. W., Brown, J., and Overduin, P. P.:
Vulnerability and feedbacks of permafrost to climate change, EOS T. Am. Geophys. Un., 92, 73–74, 2011.
GTN-P: GTN-P metadata for permafrost boreholes (TSP) and active layer monitoring (CALM)
15
sites, PANGAEA, doi:10.1594/PANGAEA.842821, in press, 2015.
Hugelius, G., Tarnocai, C., Broll, G., Canadell, J. G., Kuhry, P., and Swanson, D. K.: The North-ern Circumpolar Soil Carbon Database: spatially distributed datasets of soil coverage and soil carbon storage in the northern permafrost regions, Earth Syst. Sci. Data, 5, 3–13, doi:10.5194/essd-5-3-2013, 2013.
20
Juliussen, H., Christiansen, H. H., Strand, G. S., Iversen, S., Midttømme, K., and Rønning, J. S.: NORPERM, the Norwegian Permafrost Database – a TSP NORWAY IPY legacy, Earth Syst. Sci. Data, 2, 235–246, doi:10.5194/essd-2-235-2010, 2010.
Koven, C. D., Riley, W. J., and Stern, A.: Analysis of permafrost thermal dynamics and response to climate change in the CMIP5 Earth System Models, J. Climate, 26, 1877–1900, 2013.
25
Miller, G. H., Brigham-Grette, J., Alley, R. B., Anderson, L., Bauch, H. A., Douglas, M. S. V., Edwards, M. E., Elias, S. A., Finney, B. P., Fitzpatrick, J. J., Funder, S. V., Herbert, T. D., Hinzman, L. D., Kaufman, D. S., MacDonald, G. M., Polyak, L., Robock, A., Serreze, M. C., Smol, J. P., Spielhagen, R., White, J. W. C., Wolfe, A. P., and Wolff, E. W.: Temperature and precipitation history of the Arctic, Quaternary Sci. Rev., 29, 1679–1715, 2010.
30
ESSDD
8, 279–315, 2015The Global Terrestrial Network for Permafrost Database
B. K. Biskaborn et al.
Title Page
Abstract Instruments
Data Provenance & Structure
Tables Figures
◭ ◮
◭ ◮
Back Close
Full Screen / Esc
Printer-friendly Version Interactive Discussion
Discussion
P
a
per
|
Discussion
P
a
per
|
Discussion
P
a
per
|
Discussion
P
a
per
|
Obe, R. and Hsu, L.: PostGIS in Action, Manning Publications Co., Greenwich, CT, USA, 2011. PERMOS: Permafrost in Switzerland 2008/2009 and 2009/2010, Swiss Academy of Sciences,
Zurich, Switzerland, 80 pp., 2013.
Romanovsky, V. E., Drozdov, D. S., Oberman, N. G., Malkova, G. V., Kholodov, A. L., Marchenko, S. S., Moskalenko, N. G., Sergeev, D. O., Ukraintseva, N. G., Abramov, A. A.,
5
Gilichinsky, D. A., and Vasiliev, A. A.: Thermal state of permafrost in Russia, Permafrost Periglac., 21, 136–155, 2010a.
Romanovsky, V. E., Smith, S. L., and Christiansen, H. H.: Permafrost thermal state in the Po-lar Northern Hemisphere during the International PoPo-lar Year 2007–2009: a synthesis, Per-mafrost Periglac., 21, 106–116, 2010b.
10
Santoro, M. and Strozzi, T.: Circumpolar digital elevation models>55◦N with links to geotiff images, PANGAEA, doi:10.1594/PANGAEA.779748, 2012.
Schaefer, K., Lantuit, H., Romanovsky, V., and Schuur, E.: Policy Implications of Warming Per-mafrost, United Nations Environment Programme Special Report, Nairobi, Kenya, 50 pp., 2012.
15
Schaefer, K., Lantuit, H., Romanovsky, V. E., Schuur, E. A., and Witt, R.: The impact of the permafrost carbon feedback on global climate, Environ. Res. Lett., 9, 9 pp., 2014.
Schuur, E. A. G., Abbott, B. W., Bowden, W. B., Brovkin, V., Camill, P., Canadell, J. G., Chan-ton, J. P., Chapin, F. S., III, Christensen, T. R., Ciais, P., Crosby, B. T., Czimczik, C. I., Grosse, G., Harden, J., Hayes, D. J., Hugelius, G., Jastrow, J. D., Jones, J. B., Kleinen, T.,
20
Koven, C. D., Krinner, G., Kuhry, P., Lawrence, D. M., McGuire, A. D., Natali, S. M., O’Donnell, J. A., Ping, C. L., Riley, W. J., Rinke, A., Romanovsky, V. E., Sannel, A. B. K., Schaedel, C., Schaefer, K., Sky, J., Subin, Z. M., Tarnocai, C., Turetsky, M. R., Waldrop, M. P., Anthony, K. M. W., Wickland, K. P., Wilson, C. J., and Zimov, S. A.: Expert assessment of vulnerability of permafrost carbon to climate change, Climatic Change, 119, 359–374, 2013.
25
Shiklomanov, N., Nelson, F., Streletskiy, D., Hinkel, K., and Brown, J.: The circumpolar active layer monitoring (CALM) program: data collection, management, and dissemination strate-gies, in: Proceedings of the 9th International Conference on Permafrost, Fairbanks, Alaska, USA, 1647–1652, 2008.
Shiklomanov, N. I., Streletskiy, D. A., and Nelson, F. E.: Northern Hemisphere component of
30
ESSDD
8, 279–315, 2015The Global Terrestrial Network for Permafrost Database
B. K. Biskaborn et al.
Title Page
Abstract Instruments
Data Provenance & Structure
Tables Figures
◭ ◮
◭ ◮
Back Close
Full Screen / Esc
Printer-friendly Version Interactive Discussion
Discussion
P
a
per
|
Discussion
P
a
per
|
Discussion
P
a
per
|
Discussion
P
a
per
|
Slater, A. G. and Lawrence, D. M.: Diagnosing present and future permafrost from climate models, J. Climate, 26, 5608–5623, 2013.
Smith, S. L., Romanovsky, V. E., Lewkowicz, A. G., Burn, C. R., Allard, M., Clow, G. D., Yoshikawa, K., and Throop, J.: Thermal state of permafrost in North America: a contribu-tion to the Internacontribu-tional Polar Year, Permafrost Periglac., 21, 117–135, 2010.
5
Stocker, T. F., Qin, D., Plattner, G.-K., Tignor, M., Allen, S. K., Boschung, J., Nauels, A., Xia, Y., Bex, V., and Midgley, P. M.: Climate Change 2013: The Physical Science Basis, Intergovern-mental Panel on Climate Change, Working Group I Contribution to the IPCC Fifth Assess-ment Report (AR5), Cambridge Univ Press, New York, 2013.
Van Everdingen, R.: Multi-language glossary of permafrost and related ground-ice terms,
Na-10
tional Snow and Ice Data Center/World Data Center for Glaciology, Boulder, CO, 1998. Vieira, G., Bockheim, J., Guglielmin, M., Balks, M., Abramov, A. A., Boelhouwers, J.,
Can-none, N., Ganzert, L., Gilichinsky, D. A., Gotyachkin, S., Lopez-Martinez, J., Meiklejohn, I., Raffi, R., Ramos, M., Schaefer, C., Serrano, E., Simas, F., Sletten, R., and Wagner, D.: Ther-mal state of permafrost and active-layer monitoring in the Antarctic: advances during the
15
International Polar Year 2007–2009, Permafrost Periglac., 21, 182–197, 2010.
Walker, D. A., Raynolds, M. K., Daniels, F. J. A., Einarsson, E., Elvebakk, A., Gould, W. A., Katenin, A. E., Kholod, S. S., Markon, C. J., Melnikov, E. S., Moskalenko, N. G., Talbot, S. S., Yurtsev, B. A., and Team, C.: The Circumpolar Arctic vegetation map, J. Veg. Sci., 16, 267– 282, 2005.
20
ESSDD
8, 279–315, 2015The Global Terrestrial Network for Permafrost Database
B. K. Biskaborn et al.
Title Page
Abstract Instruments
Data Provenance & Structure
Tables Figures
◭ ◮
◭ ◮
Back Close
Full Screen / Esc
Printer-friendly Version Interactive Discussion Discussion P a per | Discussion P a per | Discussion P a per | Discussion P a per |
Table 1.TSP borehole and CALM active layer monitoring site distribution. Cell color darkens with increasing values within rows.
Ru ssia USA /Alask a Can ad a Mo ngo lia An tar ctica China No
rw ay Sval bar d Sw itze rlan d Sw ede n Gre en lan d Jap an Ital y Au str ia Arg en tin a Kazak hstan Ice lan d Sp ain Ge rm any Kyr gyztan Fin lan d Boreh ol esEp erE p e rm af ro stE zo n
e Continuous 185 121 57 45 1 0 0 29 0 2 5 0 0 0 0 0 0 0 0 0 0
Discontinuous 75 71 105 0 1 30 17 0 17 12 3 0 7 3 0 5 0 0 0 0 0
Sporadic 2 3 29 9 0 7 16 0 0 0 1 0 0 0 0 0 0 0 0 0 1
Isolated 9 0 3 37 0 0 0 0 12 5 1 7 2 5 0 0 1 0 2 0 0
Other* 23 6 0 0 70 1 3 1 0 0 1 3 0 0 5 0 3 3 0 2 0
294 201 194 91 72 38 36 30 29 19 11 10 9 8 5 5 4 3 2 2 1
1.7 2.1 2.0 5.8 0.6 0.3 11.2 47.6 72.3 4.3 0.5 2.7 3.0 9.5 0.2 0.2 3.9 0.6 0.6 1.0 0.3
61 67 31 46 9 11 1 7 2 1 3 0 0 0 0 3 0 0 0 0 0
3.6 7.1 3.1 29.4 5.8 1.2 3.1 111.0 48.2 2.2 1.4 0 0 0 0 1.1 0 0 0 0 0
*OtherE=Eglacier,EnoEpermafrostEorEunknown;EBHE=Eboreholes;EALE=EactiveElayerEsites totalEBH/country
BH/km2/countryE(x10\5)
totalEAL/country
AL/km2
/countryE(10\6)
ESSDD
8, 279–315, 2015The Global Terrestrial Network for Permafrost Database
B. K. Biskaborn et al.
Title Page
Abstract Instruments
Data Provenance & Structure
Tables Figures
◭ ◮
◭ ◮
Back Close
Full Screen / Esc
Printer-friendly Version Interactive Discussion
Discussion
P
a
per
|
Discussion
P
a
per
|
Discussion
P
a
per
|
Discussion
P
a
per
|
Table 2.Representation of Bioparameters within the borehole and active layer monitoring site distributions. Distribution of soil organic carbon contents in the top 200 cm from Northern Cir-cumpolar Soil Carbon Database (Hugelius et al., 2013). Vegetation zones taken from the stan-dardized GTN-P metadata.
Bioparameter TSP boreholes (%) CALM grids (%)
V
egetation
z
one
Polar Desert 3.9 3.7
Tundra 27.3 26.9
Shrub Tundra 11.3 13.2
Grassland 8.1 19.8
Forest Tundra 11.9 12.4
Coniferous Forest 11.4 5.8
Deciduous Forest 2.5 1.7
No Vegetation 11.6 2.9
Other 11.9 13.6
Soil
organic
carbon
0 % or no value 18.4 10.7
<10 % 20.3 22.7
10–25 % 34.3 37.6
25–50 % 25.2 28.9
ESSDD
8, 279–315, 2015The Global Terrestrial Network for Permafrost Database
B. K. Biskaborn et al.
Title Page
Abstract Instruments
Data Provenance & Structure
Tables Figures
◭ ◮
◭ ◮
Back Close
Full Screen / Esc
Printer-friendly Version Interactive Discussion
Discussion
P
a
per
|
Discussion
P
a
per
|
Discussion
P
a
per
|
Discussion
P
a
per
|
0 10 20 30 40 50 60
30‐40 40‐50 50‐60 60‐70 70‐80 80‐90 90‐100
Percen
ta
ges o
f Da
ta
set
s
Metadata Completeness (%)
TSP
CALM
ESSDD
8, 279–315, 2015The Global Terrestrial Network for Permafrost Database
B. K. Biskaborn et al.
Title Page
Abstract Instruments
Data Provenance & Structure
Tables Figures
◭ ◮
◭ ◮
Back Close
Full Screen / Esc
Printer-friendly Version Interactive Discussion
Discussion
P
a
per
|
Discussion
P
a
per
|
Discussion
P
a
per
|
Discussion
P
a
per
|