www.atmos-chem-phys.net/16/1245/2016/ doi:10.5194/acp-16-1245-2016
© Author(s) 2016. CC Attribution 3.0 License.
Constraining condensed-phase formation kinetics of secondary
organic aerosol components from isoprene epoxydiols
T. P. Riedel1,a, Y.-H. Lin1,b, Z. Zhang1, K. Chu1, J. A. Thornton2, W. Vizuete1, A. Gold1, and J. D. Surratt1
1Department of Environmental Sciences and Engineering, Gillings School of Global Public Health,
The University of North Carolina at Chapel Hill, Chapel Hill, North Carolina, USA
2Department of Atmospheric Sciences, University of Washington, Seattle, Washington, USA
apresent address: US Environmental Protection Agency, National Exposure Research Laboratory, Research Triangle Park,
North Carolina, USA
bpresent address: Department of Chemistry, Michigan Society of Fellows, University of Michigan,
Ann Arbor, Michigan, USA
Correspondence to:J. D. Surratt ([email protected])
Received: 29 September 2015 – Published in Atmos. Chem. Phys. Discuss.: 21 October 2015 Revised: 11 January 2016 – Accepted: 18 January 2016 – Published: 3 February 2016
Abstract. Isomeric epoxydiols from isoprene photooxi-dation (IEPOX) have been shown to produce substantial amounts of secondary organic aerosol (SOA) mass and are therefore considered a major isoprene-derived SOA pre-cursor. Heterogeneous reactions of IEPOX on atmospheric aerosols form various aerosol-phase components or “tracers” that contribute to the SOA mass burden. A limited num-ber of the reaction rate constants for these acid-catalyzed aqueous-phase tracer formation reactions have been con-strained through bulk laboratory measurements. We have de-signed a chemical box model with multiple experimental constraints to explicitly simulate gas- and aqueous-phase re-actions during chamber experiments of SOA growth from IEPOX uptake onto acidic sulfate aerosol. The model is constrained by measurements of the IEPOX reactive up-take coefficient, IEPOX and aerosol chamber wall losses, chamber-measured aerosol mass and surface area concentra-tions, aerosol thermodynamic model calculaconcentra-tions, and offline filter-based measurements of SOA tracers. By requiring the model output to match the SOA growth and offline filter mea-surements collected during the chamber experiments, we de-rive estimates of the tracer formation reaction rate constants that have not yet been measured or estimated for bulk solu-tions.
1 Introduction
The gas-phase photooxidation of isoprene (2-methyl-1,3-butadiene), the largest biogenic volatile organic compound (VOC) emitted worldwide (Guenther et al., 2012), yields iso-meric isoprene epoxydiols (IEPOX) (Paulot et al., 2009). Subsequent acid-catalyzed multiphase chemistry of IEPOX is a significant source of secondary organic aerosol (SOA) mass (Lin et al., 2012; Surratt et al., 2010). In recent field studies, up to 50 % of summertime aerosol mass loadings in the southeastern United States have been attributed to SOA resulting from IEPOX heterogeneous reactions (Budisulis-tiorini et al., 2013, 2015; Lin et al., 2013b). Similar IEPOX-derived SOA influences are expected in areas with large isoprene emissions, such as forests primarily composed of broadleaf vegetation. As a significant SOA precursor, IEPOX has implications regarding potential climate forcing due to the scattering of incoming radiation and also impacts human health due to its large contribution to PM2.5(particulate
mat-ter<2.5 µm in diameter) mass (Chung and Seinfeld, 2002; Dockery et al., 1993).
as the precursor, the particle-phase products are referred to as IEPOX-SOA “tracers” (i.e., “molecular markers”). The efficiency of gas-phase IEPOX removal by aerosol surface area is thought to be largely a function of aerosol acidity and concentration of nucleophiles that can react with accom-modated IEPOX by acid-catalyzed oxirane ring opening to yield the tracer compounds (Eddingsaas et al., 2010; Gas-ton et al., 2014; Nguyen et al., 2014; Piletic et al., 2013; Riedel et al., 2015; Surratt et al., 2007b). Products of the re-actions have been proposed to include the 2-methyltetrols (2-methylthreitol and 2-methylerythritol) from addition of wa-ter, and the corresponding isomeric sulfate esters (IEPOX-OS) from sulfate addition (Reactions R1 and R2) (Claeys et al., 2004; Surratt et al., 2007a).
IEPOX(aq)+H++H2O→2-methyltetrols + H+ (R1)
IEPOX(aq)+H++SO2−4 →IEPOX-OS+H+ (R2)
Products of nitrate addition, while observed less often, are also thought to be important in certain cases (Darer et al., 2011; Lin et al., 2012). Additional condensed-phase reac-tions are thought to form IEPOX-derived dimeric species (2-methyltetrol dimers, OS dimers), isomeric C5-alkene
triols, cyclodehydration products (3-methyltetrahydrofuran-3,4-diols (3-MeTHF-(3-methyltetrahydrofuran-3,4-diols)), and higher-order oligomers which have also been identified in field and chamber stud-ies (Lin et al., 2012, 2014, 2013b; Wang et al., 2005). In the aerosol phase, these oligomers or other high-molecular-weight aerosol species may be in dynamic equilibrium with low-molecular-weight tracers (i.e., equilibrium between monomers and oligomers) (Kolesar et al., 2015). The for-mation of unsaturated IEPOX-derived oligomers has been linked to brown carbon formation and therefore potential ra-diative forcing (Lin et al., 2014). General acids, such as bisul-fate, can also serve as oxirane ring-opening catalysts, though rates for such reactions tend to be significantly slower than rates for acid catalysis under the majority of aerosol condi-tions (Eddingsaas et al., 2010; Gaston et al., 2014).
To date, only the formation of IEPOX-derived 2-methyltetrols and/or organosulfates has been investigated through direct bulk kinetic measurements (Cole-Filipiak et al., 2010), the extension of bulk kinetic measurements of sur-rogate epoxides (Eddingsaas et al., 2010), and computational estimates (Piletic et al., 2013). While the tetrol and OS tracers are responsible for a sizeable fraction of IEPOX-derived SOA (Lin et al., 2013a, b), the remaining tracer for-mation reactions have yet to be examined, and accurate es-timates would benefit SOA modeling efforts (Karambelas et al., 2014; McNeill et al., 2012; Pye et al., 2013). Here we present an approach that combines chamber experiments, of-fline quantification of SOA tracers from filter samples using authentic standards, and modeling to estimate the formation reaction rate constants of IEPOX-derived SOA tracers whose formation rates are currently unknown. This has been done for a single seed aerosol system, acidified ammonium sulfate
at low relative humidity (RH), but the estimated rate coeffi-cients are anticipated to be independent of the seed aerosol used.
2 Methods
2.1 Chamber experiments
Experiments were conducted under dark conditions in an in-door 10 m3Teflon smog chamber at the University of North Carolina at Chapel Hill (UNC) (Lin et al., 2014; Riedel et al., 2015). Acidic ammonium sulfate seed aerosol was injected into the dry (RH<5 %) chamber using a custom-built atom-izer with an atomizing solution of 0.06 M (NH4)2SO4 and
0.06 M H2SO4 until the desired total aerosol mass
concen-tration was achieved. After seed injection, the chamber was left static for at least 30 min to ensure that the seed aerosol concentration was stable and uniformly mixed. IEPOX was then injected into the chamber for 2 h by passing∼4 L min−1 of N2(g) through a glass manifold heated at 60◦C
contain-ing 50–300 µL of a 100 mg mL−1 ethyl acetate solution of trans-β-IEPOX (Zhang et al., 2012), the predominant IEPOX isomer (Bates et al., 2014). The majority of the SOA mass growth occurred within the first hour of the injection period; after 2 h, significant SOA growth had ceased after the major-ity of IEPOX was injected and reacted.
Chamber aerosol number distributions, which were sub-sequently converted to total aerosol surface area and vol-ume concentrations, were measured by a scanning electrical mobility system (SEMS v5.0, Brechtel Manufacturing Inc. – BMI) containing a differential mobility analyzer (DMA, BMI) coupled to a mixing condensation particle counter (MCPC Model 1710, BMI). Total volume concentration of seed aerosols was converted to total mass concentration as-suming a density of 1.6 g mL−1, in accord with aerosol ther-modynamic model outputs described in more detail below, and SOA total volume concentration was converted to to-tal mass concentrations assuming a density of 1.25 g mL−1 (Kroll et al., 2006). The chamber RH and temperature were monitored with a commercial RH/temperature probe (OM-62, Omega Engineering Inc.).
2.2 SOA tracer quantification
On completion of IEPOX injection, a filter sample was collected for analysis of the chamber-generated SOA. Aerosols were collected onto 46.2 mm Teflon filters (part no.: SF17471, Tisch Scientific) in a stainless-steel filter holder for 2 h at ∼15 L min−1 with a carbon strip denuder (Sun-set Labs) upstream of the filter holder. Filters were stored in 20 mL scintillation vials at−20◦C prior to extraction and analysis. Denuder efficiency tests were performed by passing
∼500 ppbv of IEPOX in N2(g) at low RH (<5 %) through
condi-tions, as measured by an iodide-adduct high-resolution time-of-flight chemical ionization mass spectrometer (HR-TOF-CIMS, Aerodyne Research Inc.) (Lee et al., 2014). The de-nuder is expected to be less efficient at the higher flow veloc-ities and shorter residence times during filter collection.
As described in previous studies (Lin et al., 2012; Sur-ratt et al., 2010), IEPOX-derived SOA components were extracted from filters with high-purity methanol prior to analysis. Analysis was performed on a gas chromatograph coupled to a mass spectrometer equipped with an electron ionization source (GC/EI-MS, Hewlett-Packard 5890 Se-ries II GC coupled to a Hewlett-Packard 5971A MS) and an ultra-performance liquid chromatograph/high-resolution quadrupole time-of-flight mass spectrometer equipped with electrospray ionization (UPLC/ESI-HR-QTOFMS, Agilent 6500 Series). 2-Methyltetrols, C5-alkene triols,
3-MeTHF-3,4-diols, and the IEPOX-derived dimer were quantified by GC/EI-MS with prior trimethylsilylation. GC/EI-MS cali-brations were performed with authentic 2-methyltetrol and 3-MeTHF-3,4-diol standards (Budisulistiorini et al., 2015; Zhang et al., 2012). In the absence of authentic standards, the triols and dimer were assumed to have the same re-sponse factor as the 2-methyltetrols (Lin et al., 2012, 2013b). Aliquots of filter extracts were reconstituted in a 50:50 (v/v) methanol:water mixture from which the IEPOX-OS and IEPOX-derived dimer organosulfate (IEPOX-dimerOS) were quantified using UPLC/ESI-HR-QTOFMS operated in the negative ion mode. An authentic IEPOX-OS standard was used for calibration, and IEPOX-dimerOS was assumed to have the same response factor as the IEPOX-OS standard (Budisulistiorini et al., 2015).
2.3 Model setup and evaluation
Reaction kinetics of SOA generation were investigated with a zero-dimensional time-dependent chemical box model incor-porating explicit aqueous-phase tracer formation. The model is initialized with the amount of trans-β-IEPOX added to the injection manifold and the measured seed aerosol to-tal surface area and mass concentration. Estimates of the aqueous-phase molar concentrations of the inorganic seed aerosol species ([H+], [H2O], [HSO−4], [SO2−4 ]) and the
to-tal volume of the aqueous phase were obtained from the Ex-tended AIM Aerosol Thermodynamics Model III (AIM, http: //www.aim.env.uea.ac.uk/aim/aim.php) (Clegg et al., 1998; Wexler and Clegg, 2002). The composition of the atomizer solution was used as the AIM inputs with a RH of 10 %, as AIM does not allow RH inputs <10 %. As is typical with aerosol thermodynamic model calculations, the aerosol com-ponents were treated as a metastable solution, thereby sup-pressing the formation of solid-phase species (Hennigan et al., 2015). Given the low chamber RH and the composition of the atomizer solution, the seed aerosol was highly acidic, and this assumption is likely valid (Cziczo et al., 1997; Se-infeld and Pandis, 2006). While some gas-phase
measure-ments might be used to constrain aerosol thermodynamic models like AIM, such measurements (e.g., gas-phase am-monia) were unavailable for this study. Furthermore, the ac-tual state of aerosols at low RH is difficult to represent in such models. As a consequence, estimates presented here may be limited by the ability of so-called “reverse-mode” thermody-namic aerosol model calculations to appropriately represent the aerosols in the chamber.
A constant IEPOX–aerosol reaction probability (γ ) of 0.021 was assumed over the course of modeled experiments, which is consistent with that measured for similar seed aerosol systems (Gaston et al., 2014; Riedel et al., 2015). The resulting pseudo-first-order heterogeneous uptake rate coef-ficient (khet)of IEPOX to the aerosol phase was then
calcu-lated by Eq. (1):
khet=γ Saω/4, (1)
whereSais the total seed aerosol surface area concentration,
and ω is the mean molecular speed of gas-phase IEPOX. This approach neglects gas-phase diffusion – the effects of which are expected to be minor for theγ and particles sizes involved here (Gaston et al., 2014; Thornton et al., 2003). Aerosol-phase diffusion, adsorption/desorption of aerosol components, and other potential limitations that, while un-certain, have been explored in 1-D model studies for other systems are also not considered (Roldin et al., 2014; Shi-raiwa et al., 2013; Wilson et al., 2012). Once IEPOX has partitioned to the particle phase (IEPOX(aq))it is allowed to
react with the aerosol constituents to form the SOA tracer species. In addition to Reactions (R1) and (R2), the model in-corporates acid-catalyzed reactions to form C5-alkene triols,
3-MeTHF-3,4-diols, IEPOX-dimer, and IEPOX-dimerOS – Reactions (R3)–(R6) below. The model also tracks the for-mation of “other SOA” – defined as the difference between the chamber-measured SOA mass and the sum of the quan-tified tracer mass loadings – comprised of unidenquan-tified SOA products, most likely from acid-catalysis, as is the case for the other IEPOX tracers. Species comprising other SOA may be oligomers formed by acid-catalyzed coupling of tetrols or IEPOX-OS with IEPOX concomitant with reactive uptake (Lin et al., 2014). Since we are unable to differentiate the extent to which the other SOA is formed from these two, or other, pathways, the model assumes all of the other SOA is formed from reactions of IEPOX-OS with IEPOX (Reac-tion R7) and has a molecular weight of 334 g mole−1, the
same as that of IEPOX-dimerOS.
IEPOX(aq)+H+→C5-alkene triols + H+ (R3)
IEPOX(aq)+H+→3-MeTHF-3,4-diols + H+ (R4)
IEPOX(aq)+H++2-methyltetrols→IEPOX-dimer + H+
(R5) IEPOX(aq)+H++IEPOX-OS→IEPOX-dimerOS + H+
The coupled differential equations corresponding to the production and/or loss of IEPOX(g), IEPOX(aq),
2-methyltetrols, IEPOX-OS, C5-alkene triols,
3-MeTHF-3,4-diols, IEPOX-dimer, IEPOX-dimerOS, other SOA, HSO−4, and SO2−4 are integrated over the entire IEPOX injection du-ration (2 h) or until the observed chamber SOA mass con-centration has reached a maximum. [H+] and [H2O] are
held constant over the course of a model run. Under the as-sumption that HSO−4 is converted to SO2−4 as SO2−4 forms IEPOX-OS, the equilibrium ratio (RSO4≡SO
2− 4 /HSO
− 4)is
held constant. Additionally, a general first-order loss, Reac-tion (R8) from the formaReac-tion of volatile products that do not contribute to the overall SOA mass, is applied to IEPOX(aq).
IEPOX(aq)→volatile products (R8)
This reaction lowers the molar SOA yield (ϕSOA)
be-low unity. First-order wall losses estimated for the cham-ber from a previous study are also applied to gas-phase IEPOX (kwall=9.4×10⁻⁵s−1)and all aerosol-phase species
(kwall-aerosol=1×10⁻⁵s−1)(Riedel et al., 2015). The rate of
IEPOX injection into the chamber is simulated in the model by an exponential decay of IEPOX in the injection mani-fold. The decay constant (λ)was varied between 1×10⁻³ and 2×10⁻³s−1as a fitting parameter to better match the timescale of observed SOA growth. However, over the 2 h duration of the experiment, the value of the decay constant had a negligible effect on the final model-predicted SOA growth.
The complete set of differential equations used to track each of the individual species in the model is provided in Eqs. (2)–(12).
d[IEPOX(g)]
dt =λ[IEPOX(manifold)] −khet[IEPOX(g)]
−kwall[IEPOX(g)] (2)
d[IEPOX(aq)]
dt =khet[IEPOX(g)] −kR1[IEPOX(aq)][H2O]
H+
−kR2[IEPOX(aq)] h
SO2−4 i H+
−kR3[IEPOX(aq)]H+−kR4[IEPOX(aq)]H+
−kR5[IEPOX(aq)]H+[tetrol]
−kR6[IEPOX(aq)]H+[IEPOX-OS]
−kR7[IEPOX(aq)]H+[IEPOX-OS]
−kR8[IEPOX(aq)] −kwall-aerosol[IEPOX(aq)] (3) d[tetrol]
dt =kR1[IEPOX(aq)][H2O]
H+
−kwall-aerosol[tetrol] (4)
d[IEPOX-OS]
dt =kR2[IEPOX(aq)]
h SO2−4 i
H+
−kwall-aerosol[IEPOX-OS] (5)
d[triol]
dt =kR3[IEPOX(aq)]
H+
−kwall-aerosol[triol] (6)
0 20 40 60 80 100
100 150 200 250 300
Experiment time, minutes
A
e
ro
s
o
l
m
a
s
s
, µµµµ
g
m
-3
Model Chamber data
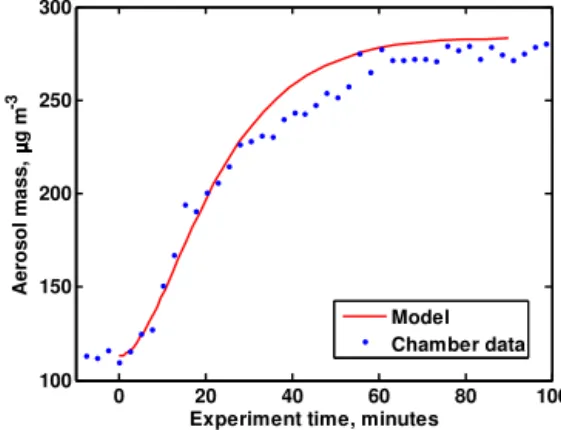
Figure 1.Aerosol mass loadings from IEPOX-SOA Exp. no. 1 and
corresponding model output. IEPOX injection starts at experiment timet=0 min.
d[diolTHF]
dt =kR4[IEPOX(aq)]
H+
−kwall-aerosol[diolTHF] (7)
d[dimer]
dt =kR5[IEPOX(aq)]
H+[tetrol]
−kwall-aerosol[dimer] (8)
d[dimerOS]
dt =kR6[IEPOX(aq)]
H+
[IEPOX-OS]
−kwall-aerosol[dimerOS] (9)
d[other]
dt =kR7[IEPOX(aq)]
H+
[IEPOX-OS]
−kwall-aerosol[other] (10)
d[HSO−4]
dt = −kR2[IEPOX(aq)]
H+ HSO−4
RSO4
−kwall-aerosol[HSO−4] (11)
d[SO2−4 ]
dt =kR2[IEPOX(aq)]
H+ HSO−4RSO4
−kR2[IEPOX(aq)]H+ h
SO2−4 i
−kwall-aerosol[SO2−4 ] (12)
Rate constants (k) for Reactions (R1)–(R8) were systemi-cally varied until model output closely matched the offline tracer measurements. Initial values were assigned to kR1–
kR8, and the model was run in a continuous loop, varying
0 20 40 60 80 100 0 0.2 0.4 0.6 0.8 1
Model time, minutes
Mo d e le d I E P O X(a q ) , m o le s L -1
Figure 2. Model output of aqueous-phase IEPOX concentrations
during Exp. no. 1 simulation.
3 Results and discussion
3.1 Model output and comparison to chamber data
Five chamber experiments were performed with the low-RH (NH4)2SO4+H2SO4seed aerosol system. Table 1 lists
ini-tial chamber conditions, including seed aerosol surface area and mass loading and the mass of IEPOX placed in the in-jection manifold. Figure 1 shows aerosol mass data and the corresponding model simulation for one experiment (Exp. no. 1). The initial seed aerosol mass loading is 113 µg m−3, and IEPOX injection is initiated at experiment time (t )=0. SOA mass growth is most rapid for 30 min post-injection and slows thereafter, reaching a maximum total aerosol mass concentration of∼275 µg m−3att≈90 min. The timescale of SOA growth for other experiments was similar to that in Fig. 1. Figure 2 shows the model-predicted aqueous-phase IEPOX concentration for Exp. no. 1. Despite the large amount of IEPOX injected into the chamber, the maximum predicted aqueous-phase IEPOX concentration reaches only 0.92 moles L−1 due to rapid formation of the SOA prod-ucts. For all simulated experiments, the model reproduced the SOA growth well, both the rate and the maximum mass loading. Nevertheless, caution is necessary in interpreting the significance of this agreement since the model parameters are adjusted to maximize the agreement.
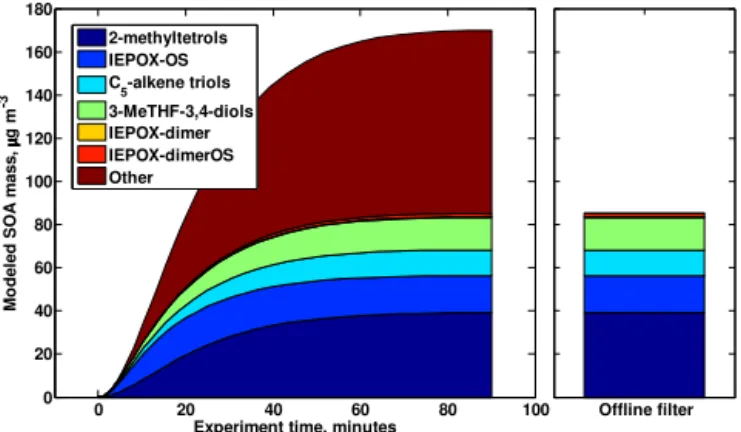
Figure 3 compares the modeled evolution of the SOA trac-ers in Exp. no. 1 to offline measurements of the correspond-ing tracers. Measured tracer mass loadcorrespond-ings for all experi-ments are provided in Table 2. The tracer concentrations pre-dicted by the model agree well with the filter measurements, differing by<5 % for all tracers.
The model also predicts significant titration of total aque-ous inorganic sulfate species ([SO2−4 ]+[HSO−4]) over the course of each experiment due to the formation of IEPOX-OS, IEPOX-dimerIEPOX-OS, and other SOA. Sulfate loadings were predicted to drop 36, 28, and 27 % for the 30, 15, and 5 mg IEPOX injections, respectively. Figure 4 shows the
model-0 20 40 60 80 100
0 20 40 60 80 100 120 140 160 180
Experiment time, minutes
M o d e le d S O A m a s s
, µµµµ
g m -3 2-methyltetrols IEPOX-OS C
5-alkene triols
3-MeTHF-3,4-diols IEPOX-dimer IEPOX-dimerOS Other
Offline filter
Figure 3.Model output of IEPOX-SOA tracers (left panel) and
the associated filter-based tracer measurements (right panel) for Exp. no. 1. The “other SOA” is calculated as the difference be-tween the chamber-measured aerosol mass loadings and the sum of the filter-based tracer loadings.
0 20 40 60 80 100
60 65 70 75 80 85 90 95
Model time, minutes
M o d e le d a e ro s o l s u lf a te
, µµµµ
g
m
-3
Figure 4. Model output of predicted titration of total inorganic
aerosol sulfate ([SO2−4 ]+[HSO−4]) due to sulfated tracer forma-tion during Exp. no. 1 simulaforma-tion.
predicted sulfate titration for Exp. no. 1, in which sulfate loading drops from an initial value of∼95 to∼60 µg m−3at the conclusion of the model run. These titration levels closely match those reported in Surratt et al. (2007a) for a low-NOx isoprene oxidation experiment with acidified ammonium sul-fate seed aerosol.
3.2 Model-predicted tracer formation kinetics
Table 1.Summary of conditions for each chamber SOA experiment.
Exp. IEPOX injected Seed surface area Seed mass
no. mg µm2cm−3 µg m−3
1 30 1480 113
2 30 1660 125
3 15 1200 76
4 5 800 59
5 5 800 57
Table 2.Tracer mass loadings for each chamber SOA experiment.
Exp. no. Loading/µg m−3
Total SOA 2-Methyltetrols IEPOX-OS C5-alkene triols 3-MeTHF-3,4-diols IEPOX-dimer IEPOX-dimerOS Other SOA
1 170.00 39.13 16.97 12.01 15.05 0.40 1.45 84.99
2 185.00 41.35 23.69 12.17 13.67 0.70 3.01 90.41
3 131.00 34.01 13.25 35.31 3.68 3.59 4.01 37.15
4 60.99 3.72 27.13 18.42 0.04 0.27 10.51 0.90
5 63.00 3.97 27.44 19.36 0.10 0.25 9.05 2.83
the relationship between 2-methyl-2,3-epoxybutane and 2,3-epoxybutane reaction rate constants to estimate those for 2-methyl-2,3-epoxybutane-1,4-diol (β-IEPOX). For 2-methyltetrol formation, Pye et al. (2013) used theβ-IEPOX value from Eddingsaas et al. (2010) and assumed a wa-ter concentration of 55 M to derive a third-order rate con-stant with an explicit water dependence. The resulting rate constants are 9×10⁻⁴M−2s−1 for the overall for-mation reaction of 2-methyltetrol (Reaction R1) and 2×
10−4M−2s−1for the overall formation reaction of IEPOX-OS (Reaction R2). A similar treatment can be applied to the pseudo-second-order hydrolysis rate constant (2-methyltetrol formation) for a mixture of cis- and trans-β -IEPOX from Cole-Filipiak et al. (2010) to obtain a rate con-stant of 6.5×10⁻⁴M−2s−1. Purely computational estimates of 5.3×10⁻² and 5.2×10⁻¹M−2s−1 for 2-methyltetrol and IEPOX-OS, respectively, are also available for com-parison (Piletic et al., 2013). Apart from the computational study, these rate constants are of the same order as those predicted by the model, 3.4±3.2×10⁻⁴M−2s−1 for 2-methyltetrols and 4.8±3.4×10⁻⁴M−2s−1for IEPOX-OS, indicating that the model gives a reasonable representation of the kinetics of the multiphase process in light of the low-RH, non-ideal conditions in the highly concentrated chamber aerosols.
Epoxide ring-opening reactions by general acids (i.e., bisulfate) have not been explicitly included in the model. The contribution is expected to be negligible as the branching ra-tio between the bisulfate and H+-catalyzed reaction channels is likely to heavily favor the H+ channel. For example, in Exp. no. 1,∼98 % of the epoxide ring opening is predicted to proceed through the H+-catalyzed channel compared to that of bisulfate.
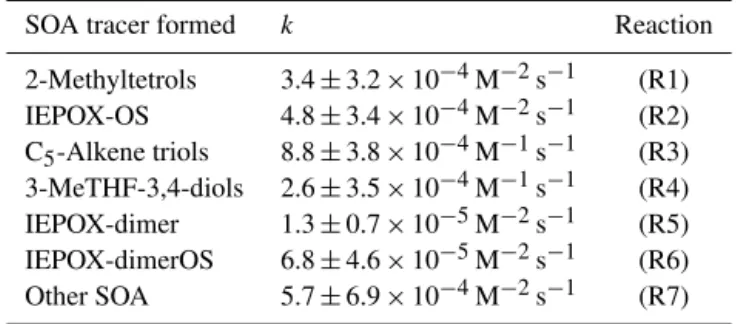
Table 3. Model-predicted formation reaction rate constants for
IEPOX-SOA tracers.
SOA tracer formed k Reaction
2-Methyltetrols 3.4±3.2×10⁻⁴M−2s−1 (R1)
IEPOX-OS 4.8±3.4×10⁻⁴M−2s−1 (R2)
C5-Alkene triols 8.8±3.8×10⁻⁴M−1s−1 (R3) 3-MeTHF-3,4-diols 2.6±3.5×10⁻⁴M−1s−1 (R4)
IEPOX-dimer 1.3±0.7×10⁻⁵M−2s−1 (R5)
IEPOX-dimerOS 6.8±4.6×10⁻⁵M−2s−1 (R6)
Other SOA 5.7±6.9×10⁻⁴M−2s−1 (R7)
Aerosol surface area was held constant at initial seed aerosol levels over the course of a model run, and thuskhetis
insensitive to additional surface area resulting from IEPOX-derived SOA (Riedel et al., 2015). However, the presence of organics such as polyethylene glycol has been shown to lowerγ and thereforekhet(Gaston et al., 2014), and it is
most a factor of 2.4 increase for IEPOX-OS and a 23 % decrease, on average, across the remaining rate constants. For the 600 g mole−1case, all of the rate constants were de-creased by 25 % on average. Apart from the IEPOX-OS rate constant under the 100 g mole−1case, which was within 2σ, all of the rate constants resulting from these sensitivity tests fell within the stated 1σ uncertainties given in Table 3.
Given the estimates of the tracer formation rate constants, the calculated khet, and the model output, the molar SOA
yield (ϕSOA) can be estimated as the ratio of the sum of
the tracer production rates over the IEPOX(g)heterogeneous
loss rate (Riedel et al., 2015). Averaged over the five experi-ments,ϕSOA=0.078±0.025 (1σ ), with the largestϕSOA
be-ing from the 5 mg IEPOX injections and the smallestϕSOA
being from the 30 mg injections. The drop inϕSOAwith
in-creased IEPOX injection mass is a result of the inin-creased amount of other SOA measured in these experiments. The higher molecular weight assumed for the oligomeric prod-ucts relative to the molecular weight of the tracers requires less IEPOX to be reacted in order to match the total SOA mass loadings, thus driving down ϕSOA. As described by
Matsunaga and Ziemann (2010) and Zhang et al. (2014), wall losses of VOC and SOA material can effectively decrease calculatedϕSOAfor chamber studies. Considering the IEPOX
and aerosol wall-loss rate constants provided above, the cor-rections for these experiments are minor (<2 % change to
ϕSOA). In general,ϕSOAshould mainly be a function of the
availability of nucleophiles, provided there is ample time for uptake and tracer formation (Riedel et al., 2015). ϕSOA=
0.078 is similar to that predicted from an independent model-ing approach which estimated theϕSOAfor this aerosol
sys-tem at 0.1–0.12 (Riedel et al., 2015). These results indicate that the molar yield of SOA from IEPOX heterogeneous re-actions is likely to be significantly <1 for the majority of atmospheric conditions where aerosols are likely to contain more water and be less acidic than in this study.
3.3 Atmospheric implications
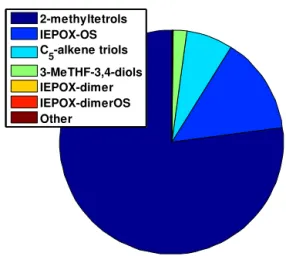
Figure 5 shows the model output after 6 h processing time, using as inputs the rate constants from Table 3 and ini-tial atmospheric conditions which might be representative of a daytime summer urban–rural mixed air mass: 50 % RH, ∼500 pptv gas-phase IEPOX, and 250 µm2cm−3 of ammonium bisulfate aerosol surface area, corresponding to an aerosol mass loading of ∼10 µg m−3. The model pre-dicts 0.37 µg m−3of total SOA, with the bulk (77 %) being 2-methyltetrols, and minor amounts of IEPOX-OS (14 %), C5-alkene triols (7 %), and 3-MeTHF-3,4-diols (2 %). The
remaining tracers – IEPOX-dimer, IEPOX-dimerOS, and other SOA – are predicted to form in small amounts (<0.6 ng m−3). At the increased RH and associated increase in aerosol liquid water, the 2-methyltetrols represent the majority of the formed tracers (see Eq. 4). With the lack of wall losses and the minor contribution of other SOA,
Total predicted SOA mass = 0.37 µµµµg m-3
2-methyltetrols IEPOX-OS C5-alkene triols
3-MeTHF-3,4-diols IEPOX-dimer IEPOX-dimerOS Other
Figure 5. Model-predicted IEPOX-SOA tracer distribution and
loadings for atmospherically relevant initial conditions.
which lowersϕSOA as described above,ϕSOA will be larger
(ϕSOA=0.125) for this atmospheric case compared to the
chamber simulations. Additionally, this simulation predicted no appreciable titration of total aqueous inorganic sulfate, suggesting that titration is unlikely to occur in atmospheric sulfate-containing aerosols given expected IEPOX mixing ratios on the order of 1 ppbv.
Keeping in mind that we cannot hope to capture two field studies perfectly for such a general model case, the model total IEPOX tracer loading predictions are in relatively close correspondence to recent measurements in the southeastern United States. Analysis of tracers in ambient PM2.5 collected by high-volume sampling
dur-ing summer 2010 in Yorkville, GA, determined that 2-methyltetrols (330 ng m−3), C5-alkene triols (290 ng m−3),
and IEPOX-OS (72 ng m−3)were major constituents, with minor amounts of 3-MeTHF-3,4-diols (27 ng m−3), IEPOX-dimerOS (5 ng m−3), and IEPOX-dimer (0.5 ng m−3) (Lin et al., 2012). IEPOX tracer mass loadings from analysis of high-volume PM2.5 samples collected at Look Rock,
TN, in summer 2013 as part of the Southern Oxidant and Aerosol Study (SOAS) were also dominated by IEPOX-OS (169.5 ng m−3), 2-methyltetrols (163.1 ng m−3), and C5
-alkene triols (144.4 ng m−3), whereas 3-MeTHF-3,4-diols (4.4 ng m−3)and IEPOX-dimerOS (1.4 ng m−3)made only minor contributions (Budisulistiorini et al., 2015).
4 Concluding remarks
precluded the extension of these kinetic studies to include humid conditions. A possible explanation for the enhance-ment of filter mass loadings could be subsequent reactions at the Teflon filter surface; however, appropriate controls are required to confirm such effects. The deviation in mass load-ings at higher RH indicates that artifacts may be introduced into field and chamber measurements during filter collection even when sampling through a carbon strip denuder.
Low-molecular-weight tracers with significant vapor pres-sures may be detected as a result of decomposition of SOA products. Such a possibility would dictate caution in adopt-ing the kinetic estimates presented here. The sum of these formation rates would likely represent an upper limit to the formation of such SOA species under the assumption that more than one tracer could potentially be formed from the degradation of these products. However, in the absence of evidence to the contrary, there is general agreement that trac-ers constitute a large fraction of IEPOX-SOA, and additional investigations are required prior to the proposal that certain SOA tracers represent decomposition products.
In summary, this study is a first approach to placing ki-netic constraints on the formation of species that have been quantified in laboratory and field measurements but lack di-rectly measured experimental rate constraints. While bulk solution rate constant estimates are desirable, such measure-ments pose a challenge when authentic standards are unavail-able or when surrogates do not adequately represent the true compounds. Additionally, it is unclear that bulk-phase kinet-ics can approximate aerosol-phase reactions where non-ideal conditions likely play a role. The flexible approach described here may readily be extended to other SOA production sys-tems known to have atmospheric importance.
This study approximates tracer branching ratios for the currently proposed SOA tracers resulting from IEPOX up-take, a necessary step to predict isoprene-derived SOA pro-duction in regional models that guide policy decisions. Ad-ditional laboratory studies to identify SOA products and elu-cidate formation mechanisms are important to ensure that both chamber and field measurements accurately reflect at-mospheric processes. Modeling developed on the basis of such experimental systems can then be extended to large-scale models.
Acknowledgements. This publication was made possible in part by Environmental Protection Agency (EPA) grant no. R835404. Its contents are solely the responsibility of the grantee and do not necessarily represent the official views of the EPA. Further, the EPA does not endorse the purchase of any commercial products or services mentioned in the publication. This work is also funded in part by the National Science Foundation under CHE 1404644 and CHE 1404573 and through a grant from the Texas Commission on Environmental Quality (TCEQ), administered by The University of Texas through the Air Quality Research Program. The contents, findings, opinions, and conclusions are the work of the authors and do not necessarily represent findings, opinions, or conclusions
of the TCEQ. The authors also thank Tianqu Cui and Sri Hapsari Budisulistiorini (UNC) and Felipe Lopez-Hilfiker (UW) for helpful discussions.
Edited by: M. Shiraiwa
References
Bates, K. H., Crounse, J. D., St. Clair, J. M., Bennett, N. B., Nguyen, T. B., Seinfeld, J. H., Stoltz, B. M., and Wennberg, P. O.: Gas Phase Production and Loss of Isoprene Epoxydiols, J. Phys. Chem. A, 118, 1237–1246, doi:10.1021/jp4107958, 2014. Budisulistiorini, S. H., Canagaratna, M. R., Croteau, P. L., Marth,
W. J., Baumann, K., Edgerton, E. S., Shaw, S. L., Knipping, E. M., Worsnop, D. R., Jayne, J. T., Gold, A., and Surratt, J. D.: Real-Time Continuous Characterization of Secondary Or-ganic Aerosol Derived from Isoprene Epoxydiols in Down-town Atlanta, Georgia, Using the Aerodyne Aerosol Chemi-cal Speciation Monitor, Environ. Sci. Technol., 47, 5686–5694, doi:10.1021/es400023n, 2013.
Budisulistiorini, S. H., Li, X., Bairai, S. T., Renfro, J., Liu, Y., Liu, Y. J., McKinney, K. A., Martin, S. T., McNeill, V. F., Pye, H. O. T., Nenes, A., Neff, M. E., Stone, E. A., Mueller, S., Knote, C., Shaw, S. L., Zhang, Z., Gold, A., and Surratt, J. D.: Examining the effects of anthropogenic emissions on isoprene-derived secondary organic aerosol formation during the 2013 Southern Oxidant and Aerosol Study (SOAS) at the Look Rock, Tennessee ground site, Atmos. Chem. Phys., 15, 8871–8888, doi:10.5194/acp-15-8871-2015, 2015.
Chung, S. H. and Seinfeld, J. H.: Global distribution and climate forcing of carbonaceous aerosols, J. Geophys. Res.-Atmos., 107, AAC 14-11–AAC 14-33, doi:10.1029/2001JD001397, 2002. Claeys, M., Graham, B., Vas, G., Wang, W., Vermeylen, R.,
Pashyn-ska, V., Cafmeyer, J., Guyon, P., Andreae, M. O., Artaxo, P., and Maenhaut, W.: Formation of Secondary Organic Aerosols Through Photooxidation of Isoprene, Science, 303, 1173–1176, doi:10.1126/science.1092805, 2004.
Clegg, S. L., Brimblecombe, P., and Wexler, A. S.: Thermo-dynamic Model of the System H+-NH+4-Na+-SO2−4 -NO−3 -Cl−-H2O at 298.15 K, J. Phys. Chem. A, 102, 2155–2171, doi:10.1021/jp973043j, 1998.
Cole-Filipiak, N. C., O’Connor, A. E., and Elrod, M. J.: Kinet-ics of the Hydrolysis of Atmospherically Relevant Isoprene-Derived Hydroxy Epoxides, Environ. Sci. Technol., 44, 6718– 6723, doi:10.1021/es1019228, 2010.
Cziczo, D. J., Nowak, J. B., Hu, J. H., and Abbatt, J. P. D.: In-frared spectroscopy of model tropospheric aerosols as a func-tion of relative humidity: Observafunc-tion of deliquescence and crystallization, J. Geophys. Res.-Atmos., 102, 18843–18850, doi:10.1029/97JD01361, 1997.
Darer, A. I., Cole-Filipiak, N. C., O’Connor, A. E., and Elrod, M. J.: Formation and Stability of Atmospherically Relevant Isoprene-Derived Organosulfates and Organonitrates, Environ. Sci. Tech-nol., 45, 1895–1902, doi:10.1021/es103797z, 2011.
J. Med., 329, 1753–1759, doi:10.1056/NEJM199312093292401, 1993.
Eddingsaas, N. C., VanderVelde, D. G., and Wennberg, P. O.: Ki-netics and Products of the Acid-Catalyzed Ring-Opening of At-mospherically Relevant Butyl Epoxy Alcohols, J. Phys. Chem. A, 114, 8106–8113, doi:10.1021/jp103907c, 2010.
Gaston, C. J., Riedel, T. P., Zhang, Z., Gold, A., Surratt, J. D., and Thornton, J. A.: Reactive Uptake of an Isoprene-Derived Epoxy-diol to Submicron Aerosol Particles, Environ. Sci. Technol., 48, 11178–11186, doi:10.1021/es5034266, 2014.
Guenther, A. B., Jiang, X., Heald, C. L., Sakulyanontvittaya, T., Duhl, T., Emmons, L. K., and Wang, X.: The Model of Emissions of Gases and Aerosols from Nature version 2.1 (MEGAN2.1): an extended and updated framework for modeling biogenic emis-sions, Geosci. Model Dev., 5, 1471–1492, doi:10.5194/gmd-5-1471-2012, 2012.
Hennigan, C. J., Izumi, J., Sullivan, A. P., Weber, R. J., and Nenes, A.: A critical evaluation of proxy methods used to estimate the acidity of atmospheric particles, Atmos. Chem. Phys., 15, 2775– 2790, doi:10.5194/acp-15-2775-2015, 2015.
Karambelas, A., Pye, H. O. T., Budisulistiorini, S. H., Surratt, J. D., and Pinder, R. W.: Contribution of Isoprene Epoxy-diol to Urban Organic Aerosol: Evidence from Modeling and Measurements, Environ. Sci. Technol. Lett., 1, 278–283, doi:10.1021/ez5001353, 2014.
Kolesar, K. R., Li, Z., Wilson, K. R., and Cappa, C. D.: Heating-induced evaporation of nine different secondary or-ganic aerosol types, Environ. Sci. Technol., 49, 12242–12252, doi:10.1021/acs.est.5b03038, 2015.
Kroll, J. H., Ng, N. L., Murphy, S. M., Flagan, R. C., and Se-infeld, J. H.: Secondary Organic Aerosol Formation from Iso-prene Photooxidation, Environ. Sci. Technol., 40, 1869–1877, doi:10.1021/es0524301, 2006.
Lee, B. H., Lopez-Hilfiker, F. D., Mohr, C., Kurtén, T., Worsnop, D. R., and Thornton, J. A.: An Iodide-Adduct High-Resolution Time-of-Flight Chemical-Ionization Mass Spectrometer: Appli-cation to Atmospheric Inorganic and Organic Compounds, En-viron. Sci. Technol., 48, 6309–6317, doi:10.1021/es500362a, 2014.
Lin, Y.-H., Zhang, Z., Docherty, K. S., Zhang, H., Budisulistior-ini, S. H., Rubitschun, C. L., Shaw, S. L., Knipping, E. M., Edgerton, E. S., Kleindienst, T. E., Gold, A., and Surratt, J. D.: Isoprene Epoxydiols as Precursors to Secondary Organic Aerosol Formation: Acid-Catalyzed Reactive Uptake Studies with Authentic Compounds, Environ. Sci. Technol., 46, 250– 258, doi:10.1021/es202554c, 2012.
Lin, Y.-H., Zhang, H., Pye, H. O. T., Zhang, Z., Marth, W. J., Park, S., Arashiro, M., Cui, T., Budisulistiorini, S. H., Sexton, K. G., Vizuete, W., Xie, Y., Luecken, D. J., Piletic, I. R., Edney, E. O., Bartolotti, L. J., Gold, A., and Surratt, J. D.: Epoxide as a precursor to secondary organic aerosol formation from isoprene photooxidation in the presence of nitrogen oxides, P. Natl. Acad. Sci., 110, 6718–6723, doi:10.1073/pnas.1221150110, 2013a. Lin, Y.-H., Knipping, E. M., Edgerton, E. S., Shaw, S. L., and
Sur-ratt, J. D.: Investigating the influences of SO2and NH3levels on isoprene-derived secondary organic aerosol formation using con-ditional sampling approaches, Atmos. Chem. Phys., 13, 8457– 8470, doi:10.5194/acp-13-8457-2013, 2013b.
Lin, Y.-H., Budisulistiorini, S. H., Chu, K., Siejack, R. A., Zhang, H., Riva, M., Zhang, Z., Gold, A., Kautzman, K. E., and Surratt, J. D.: Light-Absorbing Oligomer Formation in Secondary Or-ganic Aerosol from Reactive Uptake of Isoprene Epoxydiols, En-viron. Sci. Technol., 48, 12012–12021, doi:10.1021/es503142b, 2014.
Matsunaga, A. and Ziemann, P. J.: Gas-Wall Partitioning of Organic Compounds in a Teflon Film Chamber and Potential Effects on Reaction Product and Aerosol Yield Measurements, Aerosol Sci. Technol., 44, 881–892, doi:10.1080/02786826.2010.501044, 2010.
McNeill, V. F., Woo, J. L., Kim, D. D., Schwier, A. N., Wannell, N. J., Sumner, A. J., and Barakat, J. M.: Aqueous-Phase Secondary Organic Aerosol and Organosulfate Formation in Atmospheric Aerosols: A Modeling Study, Environ. Sci. Technol., 46, 8075– 8081, doi:10.1021/es3002986, 2012.
Nguyen, T. B., Coggon, M. M., Bates, K. H., Zhang, X., Schwantes, R. H., Schilling, K. A., Loza, C. L., Flagan, R. C., Wennberg, P. O., and Seinfeld, J. H.: Organic aerosol formation from the reactive uptake of isoprene epoxydiols (IEPOX) onto non-acidified inorganic seeds, Atmos. Chem. Phys., 14, 3497–3510, doi:10.5194/acp-14-3497-2014, 2014.
Paulot, F., Crounse, J. D., Kjaergaard, H. G., Kürten, A., St. Clair, J. M., Seinfeld, J. H., and Wennberg, P. O.: Unexpected Epoxide Formation in the Gas-Phase Photooxidation of Isoprene, Science, 325, 730–733, doi:10.1126/science.1172910, 2009.
Piletic, I. R., Edney, E. O., and Bartolotti, L. J.: A computational study of acid catalyzed aerosol reactions of atmospherically rel-evant epoxides, Phys. Chem. Chem. Phys., 15, 18065–18076, doi:10.1039/C3CP52851K, 2013.
Pye, H. O. T., Pinder, R. W., Piletic, I. R., Xie, Y., Capps, S. L., Lin, Y.-H., Surratt, J. D., Zhang, Z., Gold, A., Luecken, D. J., Hutzell, W. T., Jaoui, M., Offenberg, J. H., Kleindienst, T. E., Lewandowski, M., and Edney, E. O.: Epoxide Pathways Im-prove Model Predictions of Isoprene Markers and Reveal Key Role of Acidity in Aerosol Formation, Environ. Sci. Technol., 47, 11056–11064, doi:10.1021/es402106h, 2013.
Riedel, T. P., Lin, Y.-H., Budisulistiorini, S. H., Gaston, C. J., Thornton, J. A., Zhang, Z., Vizuete, W., Gold, A., and Surratt, J. D.: Heterogeneous Reactions of Isoprene-Derived Epoxides: Reaction Probabilities and Molar Secondary Organic Aerosol Yield Estimates, Environ. Sci. Technol. Lett., 2, 38–42, doi:10.1021/ez500406f, 2015.
Roldin, P., Eriksson, A. C., Nordin, E. Z., Hermansson, E., Mo-gensen, D., Rusanen, A., Boy, M., Swietlicki, E., Svennings-son, B., Zelenyuk, A., and Pagels, J.: Modelling non-equilibrium secondary organic aerosol formation and evaporation with the aerosol dynamics, gas- and particle-phase chemistry kinetic mul-tilayer model ADCHAM, Atmos. Chem. Phys., 14, 7953-7993, doi:10.5194/acp-14-7953-2014, 2014.
Seinfeld, J. H. and Pandis, S. N.: Atmospheric Chemistry and Physics: From Air Pollution to Climate Change, 2nd Edn., Wiley-Interscience, Hoboken, New Jersey, USA, 2006. Shiraiwa, M., Zuend, A., Bertram, A. K., and Seinfeld, J. H.:
Gas-particle partitioning of atmospheric aerosols: interplay of physi-cal state, non-ideal mixing and morphology, Phys. Chem. Chem. Phys., 15, 11441–11453, doi:10.1039/C3CP51595H, 2013. Surratt, J. D., Kroll, J. H., Kleindienst, T. E., Edney, E. O., Claeys,
M., Jaoui, M., Flagan, R. C., and Seinfeld, J. H.: Evidence for Organosulfates in Secondary Organic Aerosol, Environ. Sci. Technol., 41, 517–527, doi:10.1021/es062081q, 2007a. Surratt, J. D., Lewandowski, M., Offenberg, J. H., Jaoui, M.,
Klein-dienst, T. E., Edney, E. O., and Seinfeld, J. H.: Effect of Acid-ity on Secondary Organic Aerosol Formation from Isoprene, Environ. Sci. Technol., 41, 5363–5369, doi:10.1021/es0704176, 2007b.
Surratt, J. D., Chan, A. W. H., Eddingsaas, N. C., Chan, M., Loza, C. L., Kwan, A. J., Hersey, S. P., Flagan, R. C., Wennberg, P. O., and Seinfeld, J. H.: Reactive intermediates revealed in secondary organic aerosol formation from isoprene, P. Natl. Acad. Sci., 107, 6640–6645, doi:10.1073/pnas.0911114107, 2010.
Thornton, J. A., Braban, C. F., and Abbatt, J. P. D.: N2O5hydrolysis on sub-micron organic aerosols: the effect of relative humidity, particle phase, and particle size, Phys. Chem. Chem. Phys., 5, 4593–4603, doi:10.1039/b307498f, 2003.
Wang, W., Kourtchev, I., Graham, B., Cafmeyer, J., Maenhaut, W., and Claeys, M.: Characterization of oxygenated deriva-tives of isoprene related to 2-methyltetrols in Amazonian aerosols using trimethylsilylation and gas chromatography/ion trap mass spectrometry, Rapid Commun. Mass Sp., 19, 1343– 1351, doi:10.1002/rcm.1940, 2005.
Wexler, A. S., and Clegg, S. L.: Atmospheric aerosol models for systems including the ions H+, NH4+, Na+, SO42−, NO3−, Cl-, Br-, and H2O, J. Geophys. Res.-Atmos., 107, ACH 14-11– ACH 14-14, doi:10.1029/2001JD000451, 2002.
Wilson, K. R., Smith, J. D., Kessler, S. H., and Kroll, J. H.: The statistical evolution of multiple generations of oxidation products in the photochemical aging of chemically reduced organic aerosol, Phys. Chem. Chem. Phys., 14, 1468–1479, doi:10.1039/C1CP22716E, 2012.
Zhang, X., Cappa, C. D., Jathar, S. H., McVay, R. C., Ens-berg, J. J., Kleeman, M. J., and Seinfeld, J. H.: Influence of vapor wall loss in laboratory chambers on yields of sec-ondary organic aerosol, P. Natl. Acad. Sci., 111, 5802–5807, doi:10.1073/pnas.1404727111, 2014.