ACPD
15, 11223–11276, 2015Characterization of a
real-time tracer for
IEPOX-SOA
W. W. Hu et al.
Title Page
Abstract Introduction
Conclusions References
Tables Figures
◭ ◮
◭ ◮
Back Close
Full Screen / Esc
Printer-friendly Version
Interactive Discussion
Discussion
P
a
per
|
Discussion
P
a
per
|
Discussion
P
a
per
|
Discussion
P
a
per
|
Atmos. Chem. Phys. Discuss., 15, 11223–11276, 2015 www.atmos-chem-phys-discuss.net/15/11223/2015/ doi:10.5194/acpd-15-11223-2015
© Author(s) 2015. CC Attribution 3.0 License.
This discussion paper is/has been under review for the journal Atmospheric Chemistry and Physics (ACP). Please refer to the corresponding final paper in ACP if available.
Characterization of a real-time tracer for
Isoprene Epoxydiols-derived Secondary
Organic Aerosol (IEPOX-SOA) from
aerosol mass spectrometer
measurements
W. W. Hu
1,2, P. Campuzano-Jost
1,2, B. B. Palm
1,2, D. A. Day
1,2, A. M. Ortega
1,3,
P. L. Hayes
1,2,*, J. E. Krechmer
1,2, Q. Chen
4,5, M. Kuwata
4,6, Y. J. Liu
4,
S. S. de Sá
4, S. T. Martin
4, M. Hu
5, S. H. Budisulistiorini
7, M. Riva
7, J. D. Surratt
7,
J. M. St. Clair
8,**,***, G. Isaacman-Van Wertz
9, L. D. Yee
9, A. H. Goldstein
9,10,
S. Carbone
11, P. Artaxo
11, J. A. de Gouw
1,2,12, A. Koss
2,12, A. Wisthaler
13,14,
T. Mikoviny
13, T. Karl
15, L. Kaser
14,16, W. Jud
14, A. Hansel
14, K. S. Docherty
17,
N. H. Robinson
18, H. Coe
18,19, J. D. Allan
18,19, M. R. Canagaratna
20, F. Paulot
21,22,
and J. L. Jimenez
1,21
Cooperative Institute for Research in Environmental Sciences, University of Colorado, Boulder, CO, USA
2
ACPD
15, 11223–11276, 2015Characterization of a
real-time tracer for
IEPOX-SOA
W. W. Hu et al.
Title Page
Abstract Introduction
Conclusions References
Tables Figures
◭ ◮
◭ ◮
Back Close
Full Screen / Esc
Printer-friendly Version
Interactive Discussion
Discussion
P
a
per
|
Discussion
P
a
per
|
Discussion
P
a
per
|
Discussion
P
a
per
|
3
Department of Atmospheric and Oceanic Sciences, University of Colorado, Boulder, CO, USA
4
School of Engineering and Applied Sciences and Department of Earth and Planetary Sciences, Harvard University, Cambridge, MA, USA
5
State Key Joint Laboratory of Environmental Simulation and Pollution Control, College of Environmental Sciences and Engineering, Peking University, Beijing, China
6
Earth Observatory of Singapore, Nanyang Technological University, Singapore
7
Department of Environmental Sciences and Engineering, Gillings School of Global Public Health, The University of North Carolina at Chapel Hill, Chapel Hill, NC, USA
8
Division of Geological and Planetary Sciences, California Institute of Technology, Pasadena, CA, USA
9
Department of Environmental Science, Policy, and Management, University of California, Berkeley, CA, USA
10
Department of Civil and Environmental Engineering, University of California, Berkeley, CA, USA
11
Department of Applied Physics, University of Sao Paulo, Sao Paulo, Brazil
12
NOAA Earth System Research Laboratory, Boulder, CO, USA
13
Department of Chemistry, University of Oslo, Oslo, Norway
14
Institute for Ion Physics and Applied Physics, University of Innsbruck, Innsbruck, Austria
15
Institute of Meteorology and Geophysics, University of Innsbruck, Innsbruck, Austria
16
Atmospheric Chemistry Division (ACD), National Center for Atmospheric Research, Boulder, CO, USA
17
Alion Science and Technology, Research Triangle Park, NC, USA
18
School of Earth, Atmospheric and Environmental Sciences, University of Manchester, Manchester, UK
19
National Centre for Atmospheric Science, University of Manchester, Manchester, UK
20
Aerodyne Research, Inc., Billerica, MA, USA
21
NOAA Geophysical Fluid Dynamics Laboratory, Princeton, NJ, USA
22
Atmospheric and Oceanic Sciences, Princeton University, Princeton, NJ, USA
*
now at: Department of Chemistry, Université de Montréal, Montréal, QC, Canada
**
ACPD
15, 11223–11276, 2015Characterization of a
real-time tracer for
IEPOX-SOA
W. W. Hu et al.
Title Page
Abstract Introduction
Conclusions References
Tables Figures
◭ ◮
◭ ◮
Back Close
Full Screen / Esc
Printer-friendly Version
Interactive Discussion
Discussion
P
a
per
|
Discussion
P
a
per
|
Discussion
P
a
per
|
Discussion
P
a
per
|
***
now at: Joint Center for Earth Systems Technology, University of Maryland Baltimore County, Baltimore, MD, USA
Received: 3 March 2015 – Accepted: 20 March 2015 – Published: 16 April 2015 Correspondence to: J. L. Jimenez (jlj.colorado@gmail.com)
ACPD
15, 11223–11276, 2015Characterization of a
real-time tracer for
IEPOX-SOA
W. W. Hu et al.
Title Page
Abstract Introduction
Conclusions References
Tables Figures
◭ ◮
◭ ◮
Back Close
Full Screen / Esc
Printer-friendly Version
Interactive Discussion
Discussion
P
a
per
|
Discussion
P
a
per
|
Discussion
P
a
per
|
Discussion
P
a
per
|
Abstract
Substantial amounts of secondary organic aerosol (SOA) can be formed from isoprene
epoxydiols (IEPOX), which are oxidation products of isoprene mainly under low-NO
conditions. Total IEPOX-SOA, which may include SOA formed from other parallel
iso-prene low-NO oxidation pathways, was quantified by applying Positive Matrix
Factor-5
ization (PMF) to aerosol mass spectrometer (AMS) measurements. The IEPOX-SOA
fractions of OA in multiple field studies across several continents are summarized
here and show consistent patterns with the concentration of gas-phase IEPOX
sim-ulated by the GEOS-Chem chemical transport model. During the SOAS study, 78 %
of IEPOX-SOA is accounted for the measured molecular tracers, making it the
high-10
est level of molecular identification of an ambient SOA component to our knowledge.
Enhanced signal at C
5H
6O
+
(
m/z
82) is found in PMF-resolved IEPOX-SOA spectra.
To investigate the suitability of this ion as a tracer for IEPOX-SOA, we examine
f
C5H6O(
f
C5H6O=
C
5H
6O
+
/
OA) across multiple field, chamber and source datasets. A
back-ground of
∼
1.7
±
0.1 ‰ is observed in studies strongly influenced by urban,
biomass-15
burning and other anthropogenic primary organic aerosol (POA). Higher background
values of 3.1
±
0.8 ‰ are found in studies strongly influenced by monoterpene
emis-sions. The average laboratory monoterpene SOA value (5.5
±
2.0 ‰) is 4 times lower
than the average for IEPOX-SOA (22
±
7 ‰). Locations strongly influenced by isoprene
emissions under low-NO levels had higher
f
C5H6O(
∼
6.5
±
2.2 ‰ on average) than other
20
sites, consistent with the expected IEPOX-SOA formation in those studies.
f
C5H6Oin
IEPOX-SOA is always elevated (12–40 ‰) but varies substantially between locations,
which is shown to reflect large variations in its detailed molecular composition. The
low
f
C5H6O(
<
3 ‰) observed in non IEPOX-derived isoprene-SOA indicates that this
tracer ion is specifically enhanced from IEPOX-SOA, and is not a tracer for all SOA
25
per-ACPD
15, 11223–11276, 2015Characterization of a
real-time tracer for
IEPOX-SOA
W. W. Hu et al.
Title Page
Abstract Introduction
Conclusions References
Tables Figures
◭ ◮
◭ ◮
Back Close
Full Screen / Esc
Printer-friendly Version
Interactive Discussion
Discussion
P
a
per
|
Discussion
P
a
per
|
Discussion
P
a
per
|
Discussion
P
a
per
|
form well compared to the full PMF method. The uncertainty of the tracer method is
up to a factor of
∼
2 if the
f
C5H6Oof the local IEPOX-SOA is not available. When only
unit mass resolution data is available, as with the aerosol chemical speciation monitor
(ACSM), all methods may perform less well because of increased interferences from
other ions at
m/z
82. This study clarifies the strengths and limitations of the di
ff
erent
5
AMS methods for detection of IEPOX-SOA and will enable improved characterization
of this OA component.
1
Introduction
Isoprene (2-methyl-1,3-butadiene, C
5H
8) emitted by vegetation is the most abundant
non-methane hydrocarbon emitted to the Earth’s atmosphere (
∼
440–600 Tg C year
−1)
10
(Guenther et al., 2012). It is estimated to contribute substantially to the global
sec-ondary organic aerosol (SOA) budget (Guenther et al., 2012; Paulot et al., 2009b).
Higher SOA yields from isoprene are observed under low-NO
xconditions (Surratt et al.,
2010). Under low-NO conditions, i.e. when a substantial fraction of the peroxy radicals
do not react with NO, gas-phase isoprene epoxydiols (IEPOX) are produced with high
15
yield through a HO
x-mediated mechanism (Paulot et al., 2009b). Subsequently, IEPOX
can be taken up by acidic aerosols (Gaston et al., 2014), where IEPOX-SOA can be
formed through acid-catalyzed oxirane ring-opening of IEPOX (Nguyen et al., 2014;
Lin et al., 2012; Cole-Filipiak et al., 2010; Eddingsaas et al., 2010), which is thought
to be the main pathway to form IEPOX-SOA (Worton et al., 2013; Surratt et al., 2010;
20
Pye et al., 2013). Although the complete molecular composition of IEPOX-SOA has
not been elucidated, several molecular species that are part of IEPOX-SOA have been
identified through gas chromatography/mass spectrometry (GC/MS), liquid
chromatog-raphy/mass spectrometry (LC/MS) and particle analysis by laser mass spectrometry
(PALMS). They include 2-methyltetrols (and oligomers that contain them) (Surratt et al.,
25
ACPD
15, 11223–11276, 2015Characterization of a
real-time tracer for
IEPOX-SOA
W. W. Hu et al.
Title Page
Abstract Introduction
Conclusions References
Tables Figures
◭ ◮
◭ ◮
Back Close
Full Screen / Esc
Printer-friendly Version
Interactive Discussion
Discussion
P
a
per
|
Discussion
P
a
per
|
Discussion
P
a
per
|
Discussion
P
a
per
|
2014). These molecular species account for a variable fraction of the IEPOX-SOA
re-ported, e.g., 8 % in a chamber study (Lin et al., 2012) or 26 % in a field study at Look
Rock, TN (Budisulistiorini et al., 2015). An estimate of total IEPOX-SOA can also be
de-rived from an IEPOX-SOA molecular tracer(s) via multiplying the tracer concentration
by the total IEPOX-SOA to tracer ratio. However, that method is hindered by the limited
5
information on these molecular tracers and the reported variability of IEPOX-SOA to
tracer ratios. IEPOX-SOA may include SOA formed from other parallel isoprene
low-NO oxidation pathways (Liu et al., 2014; Krechmer et al., 2015). In addition, the
IEPOX-SOA molecular tracers are typically measured with slow time resolution (12/24 h).
Multiple field studies, supported by chamber studies, have shown that the total
10
amount of IEPOX-SOA can be obtained by factor analysis of organic spectra from an
aerosol mass spectrometer (AMS) or the aerosol chemical speciation monitor (ACSM)
(Budisulistiorini et al., 2013; Lin et al., 2012; Nguyen et al., 2014; Robinson et al., 2011).
Robinson et al. (2011) first reported an SOA factor with pronounced
f
82(
=
m/z
82
/
OA)
in the mass spectra acquired above a forest with high isoprene emissions in Borneo,
15
and hypothesized that the elevated
f
82may have arisen from methylfuran (C
5H
6O),
consistent with C
5H
6O
+being the major ion at
m/z
82 in isoprene-influenced areas.
Lin et al. (2012) demonstrated that the 3-MeTHF-3,4-diols associated with IEPOX-SOA
result in enhanced
f
82in AMS spectra, presumably through the formation
methylfuran-like structures during thermal desorption. Electron-impact ionization of aerosols formed
20
by atomizing a solution containing IEPOX (C
5H
10O
3) can also yield C
5H
6O
+signals in
an AMS via two dehydration reactions (Lin et al., 2012). However, because gas-phase
IEPOX has a high volatility, gas-to-particle partitioning of IEPOX into the organic
frac-tion of aerosol is negligible under typical ambient organic concentrafrac-tions in forest areas
(1–10 µg m
−3) (Worton et al., 2013).
25
of-ACPD
15, 11223–11276, 2015Characterization of a
real-time tracer for
IEPOX-SOA
W. W. Hu et al.
Title Page
Abstract Introduction
Conclusions References
Tables Figures
◭ ◮
◭ ◮
Back Close
Full Screen / Esc
Printer-friendly Version
Interactive Discussion
Discussion
P
a
per
|
Discussion
P
a
per
|
Discussion
P
a
per
|
Discussion
P
a
per
|
ten strongly correlated with the acidity of an aerosol, and might also play a direct role in
the chemistry, e.g. via direct reaction or nucleophilic e
ff
ects (Liao et al., 2014; Xu et al.,
2014; Surratt et al., 2007). While discussing the results of a recent aircraft campaign
from Brazil, Allan et al. (2014) also used
f
82as a tracer for IEPOX-SOA.
If
f
82in AMS spectra (and/or
f
C5H6Oin HR-AMS spectra) is dominated by
IEPOX-5
SOA,
f
82would be a convenient, high-time-resolution, and potentially quantitative tracer
for IEPOX-SOA. Thus, it will be very useful for investigating the impacts of SOA
forma-tion from isoprene with AMS/ACSM measurements, which have become increasingly
common in recent years including some continental-scale continuous networks
(Fröh-lich et al., 2015). However, no studies to date have systematically examined whether
10
enhanced
f
82is unique to IEPOX chemistry or whether it could also be enhanced in
other sources. Nor has the range of
f
82been determined for IEPOX-SOA. Questions
also have been raised about the uniqueness of this tracer and potential contributions
from monoterpene SOA (Anonymous_referee, 2014).
In this study, the IEPOX-SOA results reported in various field campaigns are
sum-15
marized and compared to predicted gas-phase IEPOX concentrations from a global
model to help confirm the robustness of the AMS identification of this type of SOA.
We then investigate the usefulness and limitations of the IEPOX-SOA tracers
f
C5H6O(
=
C
5H
6O
+/
OA) and
f
82by combining AMS data from multiple field and laboratory
studies including a new dataset from the 2013 Southern Oxidant and Aerosol Study
20
(SOAS). We compare the tracer levels in di
ff
erent OA sources (urban, biomass burning
and biogenic), characterizing the background levels and interferences on this tracer for
both high-resolution (HR) and unit mass resolution (UMR) data. We also provide a
sim-plified method to rapidly estimate IEPOX-SOA from
f
C5H6Oand
f
82. While this method is
no substitute for a detailed IEPOX-SOA identification via PMF, it is a simple method to
25
ACPD
15, 11223–11276, 2015Characterization of a
real-time tracer for
IEPOX-SOA
W. W. Hu et al.
Title Page
Abstract Introduction
Conclusions References
Tables Figures
◭ ◮
◭ ◮
Back Close
Full Screen / Esc
Printer-friendly Version
Interactive Discussion
Discussion
P
a
per
|
Discussion
P
a
per
|
Discussion
P
a
per
|
Discussion
P
a
per
|
2
Experimental
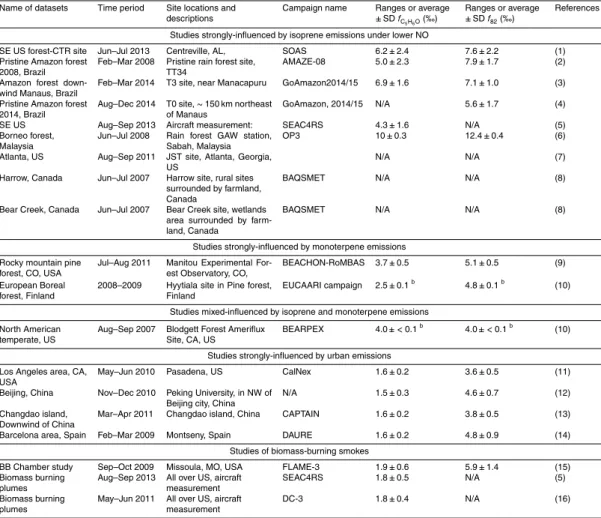
We classify the field datasets used in this study into three categories: (1) studies
strongly influenced by urban and biomass-burning emissions: Los Angeles area, US
and Beijing, China (urban); Changdao island, downwind of China and Barcelona area,
Spain (urban downwind); flight data from biomass-burning plumes and continental
ar-5
eas (NW and western, US) in SEAC4RS and DC3 campaigns; and biomass burning
lab emissions (FLAME-3 study). (2) Studies strongly influenced by isoprene emissions,
including a SE US forest site (SOAS campaign); two pristine and one polluted sites in
the Amazon rain forest (Brazil); Borneo rain forest in Malaysia; and flight data from
SE US flights from aircraft campaign (SEAC4RS), (3) studies strongly influenced by
10
monoterpene emissions in a pine forest in the Rocky Mountains and a European
bo-real forest. Locations and additional detailed information about these studies can be
found in Fig. 1 and Table 1.
With the exception of SOAS, all of the campaigns included in this analysis have been
previously described elsewhere (Table 1). The SOAS campaign took place in a forested
15
area of the SE US during June and July 2013 (Fig. 1) and has several ground sites.
The new dataset introduced below was acquired at the SEARCH supersite,
Centre-ville (CTR), AL (32.95
◦N, 87.13
◦W). Some results from a di
ff
erent SOAS site (Look
Rock, TN) are also discussed later (Budisulistiorini et al., 2015). Relatively high
av-erage isoprene and monoterpene concentrations of 3.3
±
2.4 ppb and 0.7
±
0.4 ppb,
20
respectively, were observed in SOAS-CTR by on-line GC/MS. Measurements of
non-refractory aerosol components of submicron particles (PM
1) were made using an
Aero-dyne high-resolution time-of-flight aerosol mass spectrometer (HR-ToF-AMS, “AMS”
hereafter) (DeCarlo et al., 2006). By applying positive matrix factorization (PMF) to the
time series of organic mass spectra (Ulbrich et al., 2009), we separated contributions
25
ACPD
15, 11223–11276, 2015Characterization of a
real-time tracer for
IEPOX-SOA
W. W. Hu et al.
Title Page
Abstract Introduction
Conclusions References
Tables Figures
◭ ◮
◭ ◮
Back Close
Full Screen / Esc
Printer-friendly Version
Interactive Discussion
Discussion
P
a
per
|
Discussion
P
a
per
|
Discussion
P
a
per
|
Discussion
P
a
per
|
in 2013 were modeled at as resolution of 2
◦×
2.5
◦as described in Nguyen et al. (2015).
The gas-phase chemistry of isoprene in GEOS-Chem is based on Paulot et al. (2009a,
b) as described by Mao et al. (2013).
3
Results and discussion
3.1
IEPOX-SOA in a SE US forest during SOAS, 2013
5
We use the SOAS-CTR field study (SE US-CTR) as an example for the determination
of IEPOX-SOA from AMS data via PMF analysis. The time series and mass spectrum of
this component are shown in Fig. 2. A strong correlation is found between AMS
IEPOX-SOA and 2-methyltetrols (
R
=
0.79) and sulfate (
R
=
0.75) as expected (Xu et al., 2014;
Nguyen et al., 2014; Lin et al., 2012; Surratt et al., 2010). The diurnal variation of
10
IEPOX-SOA is also similar to gas-phase IEPOX and isoprene measured in SOAS-CTR.
2-Methyltetrols, measured on-line by GC-EI/MS with the SV-TAG instrument (Isaacman
et al., 2014), comprise 26 % of IEPOX-SOA in SOAS-CTR on average, as shown in
Fig. 2b. A similar ratio (29 %) is found between 2-Methyltetrols measured by o
ffl
ine
anal-ysis of filter samples using GC-EI/MS and LC/MS (Lin et al., 2014) and IEPOX-SOA.
15
Other IEPOX-SOA tracers, such as C
5-alkene triols, IEPOX-organosulfates, and dimers
containing them, can also be measured by o
ffl
ine GC-EI/MS and LC/MS
(Budisulistior-ini et al., 2015; Lin et al., 2014). The total IEPOX-SOA tracers measured in SOAS
account for
∼
78 % of the total IEPOX-SOA mass concentration. This is a remarkably
high value compared to the tracer to total SOA ratios for other SOA systems (e.g., SOA
20
from monoterpenes or aromatic hydrocarbons) (Lewandowski et al., 2013) and it is the
highest reported in the literature to our knowledge. A total tracers to IEPOX-SOA ratio
of 26 % was reported for the Look Rock site in SOAS (SOAS-LR) (Budisulistiorini et al.,
2015). Thus, the measured total molecular tracer fraction in total IEPOX-SOA appears
to be quite variable (a factor of 3) even if the same or similar techniques are used.
25
ACPD
15, 11223–11276, 2015Characterization of a
real-time tracer for
IEPOX-SOA
W. W. Hu et al.
Title Page
Abstract Introduction
Conclusions References
Tables Figures
◭ ◮
◭ ◮
Back Close
Full Screen / Esc
Printer-friendly Version
Interactive Discussion
Discussion
P
a
per
|
Discussion
P
a
per
|
Discussion
P
a
per
|
Discussion
P
a
per
|
uncertainties, this value likely changes significantly between di
ff
erent times and
loca-tions, potentially due to changes in particle-phase reaction conditions such as sulfate
and water concentrations, acidity, and the identity and concentrations of
oligomeriza-tion partners.
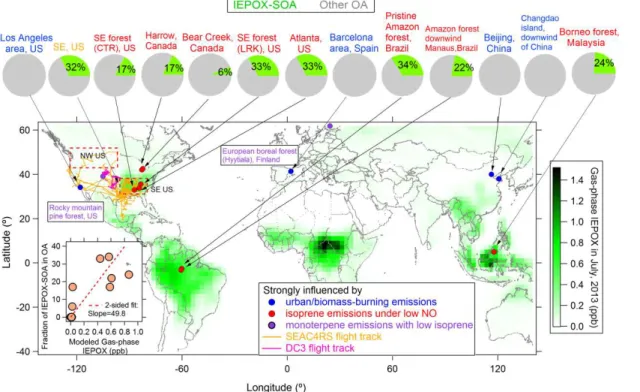
IEPOX-SOA accounts for 17 % of the total OA mass concentration at SOAS-CTR.
5
This is shown in Fig. 1 along with the IEPOX-SOA fraction from several previous
stud-ies (Robinson et al., 2011; Chen et al., 2014; Budisulistiorini et al., 2013; Slowik et al.,
2011; Hu et al., 2013, 2015; Hayes et al., 2013). Figure 1 also shows the surface
gas-phase IEPOX concentrations for July 2013 as simulated with GEOS-Chem. At all sites
with at least
∼
30 ppt predicted average IEPOX concentration, IEPOX-SOA is identified
10
in AMS data. IEPOX-SOA accounts for 6–34 % of total OA in those studies, signifying
the importance of IEPOX-SOA for regional and global OA budgets. No IEPOX-SOA
factor (or below the PMF detection limit of
∼
5 %. Ulbrich et al., 2009) was found in
areas strongly influenced by urban emissions where high NO concentrations suppress
the IEPOX pathway (e.g. Hayes et al., 2013). GEOS-Chem indeed predicts negligible
15
modeled gas-phase IEPOX concentrations in those areas, where isoprene peroxy
rad-icals are expected to react primarily with NO. Some IEPOX can also be formed via high
NO chemistry (Jacobs et al., 2014), however this pathway is thought to be much smaller
than the low-NO pathway, consistent with the lack of observation of IEPOX-SOA in the
polluted studies included here. The fraction of IEPOX-SOA positively correlates with
20
modeled gas-phase IEPOX, as shown in the inset of Fig. 1.
The mass spectrum of IEPOX-SOA during SOAS-CTR is similar to those from other
studies as seen in Figs. S1 and S2 (Robinson et al., 2011; Lin et al., 2012; Nguyen
et al., 2014; Chen et al., 2014; Budisulistiorini et al., 2013; Xu et al., 2014), and also
exhibits a prominent C
5H
6O
+
peak at
m/z
82. We investigated the correlation between
25
the time series of IEPOX-SOA and each ion in the OA spectra. The temporal
vari-ation of ion C
5H
6O
+
ACPD
15, 11223–11276, 2015Characterization of a
real-time tracer for
IEPOX-SOA
W. W. Hu et al.
Title Page
Abstract Introduction
Conclusions References
Tables Figures
◭ ◮
◭ ◮
Back Close
Full Screen / Esc
Printer-friendly Version
Interactive Discussion
Discussion
P
a
per
|
Discussion
P
a
per
|
Discussion
P
a
per
|
Discussion
P
a
per
|
also correlate well with IEPOX-SOA in SOAS-CTR and could be potential tracers for
IEPOX-SOA. Scatter plots between these four ions and C
5H
6O
+
at di
ff
erent campaigns
indicates they either have higher background values or lower signal-to-noise compared
to C
5H
6O
+(Fig. S3).
f
C5H6Oin IEPOX-SOA from SOAS and other field and laboratory
studies (Table 1) ranges from 12 to 40 ‰ and have an average value of 22
±
7 ‰. Note
5
that C
5H
6O
+ion can account for over 95 % of
m/z
82 in IEPOX-SOA from
SOAS-CTR and other lab studies (Kuwata et al., 2015), hence the average
f
C5H6O
values in
IEPOX-SOA shown here also includes
f
82in UMR IEPOX-SOA spectra. These values
are substantially higher than those from other types of OA or from locations with little
impact from IEPOX-SOA, as discussed below.
10
3.2
f
C5H6Oin areas with strong influence from urban and biomass burning
emissions
We next examine whether POA or SOA from field studies in areas strongly influenced
by urban and biomass-burning emissions and without substantial predicted gas-phase
IEPOX concentrations or IEPOX-SOA contributions can lead to enhanced
f
C5H6O.
Fig-15
ure 3a shows the distribution of
f
C5H6Oin this category of studies peaks at 1.7
±
0.1 ‰
(range 0.02–3.5 ‰). Data from continental air masses sampled from aircraft over the
western and northwest US (where isoprene emissions are low) are shown in Fig. 3b
and show a similar range as the polluted ground sites.
Biomass burning emissions and plumes sampled over multiple studies show a similar
20
range to the pollution studies, with some slightly higher values. The peak of the
distri-bution of
f
C5H6Ofrom fresh biomass-burning smoke across many di
ff
erent biomasses
during the FLAME-3 study is 2.0 ‰. During the SEAC4RS aircraft campaign, many
biomass burning plumes were sampled, where OA concentrations varied over a wide
range (several tens to more than one thousand µg m
−3). The average
f
C5H6Oacross
25
these biomass-burning plumes was 1.75 ‰ with low variability (
∼
20 %), see Fig. S4.
We also explore whether other anthropogenic POA emission sources could elevate
ACPD
15, 11223–11276, 2015Characterization of a
real-time tracer for
IEPOX-SOA
W. W. Hu et al.
Title Page
Abstract Introduction
Conclusions References
Tables Figures
◭ ◮
◭ ◮
Back Close
Full Screen / Esc
Printer-friendly Version
Interactive Discussion
Discussion
P
a
per
|
Discussion
P
a
per
|
Discussion
P
a
per
|
Discussion
P
a
per
|
POA spectra from vehicle exhaust, cooking, coal combustion, and multiple pure
chemi-cal standards (e.g., some alcohols; di- or poly acids) (Canagaratna et al., 2015). Almost
all the values are below 2 ‰, with exceptions for one type of cooking POA at 3 ‰, the
polyol xylitol (4.2 ‰), and some acids (
>
4.8 ‰, as shown in Fig. 3d). All the tracers
resulting in elevated
f
C5H6Ocontain multiple hydroxyl groups, and may result in
furan-5
like structures via facile dehydration reactions (Canagaratna et al., 2015). Xylitol has
been proposed as a tracer of toluene SOA (Hu et al., 2008). It has a similar
struc-ture to 2-methyltetrols, with 5–OH groups instead of 4. In the AMS, xylitol may form
the methylfuran structure through dehydration reactions like 2-methytetrols. However,
f
C5H6O
in other toluene SOA tracers in our dataset show background levels of
f
C5H6O10
(
<
2 ‰). Given the small fraction of xylitol in toluene SOA (Hu et al., 2008), xylitol is
unlikely to increase
f
C5H6Oin anthropogenic SOA, consistent with our results.
In summary, in the absence of strong impacts from biogenic SOA, the AMS high
resolution ion C
5H
6O
+has a clear and stable background, spanning a small range
(0.02–3.5 ‰) with an peak around 1.7
±
0.1 ‰, about an order of magnitude lower than
15
the average value (22
±
7 ‰) for IEPOX-SOA.
3.3
Enhancements of
f
C5H6Oin areas strongly influenced by isoprene
emissions
GEOS-Chem predicts much higher surface gas-phase IEPOX concentrations over the
SE US and Amazon rainforest than those in temperate urban areas (Fig. 1). This is
ex-20
pected from high isoprene concentrations (e.g. 3.3 ppb in SOAS-CTR and 4 ppb in the
Amazon) under low average NO concentrations (
∼
0.1 ppb) (Karl et al., 2009; Ebben
et al., 2011). Probability distributions of
f
C5H6Oduring both campaigns are shown in
Fig. 4a, and are very similar with averages of 5–6 ‰ (range 2.5–11 ‰). The Amazon
forest downwind of Manaus and a Borneo tropical forest study show even higher
aver-25
conti-ACPD
15, 11223–11276, 2015Characterization of a
real-time tracer for
IEPOX-SOA
W. W. Hu et al.
Title Page
Abstract Introduction
Conclusions References
Tables Figures
◭ ◮
◭ ◮
Back Close
Full Screen / Esc
Printer-friendly Version
Interactive Discussion
Discussion
P
a
per
|
Discussion
P
a
per
|
Discussion
P
a
per
|
Discussion
P
a
per
|
nental air masses (1.7
±
0.3 ‰) where isoprene emissions are much smaller (Guenther
et al., 2012). Thus, campaigns in locations strongly influenced by isoprene emissions
under lower NO conditions show systematically higher
f
C5H6Ovalues (with an average
peak of 6.5
±
2.2 ‰) than background levels found in other locations (1.7 ‰). The fact
that
f
C5H6Oof total ambient OA (6.5
±
2.2 ‰) in these studies is lower than the values in
5
IEPOX-SOA (22
±
7 ‰) is expected, since ambient datasets also include OA from other
sources, and confirms that IEPOX-SOA is not an overwhelmingly dominant OA source
at most of those locations (see Fig. S5).
3.4
Values of
f
C5H6Oin laboratory studies of non IEPOX-derived isoprene SOA
We also investigate
f
C5H6Oin laboratory SOA from isoprene in Fig. 4a. For SOA
pro-10
duced by chamber isoprene photooxidation under high NO
xconditions, low
f
C5H6O(
<
2 ‰) within the background level is observed (Chen et al., 2011; Kroll et al., 2006).
SOA from oxidation of isoprene hydroxyhydroperoxide (ISOPOOH, a product of
low-NO oxidation of isoprene) under low-low-NO conditions, when formed under conditions are
not favorable for the reactive uptake of IEPOX into aerosols also has low
f
C5H6Oof 2 ‰
15
(Krechmer et al., 2015). Low values of
f
C5H6O(
<
3 ‰) are also observed in SOA from
isoprene
+
NO
3
radical reactions without acid seeds (Ng et al., 2008). The low
f
C5H6O(
<
3 ‰) observed in non IEPOX-derived isoprene SOA indicate that
f
C5H6Ois
specifi-cally enhanced from IEPOX-SOA, and is not a tracer for all SOA from isoprene.
3.5
Enhancements of
f
C5H6Oin areas strongly influenced by monoterpene
20
emissions
The BEACHON-RoMBAS campaign was carried out in a Rocky Mountain pine
for-est with high monoterpene emissions that account for 34 % in daytime and 66 % at
night of the total VOC mixing ratios (on average peaking at 0.15 ppb during day and
0.7 ppb at night) (Fry et al., 2013) but lower isoprene emissions (peaking at 0.35 ppb
25
ACPD
15, 11223–11276, 2015Characterization of a
real-time tracer for
IEPOX-SOA
W. W. Hu et al.
Title Page
Abstract Introduction
Conclusions References
Tables Figures
◭ ◮
◭ ◮
Back Close
Full Screen / Esc
Printer-friendly Version
Interactive Discussion
Discussion
P
a
per
|
Discussion
P
a
per
|
Discussion
P
a
per
|
Discussion
P
a
per
|
react via the low-NO route (i.e. via RO
2+
HO
2
) at this site (Fry et al., 2013). The
isoprene
/
monoterpene ratio at the Rocky Mountain site is 0.48, and is
∼
10–20 times
lower than this ratio (4.7) in SOAS-CTR and (8.3) in Amazon studies (Chen et al.,
2014), suggesting that
f
C5H6Omay be near background levels because of the very low
potential contribution of IEPOX-SOA at the Rocky Mountain site. However, the average
5
f
C5H6Oat the Rocky Mountain site is 3.7
±
0.5 ‰ (Fig. 4a), which although lower than
the average
f
C5H6O
(6.5 ‰) found in the SE US-CTR, Amazon and Borneo forests, it
is still twice the background
f
C5H6Ovalues of 1.7 ‰ observed in pollution and
smoke-dominated locations.
Three circumstances may lead to such an enhanced
f
C5H6O
at the Rocky Mountain
10
site, which we examine here. (1) A small amount of IEPOX-SOA may be formed from
the limited isoprene present at the Rocky Mountain site and surrounding region.
How-ever, the average isoprene concentration in this pine forest area is only 0.2 ppb, which
is around 16 times less than that (3.3 ppb) at the SE US site in SOAS. The
condi-tions at the Rocky Mountain site were less favorable for IEPOX-SOA formation due to
15
a higher fraction (70 % in daytime) of the RO
2radicals reacting with NO and less acidic
aerosols (Levin et al., 2014; Fry et al., 2013). Thus we can estimate an upper limit
con-tribution of IEPOX-SOA to the
f
C5H6Otracer at the Rocky Mountain site assuming the
same ratio of IEPOX-SOA to isoprene in both campaigns. In this case, we would
ex-pect
f
C5H6Oat the Rocky Mountain site to be the background level (1.7 ‰) plus 1
/
16th
20
of the enhancement above the background observed in SOAS (5 ‰
−
1.7 ‰
=
3.3 ‰)
multiplied by the ratio of OA concentrations at both sites (4.8 µg m
−3in SE US site vs.
1.8 µg m
−3in Rocky Mountain site). This calculation results in an expected upper limit
f
C5H6O∼
2.25 ‰ at the Rocky Mountain site due to the IEPOX-SOA contribution. This
estimate is much lower than the observed average 3.7 ‰. Thus the elevated
f
C5H6Oin
25
Rocky Mountain pine forest is very unlikely to be due to IEPOX-SOA.
ACPD
15, 11223–11276, 2015Characterization of a
real-time tracer for
IEPOX-SOA
W. W. Hu et al.
Title Page
Abstract Introduction
Conclusions References
Tables Figures
◭ ◮
◭ ◮
Back Close
Full Screen / Esc
Printer-friendly Version
Interactive Discussion
Discussion
P
a
per
|
Discussion
P
a
per
|
Discussion
P
a
per
|
Discussion
P
a
per
|
ozonolysis (Chhabra et al., 2011; Chen et al., 2014) or photooxidation (Ng et al., 2007)
of
α
-pinene, or NO
3reaction with
α
-pinene,
β
-pinene and
∆
3
-Carene (Fry et al., 2014;
Boyd et al., 2015) can result in higher
f
C5H6O(average 5.5
±
2.0 ‰) than background
levels of
∼
1.7 ‰ (Fig. 4a). We note that the average MT-SOA value is still 4 times lower
than the average for IEPOX-SOA, and thus they leave some room to separate both
con-5
tributions. Oxidation of monoterpenes can lead to species with multiple –OH groups,
which may result in the production of methylfuran (or ions of similar structure) upon
AMS analysis. We do not observe enhanced
f
C5H6Oin SOA from sesquiterpene
oxida-tion (
<
2 ‰) (Chen et al., 2014). The values of
f
C5H6Oin chamber SOA from
monoter-penes, together with the finding of a substantial contribution of monoterpenes to SOA
10
at this Rocky Mountain site (Fry et al., 2013) suggest that MT-SOA may explain the
values of
f
C5H6Oobserved there.
Two other field studies support the conclusion that ambient MT-SOA may have
slightly enhanced
f
C5H6O. Figure 6 shows data from a DC3 aircraft flight in the
ar-eas around Missouri and Illinois. Ambient
f
C5H6Oincreases from background levels
15
(
∼
1.7 ‰) to
∼
4.1 ‰ in a highly correlated manner to monoterpene concentration
in-creases. Meanwhile, isoprene and gas-phase IEPOX stay at low levels similar to the
rest of the flight, indicating that enhanced
f
C5H6Oin the periods with higher MT
concen-trations should arise from MT-SOA and not IEPOX-SOA. Figure 4a includes AMS
mea-surements at a MT-emission dominated European boreal forest (Hyytiälä in Finland)
20
(Robinson et al., 2011). Average
f
C5H6Ois
∼
2.5 ‰ at this site, which is again higher
than the background
f
C5H6Ovalue of 1.7 ‰. The slightly lower
f
C5H6Oin the Boreal
for-est vs. the Rocky Mountain site may be partially explained by a small contribution from
IEPOX-SOA at the latter (estimated above to increase
f
C5H6Oup to 2.25 ‰ at the Rocky
Mountain site), as well as by di
ff
erences of the MT-SOA
/
OA ratio at both sites (Corrigan
25
et al., 2013) and the relative importance of di
ff
erent MT oxidation pathways.
ACPD
15, 11223–11276, 2015Characterization of a
real-time tracer for
IEPOX-SOA
W. W. Hu et al.
Title Page
Abstract Introduction
Conclusions References
Tables Figures
◭ ◮
◭ ◮
Back Close
Full Screen / Esc
Printer-friendly Version
Interactive Discussion
Discussion
P
a
per
|
Discussion
P
a
per
|
Discussion
P
a
per
|
Discussion
P
a
per
|
the day (Karl et al., 2014). MBO has been shown to form aerosol with a 2–7 % yield in
chamber studies, which is thought to proceed via the uptake of epoxide intermediates
(C
5H
10O
2vs. IEPOX C
5H
10O
3) under acidic aerosol conditions (Zhang et al., 2014;
Mael et al., 2014; Zhang et al., 2012). Some aerosol species formed by MBO-derived
epoxides have similar structures (e.g., C
5H
12O
3) to the IEPOX oxidation products in
5
SOA and thus they might contribute to
f
C5H6O. No pure MBO-derived epoxides or their
oxidation products in the aerosol phase have been measured by AMS so far, to our
knowledge.
To attempt to di
ff
erentiate whether MT-SOA or MBO-SOA dominate the higher
f
C5H6O
at the Rocky Mountain site, average diurnal variations of ambient
f
C5H6O
,
monoter-10
pene and isoprene
+
MBO are plotted in Fig. S6.
f
C5H6O
shows a diurnal pattern that
increases at night and peaks in the early morning, similar to the diurnal variation of
monoterpenes. Monoterpenes continue to be oxidized during nighttime at this site by
NO
3radical and O
3with a lifetime of
∼
30 min (with 5 ppt of NO
3and 30 ppb of O
3) (Fry
et al., 2013). In contrast only a decrease and later a plateau of
f
C5H6Oare observed
15
during the period with high MBO concentration and higher oxidation rate of MBO due
to high OH radical in daytime (as MBO reacts slowly with O
3and NO
3) (Atkinson and
Arey, 2003). While MBO-SOA may or may not have
f
C5H6Oabove background levels,
the diurnal variations point to MT-SOA playing a dominant role in
f
C5H6Oat this site.
3.6
f
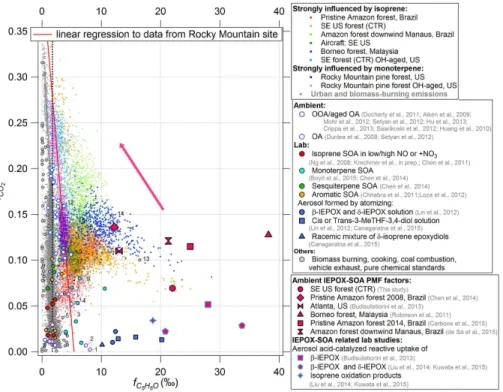
C5H6Ovs. OA oxidation level (
f
CO2) “triangle plot” – background studies
20
In AMS spectra, the CO
+2ion is a marker of aging and oxidation processes (Ng et al.,
2011a; Alfarra et al., 2004). To evaluate whether oxidation plays a role on the
ob-served
f
C5H6Ofor di
ff
erent types of OA, in this section we use plots of
f
CO2(
=
CO
+ 2
/
OA)
vs.
f
C5H6Oas a graphical diagnostic of this process, similar to graphical diagnostics
(“triangle plots”) used for other purposes with AMS data (Ng et al., 2011a; Cubison
25
ACPD
15, 11223–11276, 2015Characterization of a
real-time tracer for
IEPOX-SOA
W. W. Hu et al.
Title Page
Abstract Introduction
Conclusions References
Tables Figures
◭ ◮
◭ ◮
Back Close
Full Screen / Esc
Printer-friendly Version
Interactive Discussion
Discussion
P
a
per
|
Discussion
P
a
per
|
Discussion
P
a
per
|
Discussion
P
a
per
|
a variable oxidation level of POA and SOA (oxidation e
ff
ect) in the di
ff
erent studies.
In fact, to our knowledge, these studies encompass the values of
f
CO2observed in all
ambient AMS studies to date (Ng et al., 2011a). Several studies when urban and forest
air, or biomass burning smoke were aged by intense OH oxidation with an oxidation
flow reactor (OFR) (Kang et al., 2007; Ortega et al., 2013; Li et al., 2013) are also
5
included. However, despite the wide range of
f
CO2,
f
C5H6Ochanges little, staying in the
range 0.02–3.5 ‰, and with little apparent dependence on
f
CO2
for the ambient
stud-ies. A linear regression to quantiles from this dataset results in an intercept of 1.7 ‰
and a very weak decrease with increasing
f
CO2. A stronger decrease is observed when
aging urban air (Los Angeles) by intense OH exposure in flow reactor, as shown in
10
Fig. 3d.
Ambient
f
CO2at the Rocky Mountain forest site shows a moderate oxidation level
(0.1–0.15), similar to the SE US-CTR (Fig. 5).
f
C5H6Oin the Rocky mountain site
de-creases linearly when
f
CO2increases. During the Rocky Mountain study, the intense
OH aging of ambient air in a flow reactor shows a continuation of the trend observed
15
for the ambient data, where
f
C5H6Odecreases as
f
CO2increases. A linear regression
to the combined ambient and OFR datasets (
f
C5H6O=
−
0.013
×
f
CO2+
0.0054) will be
used below to estimate background
f
C5H6Oin areas with strong monoterpene and low
isoprene emissions.
f
C5H6Oin ambient SOA from other studies catalogued in the HR-AMS spectral
20
database are also shown in Fig. 5. Most urban oxygenated OA (OOA) are within
back-ground
f
C5H6O(average 1.7 ‰; range: 0.02–3.5 ‰), which is consistent with the
f
C5H6O(
<
3 ‰) in lab aromatic SOA and other urban OA in Fig. 5. However, some ambient
SOA spectra do show higher
f
C5H6O(3–10 ‰) than the background
f
C5H6O(0.02–3.5 ‰),
which we will discuss in the next section.
25
3.7
f
C5H6Ovs. OA oxidation level (
f
CO2) – IEPOX-SOA influenced studies
ACPD
15, 11223–11276, 2015Characterization of a
real-time tracer for
IEPOX-SOA
W. W. Hu et al.
Title Page
Abstract Introduction
Conclusions References
Tables Figures
◭ ◮
◭ ◮
Back Close
Full Screen / Esc
Printer-friendly Version
Interactive Discussion
Discussion
P
a
per
|
Discussion
P
a
per
|
Discussion
P
a
per
|
Discussion
P
a
per
|
distinctively enhanced
f
C5H6Owhen compared to background
f
C5H6Opoints of similarly
moderate or higher oxidation levels. The
f
C5H6Omeasurements with lower
f
CO2values
are more broadly distributed than the
f
C5H6Opoints with higher
f
CO2values in SE
US-CTR, SEAC4RS, Borneo forest and Amazon forest down Manaus campaigns.
How-ever, increased
f
C5H6Owith higher
f
CO2was observed in the Amazon. Both oxidation
5
and mixing of airmasses with di
ff
erent OA can influence these observations.
f
C5H6O
in IEPOX-SOA usually will decrease with oxidative aging. E.g.,
f
C5H6O
from the SOAS
oxidation flow reactor decreases continuously as OA becomes more oxidized than
am-bient OA in SOAS-CTR (
f
CO2increases from 0.15 to 0.3). Airmass mixing e
ff
ects are
more complex. Depending on the
f
CO2
of OA in the airmasses mixed with,
f
C5H6Oin
10
IEPOX-SOA-rich air can show positive, neutral or negative trends with increasing
f
CO2.
E.g., in pristine Amazon forest, points with lower
f
CO2(
<
0.08) have low
f
C5H6Oare
thought to be mainly caused by advection of POA from occasional local pollution.
The overall trend for the ambient measurements in studies strongly influenced by
isoprene emissions (Fig. 5) is that those points cluster in a triangle shape and
f
C5H6O15
decreases as
f
CO2increases. This “triangle shape” indicates that in most of campaigns
of this study shows the local OA with IEPOX-SOA contributions is influenced by the
ambient oxidation processes or mixing with more aged aerosols.
Finally, points with higher
f
C5H6Oin OA or OOA/aged OA are labeled with numbers
in Fig. 5. The sources of those labeled points are summarized in Table S2. OA from
20
those studies are all partially influenced by biogenic emissions. For example, during
measurements of ambient OA in the Central Valley of California (number 2), high
iso-prene emissions and acidic particles were observed (Dunlea et al., 2009), suggesting
that potential IEPOX-SOA formed in this area may explain the higher
f
C5H6Oin ambient
OA there.
25
3.8
Best estimate of
f
C5H6Oin IEPOX-SOA
systemati-ACPD
15, 11223–11276, 2015Characterization of a
real-time tracer for
IEPOX-SOA
W. W. Hu et al.
Title Page
Abstract Introduction
Conclusions References
Tables Figures
◭ ◮
◭ ◮
Back Close
Full Screen / Esc
Printer-friendly Version
Interactive Discussion
Discussion
P
a
per
|
Discussion
P
a
per
|
Discussion
P
a
per
|
Discussion
P
a
per
|
cally lower
f
CO2than ambient studies. This is likely explained by the lack of additional
aging in the laboratory studies, because all the lab IEPOX-SOA were measured directly
after uptake gas-phase IEPOX onto acidic aerosol without undergoing substantial
ad-ditional oxidation.
A wide range (12–40 ‰) of
f
C5H6Ois observed with an average of 22
±
7 ‰ in
am-5
bient and lab IEPOX-SOA.
f
C5H6Oin IEPOX-SOA did not show a trend vs.
f
CO2in
IEPOX-SOA. The IEPOX-SOA molecular tracer 3-MeTHF-3,4-diols has been shown
to enhance the
f
C5H6Oin OA (Fig. 5) (Lin et al., 2012; Canagaratna et al., 2015).
Ex-cept 3-MeTHF-3,4-diols, none of the other pure IEPOX-derived polyols standards have
been atomized and injected into the AMS system so far, to our knowledge. We suspect
10
other polyols such as 2-methyltetrols may also lead to such an enhancement through
dehydration reactions in the AMS vaporizer leading to methylfuran-type structures. The
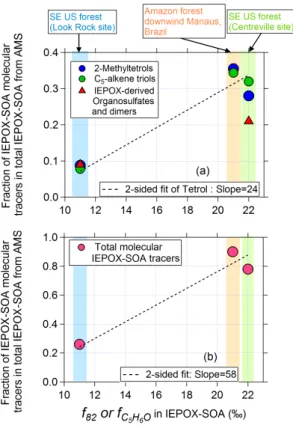
diversity of
f
C5H6Oin IEPOX-SOA in di
ff
erent studies is related with the variable content
of specific IEPOX-SOA molecular species that enhance
f
C5H6Odi
ff
erently. The fractions
of molecular IEPOX-SOA species in total IEPOX-SOA is plotted vs.
f
C5H6Oin
IEPOX-15
SOA in four di
ff
erent studies in Fig. 7. A strong correlation is observed between the
fraction of IEPOX-derived 2-methyltetrols and
f
C5H6Oin IEPOX-SOA. A similar trend
is observed between IEPOX-derived C
5-alkene triols and
f
C5H6Oin IEPOX-SOA, and
also with total IEPOX-SOA tracers. The strong simultaneous variation of both
quanti-ties indicates that the diversity of
f
C5H6Oin IEPOX-SOA is very likely explained by the
20
variability of the molecules comprising IEPOX-SOA among di
ff
erent studies.
During one day in SOAS (26 June 2013), IEPOX-SOA comprised 80–90 % of total
OA (Fig. S7), possibly due to high sulfate concentrations favoring IEPOX-SOA
forma-tion.
f
C5H6Oreached 25 ‰, which is similar to the 22 ‰ for the PMF-resolved
IEPOX-SOA from this study, and consistent with a slightly lower value for the average vs.
fresh-25
ACPD
15, 11223–11276, 2015Characterization of a
real-time tracer for
IEPOX-SOA
W. W. Hu et al.
Title Page
Abstract Introduction
Conclusions References
Tables Figures
◭ ◮
◭ ◮
Back Close
Full Screen / Esc
Printer-friendly Version
Interactive Discussion
Discussion
P
a
per
|
Discussion
P
a
per
|
Discussion
P
a
per
|
Discussion
P
a
per
|
Hence, we propose an average
f
C5H6O(21 ‰) from both studies as the typical value of
fresh IEPOX-SOA.
3.9
Proposed method for real-time estimation of IEPOX-SOA
So far, PMF of AMS spectra is the only demonstrated method for quantifying total
IEPOX-SOA concentrations. However, the PMF method is labor-intensive and requires
5
significant expertise, and may fail to resolve a certain factor when present in lower
mass fractions (
<
5 %). A simpler, real-time method to estimate IEPOX-SOA would be
useful in many studies, including during ground-based and aircraft campaigns.
We propose an estimation method for IEPOX-SOA based on the mass concentration
of its tracer ion C
5H
6O
+
. To do this, we express the mass concentration of C
5H
6O
+as
10
C
5H
6O
+total
=
C
5H
6O
+IEPOX-SOA, ambient
+
C
5H
6O
+background
.
(1)
Where, C
5H
6O
+total
is measured total C
5H
6O
+signal in AMS; C
5H
6O
IEPOX-SOA, ambientand C
5H
6O
+
background
are the C
5H
6O
+signals contributed by IEPOX-SOA in ambient
OA and other background OA (non IEPOX-SOA). Note that in the AMS, the “mass
concentration” of an ion is used to represent the mass of the species whose detection
15
resulted in the observed ion current of that ion, based on the properties of electron
ionization (Jimenez et al., 2003).
Then, C
5H
6O
IEPOX-SOA, ambientand C
5H
6O
+background
can be calculated as:
C
5H
6O
+IEPOX-SOA, ambient=
IEPOX-SOA
×
f
C5H6OIEPOX-SOA
.
(2)
C
5H
6O
+background=
(OA
mass
−
IEPOX-SOA)
×
f
C5H6Obackground.
(3)
20
Where,
f
C5H6OIEPOX-SOAis the fractional contribution of C
5H
6O
+ACPD
15, 11223–11276, 2015Characterization of a
real-time tracer for
IEPOX-SOA
W. W. Hu et al.
Title Page
Abstract Introduction
Conclusions References
Tables Figures
◭ ◮
◭ ◮
Back Close
Full Screen / Esc
Printer-friendly Version
Interactive Discussion
Discussion
P
a
per
|
Discussion
P
a
per
|
Discussion
P
a
per
|
Discussion
P
a
per
|
Then, by combining Eqs. (1)–(3), we can express C
5H
6O
+ totalas:
C
5H
6O
+total
=
IEPOX-SOA
×
f
C5H6OIEPOX-SOA+
(OA
−
IEPOX-SOA)
×
f
C5H6Obackground.
(4)
Finally, IEPOX-SOA can be estimated as:
IEPOX-SOA
=
C
5H
6O
+total
−
OA
×
f
C5H6Obackgroundf
C5H6OIEPOX-SOA−
f
C5H6Obackground.
(5)
In Eq. (5), C
5H
6O
+total
and OA mass are measured directly by AMS.
f
C5H6Obackgroundand
5
f
C5H6OIEPOX-SOAare two parameters that must be determined by other means.
As discussed above, the background value in the absence of a substantial impact of
MT-SOA is
∼
1.7 ‰. In studies influenced by monoterpene emissions, the background
value may be elevated by MT-SOA.
f
C5H6Oat the Rocky Mountain site estimated by
f
C5H6O=
(0.41
−
f
CO2)
×
0.013 (Fig. 5) will be used as
f
C5H6Obackgroundfor areas with strong
10
MT-SOA contributions. There is some uncertainty in this value, due to possible
contri-butions of a small amount of IEPOX-SOA, MBO-SOA, and other OA sources at this site.
An alternative estimate as
f
C5H6Obackgroundfrom area with strong monoterpene emissions
would be
∼
1.7 ‰
+
3
×
MT
avg(ppb), which is also approximately consistent with our
am-bient data, but may have higher uncertainty. Further characterization of the background
15
f
C5H6Oin areas with MT-SOA impact is of interest for future studies. As discussed above,
we use average
f
C5H6OIEPOX-SOA=
22 ‰ in Eq. (3) as a representative value of ambient
IEPOX-SOA.
3.10
Application of the real-time estimation method of IEPOX-SOA
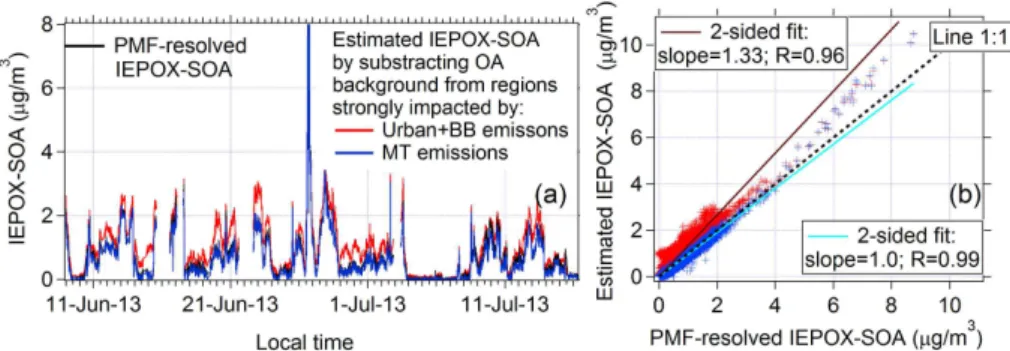
To test the proposed estimation method, we use SE US forest (SOAS) data as an
20
ACPD
15, 11223–11276, 2015Characterization of a
real-time tracer for
IEPOX-SOA
W. W. Hu et al.
Title Page
Abstract Introduction
Conclusions References
Tables Figures
◭ ◮
◭ ◮
Back Close
Full Screen / Esc
Printer-friendly Version
Interactive Discussion
Discussion
P
a
per
|
Discussion
P
a
per
|
Discussion
P
a
per
|
Discussion
P
a
per
|
accurate. The IEPOX-SOA estimated by subtracting the MT-SOA background
(IEPOX-SOA
MT) is indeed better correlated with PMF-resolved IEPOX-SOA (
R
=
0.99) than
that (
R
=
0.96) when the urban and biomass-burning background is applied
(IEPOX-SOA
urb&bb). The intercept of regression line between IEPOX-SOA
MTand PMF-resolved
IEPOX-SOA is zero, indicating the background of IEPOX-SOA contributed by MT-SOA
5
is clearly deducted.
The regression slope between IEPOX-SOA
MTand IEPOX-SOA
PMFis 0.95,
suggest-ing that C
5H
6O
+
in SE US CTR site (SOAS) may be slightly overcorrected by
minimiz-ing C
5H
6O
+
from monoterpene emissions. This underestimation may be associated
with higher MT-SOA contribution to C
5H
6O
+in Rocky Mountain pine forest site than
10
SE US forest site, or interference from IEPOX-SOA/MBO-SOA at the Rocky Mountain
site. IEPOX-SOA
urb&bbis 1.26 times higher than PMF-resolved IEPOX-SOA. Thus, as
expected IEPOX-SOA
MTand IEPOX-SOA
urb&bbprovide lower and upper limits of
esti-mated IEPOX-SOA.
Among all the datasets introduced in this study, the SOAS-CTR dataset should be
15
the best case scenario since
f
C5H6OIEPOX-SOA=
22 ‰ is coincidently the same value in the
spectrum of PMF-resolved IEPOX-SOA in SOAS-CTR and a large fraction (17 %) of
IEPOX-SOA existed in SOAS-CTR as well. Given the spread of values of
f
C5H6OIEPOX-SOA(12–40 ‰) in di
ff
erent studies, if no additional local IEPOX-SOA spectrum is available
for a given site, the estimation from this method should be within a factor of
∼
2 of the
20
actual concentration. Further information concerning the estimation method using unit
mass resolution
m/z
82 (or
f
82) can be found in the Appendix.
4
Conclusions
To investigate if the ion C
5H
6O
+(at
m/z
82) in AMS spectra is a good tracer for
IEPOX-SOA, tens of field and lab studies are combined and compared, including the SOAS
25