Predictive Power of a Body Shape Index for
Development of Diabetes, Hypertension, and
Dyslipidemia in Japanese Adults: A
Retrospective Cohort Study
Misuzu Fujita1*, Yasunori Sato2, Kengo Nagashima2, Sho Takahashi2, Akira Hata1
1Chiba University, Department of Public Health, Chiba City, Chiba, Japan,2Chiba University, Hospital Clinical Research Center, Chiba City, Chiba, Japan
*fujitam@chiba-u.jp
Abstract
Background/Objectives
Recently, a body shape index (ABSI) was reported to predict all-cause mortality indepen-dently of body mass index (BMI) in Americans. This study aimed to evaluate whether ABSI is applicable to Japanese adults as a predictor for development of diabetes, hypertension, and dyslipidemia.
Subjects/Methods
We evaluated the predictive power of ABSI in a retrospective cohort study using annual health examination data from Chiba City Hall in Japan, for the period 2008 to 2012. Subjects included 37,581 without diabetes, 23,090 without hypertension, and 20,776 without dyslipi-demia at baseline who were monitored for disease incidence for 4 years. We examined the associations of standardized ABSI, BMI, and waist circumference (WC) at baseline with dis-ease incidence by logistic regression analyses. Furthermore, we conducted a case-matched study using the propensity score matching method.
Results
Elevated BMI, WC, and ABSI increased the risks of diabetes and dyslipidemia [BMI-diabe-tes: odds ratio (OR) = 1.26, 95% confidence interval (95%CI) = 1.20−1.32;
BMI-dyslipide-mia: OR = 1.15, 95%CI = 1.12−1.19; WC-diabetes: OR = 1.24, 95%CI = 1.18−1.31;
WC-dyslipidemia: OR = 1.15, 95%CI = 1.11−1.19; ABSI-diabetes: OR = 1.06, 95%CI = 1.01
−1.11; ABSI-dyslipidemia: OR = 1.04, 95%CI = 1.01−1.07]. Elevated BMI and WC, but not
higher ABSI, also increased the risk of hypertension [BMI: OR = 1.32, 95%CI = 1.27−1.37;
WC: OR = 1.22, 95%CI = 1.18−1.26; ABSI: OR = 1.00, 95%CI = 0.97−1.02]. Areas under
the curve (AUCs) in regression models with ABSI were significantly smaller than in models with BMI or WC for all three diseases. In case-matched subgroups, the power of ABSI was OPEN ACCESS
Citation:Fujita M, Sato Y, Nagashima K, Takahashi S, Hata A (2015) Predictive Power of a Body Shape Index for Development of Diabetes, Hypertension, and Dyslipidemia in Japanese Adults: A Retrospective Cohort Study. PLoS ONE 10(6): e0128972. doi:10.1371/journal.pone.0128972
Academic Editor:Shahrad Taheri, Weill Cornell Medical College in Qatar, QATAR
Received:September 23, 2014
Accepted:May 1, 2015
Published:June 1, 2015
Copyright:© 2015 Fujita et al. This is an open access article distributed under the terms of the
Creative Commons Attribution License, which permits unrestricted use, distribution, and reproduction in any medium, provided the original author and source are credited.
Data Availability Statement:Data were obtained from a third party (Chiba City Hall, National Health Insurance Division, Japan (http://www.city.chiba.jp/)). We made a contract with Chiba City Hall prohibiting us for disclosing any data provided without written consent. To request the data, please contact Misuzu Fujita (Affiliation: Department of Public Health, Chiba University Graduate School of Medicine. Adress: 1-8-1 Inohana, Chuo-ku, Chiba 260-8670, Japan. E-mail:
fujitam@chiba-u.jp).
weaker than that of BMI and WC for predicting the incidence of diabetes, hypertension, and dyslipidemia.
Conclusions
Compared with BMI or WC, ABSI was not a better predictor of diabetes, hypertension, and dyslipidemia in Japanese adults.
Introduction
Obesity is a well-known risk factor for mortality from all causes [1,2] and cardiovascular dis-ease (CVD) [1,3], and for incidences of non-communicable diseases such as diabetes [4,5], hypertension [5,6], and dyslipidemia [5]. Although body mass index (BMI, weight in kilo-grams divided by the square of height in meters) is widely used as a measure of obesity, it has potential weaknesses. The BMI does not distinguish weight due to fat accumulation from mus-cle weight [7,8] and does not distinguish peripheral fat from abdominal fat [9], the latter being more strongly associated with CVD risk. To partly overcome these weaknesses, waist circum-ference (WC) is used as an indicator of abdominal fat accumulation, and many studies have shown that WC can predict mortality from all causes and CVD more accurately than BMI [10,
11]. However, WC reflects not only abdominal fat accumulation but also overall body size (height and weight). In fact, WC is strongly correlated with both weight and BMI [12,13].
Krakauer et al. described a new anthropometric measure, a body shape index (ABSI), which quantifies abdominal adiposity relative to BMI and height, and reported that ABSI predicted all-cause mortality independently of BMI in a large cohort of American adults during an aver-age 4.8-year follow-up [13]. They also indicated that the predictive power of ABSI for all-cause mortality differed among ethnicities, with less predictive power in Latinos than Caucasian and African Americans, and acknowledged that additional cohort studies with other ethnic groups are necessary to clarify the limits of ABSI predictive efficacy [13]. To date, six cohort studies evaluating the ABSI for prediction of mortality or morbidity have been published [14–19]. Of these, three described the predictive power of ABSI for mortality from CVD [14] and all causes [15,16]. The largest of these studies, including 46,651 Europeans, concluded that the predictive powers of several abdominal obesity indicators, such as WC, hip ratio, and waist-to-stature ratio, were stronger predictors of CVD mortality than were BMI and ABSI [14], while a British study of 7,011 adults reported that ABSI was a robust predictor of all-cause mortality [15]. The smallest study, with 142 hemodialysis patients, found no relation between ABSI and mortality [16]. In the remaining three studies, the principle outcome measure was morbidity. One showed that ABSI was significantly associated with total stroke incidence in men, while BMI was not [17]. The others found that ABSI was associated with development of diabetes [18] or hypertension [19], although the predictive power was no better than WC or BMI.
The aim of this study is to evaluate the power of ABSI for predicting the development of dia-betes, hypertension, and dyslipidemia compared with BMI and WC in Japanese adults. This large retrospective cohort study is the first report evaluating ABSI in a Japanese population.
Materials and Methods
Study population
We examined the predictive power of ABSI for development of diabetes, hypertension, and dyslipidemia by retrospective analysis of annual health examination data collected from mem-bers of Chiba City National Health Insurance for the period 2008 to 2012. The patient selection
Universities, 2013. URL:http://www.city.chiba.jp/ sogoseisaku/sogoseisaku/kikaku/kyoudoukenkyuu. html. Grants from Chiba Foundation for Health Promotion & Disease Prevention. URL:http://www. kenko-chiba.or.jp/05kouhou/09cyousakenkyuu_h26. html. MEXT KAKENHI Grant Number 26460826. The funders had no role in study design, data collection and analysis, decision to publish, or preparation of the manuscript.
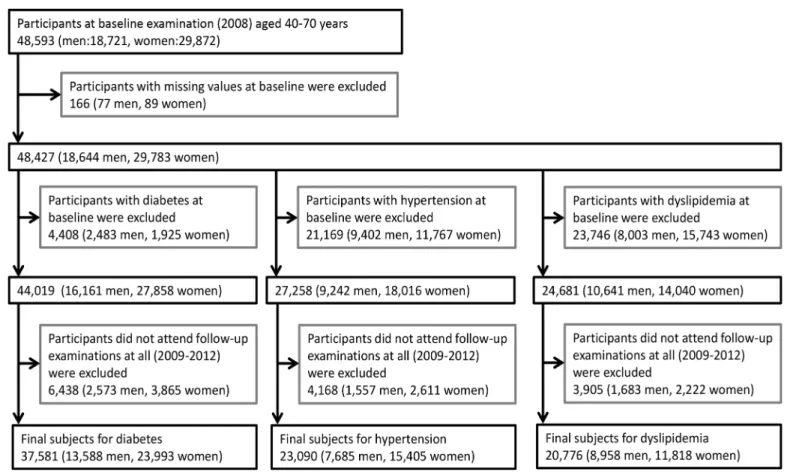
process is shown inFig 1. In 2008, 48,593 members (18,721 men, 29,872 women) age 40−70
years attended annual health examinations at designated clinics or hospitals in the city. We ex-cluded 166 participants (77 men, 89 women) with missing information at baseline. For the analysis of incidence of diabetes, hypertension, and dyslipidemia during follow-up, 4,408 par-ticipants (2,483 men, 1,925 women) with diabetes, 21,169 (9,402 men and 11,767 women) with hypertension, and 23,746 participants (8,003 men, 15,743 women) with dyslipidemia at base-line were excluded. Diabetes was defined as fasting plasma glucose7.0 mmol/L, hemoglobin A1c (HbA1c)6.5%, or current use of medications for diabetes as indicated by a self-report questionnaire in accordance with guidelines of the Japanese Diabetes Society [20]. Blood sam-ples were drawn for measurement of plasma glucose during fasting and for measurement of HbA1c in the non-fasting period. Hypertension was defined as systolic blood pressure (SBP)
140 mmHg, diastolic blood pressure (DBP)90 mmHg, or current use of antihypertensive medications as indicated by a self-report questionnaire according to the guidelines for the man-agement of hypertension [21]. Dyslipidemia was defined as low-density lipoprotein cholesterol (LDL-C)140 mg/dL, high-density lipoprotein cholesterol (HDL-C)<40 mg/dL, or current use of medication for dyslipidemia according to the guidelines for prevention of arteriosclerosis [22]. Furthermore, participants who did not attend annual health examinations for the period 2009 to 2012 were excluded, comprising 6,438 for diabetes analysis (2,573 men, 3,865 women), 4,168 for hypertension analysis (1,557 men, 2,611 women), and 3,905 for dyslipidemia analysis (1,683 men, 2,222 women). The final subject populations for analysis of new disease incidence during follow-up were 37,581 confirmed non-diabetics (13,588 men, 23,993 women), 23,090
Fig 1. Selection of the subjects in this study for examining the incidence of diabetes, hypertension, and dyslipidemia.
confirmed non-hypertensives (7,685 men, 15,405 women), and 20,776 without dyslipidemia (8,958 men, 11,818 women). Thus, we could not follow the subjects completely. There were 6,438 dropouts during follow-up in the baseline non-diabetic cohort (14.6% of the total), 4,168 (15.3%) in the baseline non-hypertensive cohort, and 3,905 (15.8%) in the baseline non-dysli-pidemic cohort (S1 Table). There were marked differences in baseline characteristics between these dropouts and retained study subjects. For example, the dropouts were younger, more likely to be smokers, heavier, and had lower mean ABSI values compared with retained subjects in all three subgroups. In addition, dropouts had higher BMIs than the baseline non-diabetic and non-hypertensive subgroups.
Ethics statement
Consent was not obtained from subjects because this study was performed using the data ob-tained from annual health examinations and conducted in accordance with the Act on Assur-ance of Medical Care for the Elderly enforced by the Ministry of Health, Labour and Welfare. To ensure anonymity, personal identifiers (e.g., name, address, and telephone number) were removed from the records, date of birth was converted into the 1st of each month, and personal ID was converted into a random number at Chiba City Hall prior to release for analysis. The Institutional Review Board of Chiba University Graduate School of Medicine approved this study. All procedures were in accordance with the Ethical Guidelines for Epidemiological Re-search of the Japanese Ministry of Education, Culture, Sports, Science and Technology and the Japanese Ministry of Health, Labour and Welfare. The study was conducted in accordance with the Declaration of Helsinki.
Baseline examination
We defined the results from the 2008 annual health examinations as the baseline data. Height, weight, WC, SBP, and DBP were measured and blood samples drawn during periods of fasting or non-fasting. Weight and height were measured without shoes and while wearing light clothes. WC was measured at the level of the umbilicus with an anthropometric measuring tape. However, when the umbilicus level was drooping due to excess abdominal fat accumula-tion, WC was measured at the midpoint between the lower border of the rib cage and the iliac crest. BMI was calculated as weight in kilograms divided by the square of height in meters. ABSI was calculated as WC/(BMI2/3height1/2), with WC and height in meters [13]. Serum glu-cose, HbA1c, LDL-C, HDL-C, AST, ALT, and GGT were determined by commercial clinical laboratories. Subjects were categorized according to the following parameters. (1) Diabetes cat-egory (normal, borderline, and diabetic) was determined on the basis of baseline fasting plasma glucose, HbA1c, or self-reported use of medications for diabetes according to the guidelines of the Japanese Diabetes Society [20]; with normal (no diabetes) defined as fasting plasma glucose<6.1 mmol/L or HbA1c<6.0% and no history of diabetes medication use; borderline as fasting plasma glucose between 6.1 and<7.0 mmol/L or HbA1c between 6.0% and<6.5% and no use of medication for diabetes; and diabetic as fasting plasma glucose7.0 mmol/L, or HbA1c6.5% or current use of medication for diabetes. (2) Smoking status (non-smoker, smoker) was defined using a self-report questionnaire. Plasma concentrations of HDL-C, AST, ALT, and GGT were transformed logarithmically because the distributions of these variables were not normal.
Incidence of diabetes, hypertension, and dyslipidemia
completion of a self-report questionnaire about medications for diabetes, hypertension, and dyslipidemia. Fasting plasma glucose (or HbA1c), LDL-C, and HDL-C were measured at each follow-up examination. Subjects with fasting plasma glucose7.0 mmol/L, HbA1c6.5%, or reporting medication for diabetes during follow-up but without diabetes at baseline were de-fined as new diabetic patients. Similarly, subjects with SBP140 mmHg, DBP90 mmHg, or reporting medication for hypertension during follow-up but without hypertension at base-line were defined as new hypertensive patients. Subjects with LDL-C140 mg/dL,
HDL-C<40 mg/dL, or reporting medication for dyslipidemia but without dyslipidemia at baseline were defined as new dyslipidemic patients.
Statistical analysis
Continuous variables are presented as mean ± standard deviation. For each disease, compari-son of variables between cases and controls was performed using unpaired t-tests or chi-square tests as appropriate and in case-matched subgroups using McNemar’s test or the paired t-test as appropriate. We also calculated the standardized difference (SD) between cases and controls for all subjects and for case-matched subgroups [23]. The correlations among BMI, WC, and ABSI were evaluated by Pearson’s correlation coefficients.
Calculating Z-scores. For standardization, Z-scores for height, weight, BMI, WC, and ABSI were calculated as reported by Krakauer et al. [13]. First, we computed the sample mean and standard deviation for each age (in years) separately for all men and women (48,759 sub-jects in total) who did not have missing data at baseline (each marker inFig 2). Second, we ob-tained the predicted mean and standard deviation for each age from the quadratic curve that described the change in mean or standard deviation with age (trend lines inFig 2). From mea-surement values, predicted means, and standard deviations, Z-scores were calculated as fol-lows: (measurement value—predicted mean)/predicted standard deviation.
Logistic regression analysis. We conducted logistic regression analysis to examine the as-sociations of standardized BMI, WC, and ABSI (Z-scores) with incidences of diabetes, hyper-tension, and dyslipidemia. Logistic regression analyses were performed using two model types: sex- and age-adjusted models and multivariable-adjusted models including the covariates of sex, age, diabetes category (normal, borderline, or diabetes), SBP, DBP, LDL-C, log [HDL-C], log [AST], log [ALT], log [GGT], and smoking habit at baseline depending on application. All factors were included in the model for new diabetes incidence in the baseline non-diabetic co-hort except for diabetes category; all except SBP and DBP for analysis of new hypertension inci-dence in the baseline non-hypertensive cohort; and all except LDL-C and log [HDL-C] for analysis of new dyslipidemia incidence in the baseline non-dyslipidemic cohort. Each regres-sion was conducted both with and without BMI adjustment. For sensitivity analysis, logistic re-gression was also performed in subgroups stratified by sex. The model selection criteria were Akaike’s information criterion (AIC) and area under the curve (AUC) from receiver operating characteristic analysis.
analysis of new diabetes incidence; all except SBP and DBP for analysis of new hypertension in-cidence; and all except LDL-C and log [HDL-C] for analysis of new dyslipidemia incidence. The greedy 5-to-1 digit-matching algorithm yields“best”matches first and then“next-best”
matches in a hierarchical sequence until no more matches can be made. Greedy 5-to-1
digit-Fig 2. Mean and standard deviation of ABSI, BMI, and WC stratified by sex and age.Abbreviations: BMI, body mass index; WC, waist circumference; ABSI, a body shape index. Each marker shows mean and standard deviation stratified by sex and age. Black squares, men; gray circles, women.
matching means that the cases were first matched to controls on 5 digits of the propensity score. For those that did not match, cases were then matched to controls on 4 digits of the pro-pensity score. This continued down to a 1-digit match on propro-pensity score for subjects that re-mained unmatched. This algorithm yields 1:1 case−control pairs [24]. After this process, there
were 1,947 pairs for diabetes, 6,962 pairs for hypertension, and 7,263 pairs for dyslipidemia. Conditional logistic regression models were used to assess the associations of BMI, WC, and ABSI with each disease in case-matched subgroups yielded by the propensity score matching method.
All comparisons were planned and all tests two-tailed. A p-value<0.05 was considered sta-tistically significant. All statistical analyses were performed using SAS software version 9.4 (SAS Institute, Cary, NC) and STATA13 software package (Stata Corp., College Station, TX).
Table 1. Baseline characteristics of all subjects divided according to the absence of disease at baseline (diabetes, hypertension, dyslipidemia) and subdivided according to onset of new disease during follow-up (cases vs. controls).
Diabetes Hypertension Dyslipidemia
Without Incidence (controls) With Incidence (cases) p-value SD (%) Without Incidence (controls) With Incidence (cases) p-value SD (%) Without Incidence (controls) With Incidence (cases) p-value SD (%) Number of subjects
35,634 1,947 16,127 6,963 13,513 7,263
%Mena 35.3 52.6 <0.001 -21.8 31.1 38.3 <0.001 -8.8 44.6 40.4 <0.001 5.6
Age (years)b 63.1 (6.7) 64.5 (5.4) <0.001 -20.6 61.5 (7.7) 63.9 (5.8) <0.001 -32.8 62.4 (7.6) 63.3 (6.5) <0.001 -13.2
Height (cm)b 158.1 (8.2) 159.5 (8.4) <0.001 -17.6 158.2 (8.1) 158.2 (8.3) 0.596 -0.8 159.5 (8.4) 158.7 (8.2) <0.001 10.4 Weight (kg)b 56.8 (10.1) 61.5 (10.8) <0.001 -46.6 55.0 (9.6) 57.1 (10.0) <0.001 -21.9 56.8 (10.3) 57.5 (10.4) <0.001 -6.5
Waist (cm)b 81.8 (8.8) 85.9 (9.0) <0.001 -46.9 79.8 (8.6) 82.2 (8.6) <0.001 -27.2 80.6 (9.1) 82.1 (8.8) <0.001 -16.4
BMI (kg/m2)b 22.6 (3.0) 24.1 (3.4) <0.001 -48.0 21.9 (2.8) 22.7 (2.9) <0.001 -29.2 22.2 (3.1) 22.7 (3.1) <0.001 -16.2
ABSIb 0.0815 (0.00532)
0.0818 (0.00479)
0.008 -5.2 0.0813 (0.00544)
0.0816 (0.00525)
<0.001 -5.4 0.0810 (0.00523)
0.0815 (0.00515)
<0.001 -8.4
Diabetes categorya
Normal 91.7 43.5 <0.001 156.9 87.6 83.0 <0.001 12.2 85.3 83.3 <0.001 5.1
Borderline 8.3 56.6 -54.5 7.6 9.3 -1.8 8.4 9.3 -0.9
Diabetes - - 4.9 7.7 -3.6 6.3 7.4 -1.2
SBPb 128 (16.7) 133 (16.4) <0.001 -28.4 117 (11.7) 126 (8.7) <0.001 -82.2 128 (17.2) 129 (16.8) <0.001 -6.5
DBPb 77 (10.6) 79 (10.4) <0.001 -17.9 71 (8.5) 76 (7.8) <0.001 -58.7 76 (10.9) 77 (10.7) 0.006 -4.0 LDL-Cb 128 (30.3) 128 (32.1) 0.857 0.4 128 (30.4) 129 (30.9) 0.121 -2.2 106 (19.2) 122 (15.1) <0.001 -89.3
Log HDL-Cb 4.15 (0.26) 4.06 (0.26) <0.001 34.4 4.17 (0.26) 4.14 (0.27) <0.001 13.4 4.21 (0.24) 4.12 (0.25) <0.001 37.4
Log ASTb 3.12 (0.28) 3.19 (0.35) <0.001 -25.7 3.10 (0.28) 3.13 (0.30) <0.001 -11.6 3.13 (0.31) 3.12 (0.30) 0.026 3.2
Log ALTb 2.95 (0.43) 3.15 (0.50) <0.001 -46.2 2.91 (0.42) 2.98 (0.45) <0.001 -14.9 2.93 (0.44) 2.95 (0.45) <0.001 -5.5 Log GGTb 3.24 (0.64) 3.54 (0.71) <0.001 -47.5 3.14 (0.60) 3.28 (0.65) <0.001 -23.1 3.27 (0.70) 3.28 (0.68) 0.959 -0.1
Smoking
habita 13.2 19.3
<0.001 -6.6 13.8 13.9 0.803 -0.14 16.7 13.7 <0.001 3.2
ABSI, a body shape index; WC, waist circumference; BMI, body mass index; SD, standardized difference; SBP, systolic blood pressure; DBP, diastolic blood pressure; LDL-C, low-density lipoprotein cholesterol; HDL-C, high-density lipoprotein cholesterol; AST, aspartate aminotransferase; ALT, alanine aminotransferase; GGT, gamma-glutamyltransferase
aPercentage and p-value by the chi-square test
bMean (standard deviation) and p-value by the unpaired t-test
Results
The mean ABSI for the entire cohort increased with age in both men and women (Fig 2A). Means were similar in younger men and women (<55 years) but the increase with age was larger in women thereafter and ABSI was more variable in women at all ages (Fig 2D). In con-trast, mean BMI (Fig 2B) and WC (Fig 2C) exhibited modest age-dependent decreases in men (larger for BMI), while women exhibited age-dependent increases with similar trajectories. The SDs of BMI and WC were similar in men and women, with a nearly parallel age-dependent de-crease (Fig 2E and 2F). The standardized WC was strongly correlated with weight (r = 0.803) and with BMI (r = 0.809), while ABSI did not correlate with weight (r =−0.006) or BMI (r =
−0.034) and the correlation with WC was only moderate (r = 0.530).
The baseline characteristics of all subjects (data from 2008), with and without eventual de-velopment of the disease of interest during follow-up (2009−2012), are shown inTable 1.
Al-most all baseline characteristics differed between the case group and control group. In total, 1,947 of 37,581 subjects confirmed to be non-diabetic at baseline were eventually diagnosed with diabetes during the follow-up period (5.2%); 6,963 of 23,090 subjects confirmed to be non-hypertensive at baseline were eventually diagnosed with hypertension (30.2%); and 7,263 of 20,776 subjects without dyslipidemia at baseline were eventually diagnosed with dyslipide-mia (35.0%). For all three diseases, BMI, WC, and ABSI at baseline were significantly larger in the case group than the control group (p<0.001).
Logistic regression analyses
Table 2shows the odds ratios (ORs) of standardized BMI, WC, and ABSI values (Z-scores) for development of diabetes, hypertension, and dyslipidemia in age- and sex-adjusted models.
For diabetes without BMI adjustment, all three parameters (BMI, WC, and ABSI) were posi-tively associated with disease incidence (p<0.001). However, the larger AIC and significantly smaller AUC in the model with ABSI compared with models with BMI (p<0.001) or WC (p<0.001) indicate that the predictive power of ABSI is weaker than those of BMI or WC for diabetes. With BMI adjustment, the predictive powers of WC and ABSI remained significant (both p<0.001). The result of smaller AIC and significantly greater AUC in the model with ABSI than that with WC (p = 0.039) suggests that the predictive power of ABSI independent of BMI for diabetes is greater than that of WC. However, the observation that AUCs was not sig-nificantly different (p = 0.180) with ABSI and WC in the multivariable-adjusted models (Table 3) indicates that both parameters have similar predictive powers.
For hypertension without BMI adjustment, elevated BMI and WC were significantly associ-ated with increased disease incidence (p<0.001), while ABSI was not (p = 0.188), as shown in
Table 2. The greater AIC was observed in the model with ABSI than those with BMI and WC, while a significantly smaller AUC was observed in the ABSI model compared with those with BMI and WC (both p<0.001). With BMI adjustment, neither WC nor ABSI was significantly associated with the incidence of hypertension (p = 0.273 and p = 0.079, respectively). The AICs were similar in models with WC or ABSI, and the AUCs did not differ significantly (p = 0.383). Thus, similar to diabetes, the predictive power of ABSI for hypertension incidence was weaker than those of BMI and WC when BMI was not adjusted, while the powers of ABSI and WC were similar after BMI adjustment. These results are consistent with those in the multivariable-adjusted models (Table 3), where BMI and WC were significant predictors of hypertension in-cidence (p<0.001), while ABSI was not (p = 0.742). With BMI adjustment, neither WC nor ABSI was a significant predictor of hypertension.
in sex- and age-adjusted models. Again, the greater AIC and significantly smaller AUC was ob-served in the model with ABSI compared with those with BMI or WC (both p<0.001). After BMI adjustment, WC and ABSI were significantly associated with the incidence of dyslipide-mia (both p<0.001), showing similar AICs and AUCs (p = 0.482). These results are consistent with those for multivariable-adjusted models (Table 3), where all three parameters were predic-tive of dyslipidemia without BMI adjustment (p<0.001, p<0.001, and p = 0.011, respective-ly) but the predictive power of ABSI was slightly weaker as indicated by the AIC and AUC values. Both WC and ABSI were also significant predictors in models with BMI adjustment (both p = 0.002). The ORs were also calculated and data were stratified by BMI, WC, and ABSI Z-score ranges both without (Fig 3) and with BMI correction (Fig 4). Results were consistent with analysis of the continuous data (Table 3).
Sensitivity analysis
We also performed logistic regression analysis in subgroups stratified by sex (Table 4). These results were generally consistent with those for the individual baseline non-diabetic,
Table 2. Associations between disease incidence (diabetes, hypertension, dyslipidemia) and Z-scores for BMI, WC, and ABSI in sex- and age-ad-justed models.
OR (95% CI) p-value for OR AIC AUC (95% CI) p-value for AUC1
Diabetes
Without BMI adjustment2
BMI 1.47 (1.41−1.54) <0.001 14733 0.6648 (0.6531−0.6764) <0.001
WC 1.46 (1.40−1.53) <0.001 14763 0.6605 (0.6489−0.6721) <0.001
ABSI 1.11 (1.06−1.16) <0.001 15003 0.6176 (0.6053−0.6299) reference
With BMI adjustment3
WC 1.18 (1.09−1.27) <0.001 14718 0.6669 (0.6553−0.6785) 0.039
ABSI 1.14 (1.09−1.19) <0.001 14706 0.6680 (0.6564−0.6796) reference
Hypertension
Without BMI adjustment2
BMI 1.36 (1.32−1.40) <0.001 27277 0.6237 (0.6161−0.6313) <0.001
WC 1.27 (1.23−1.31) <0.001 27394 0.6146 (0.6069−0.6223) <0.001
ABSI 1.02 (0.99−1.05) 0.188 27630 0.5943 (0.5866−0.6020) reference
With BMI adjustment3
WC 1.03 (0.98−1.08) 0.273 27278 0.6237 (0.6161−0.6313) 0.383
ABSI 1.03 (0.99−1.06) 0.079 27276 0.6238 (0.6162−0.6314) reference
Dyslipidemia
Without BMI adjustment2
BMI 1.20 (1.16−1.24) <0.001 26619 0.5721 (0.5641−0.5802) <0.001
WC 1.19 (1.16−1.23) <0.001 26623 0.5706 (0.5625−0.5786) <0.001
ABSI 1.05 (1.02−1.08) 0.001 26756 0.5504 (0.5422−0.5585) reference
With BMI adjustment3
WC 1.10 (1.05−1.15) <0.001 26607 0.5734 (0.5653−0.5814) 0.482
ABSI 1.05 (1.02−1.08) <0.001 26608 0.5736 (0.5655−0.5816) reference
OR, odds ratio; CI, confidence interval; ABSI, a body shape index; WC, waist circumference; BMI, body mass index; AIC, Akaike’s information criterion; AUC, area under the curve
1p-value with Bonferroni
’s correction
2Adjusted for sex and age (continuous variable, year) 3Adjusted for BMI Z-score and the variables described above
non-hypertensive, and non-dyslipidemic groups (Table 3). However, in men, compared with ABSI, BMI and WC were not stronger predictors of diabetes when BMI was not adjusted (Table 4) (p for AUC = 0.999 and 0.829, respectively). Furthermore, the interactions between sex and BMI and between sex and WC were significant (p<0.001), while that between sex and ABSI was not (p = 0.465), suggesting that the effects of high BMI and WC on diabetes inci-dence are greater in women than in men, but the effect of ABSI does not differ by sex.
Study of case-matched subset by propensity score
All baseline characteristics differed significantly between cases and controls for all three dis-eases in the total cohorts (Table 1), but no significant differences remained in the variables used for calculating propensity score following propensity score matching (Table 5), and all
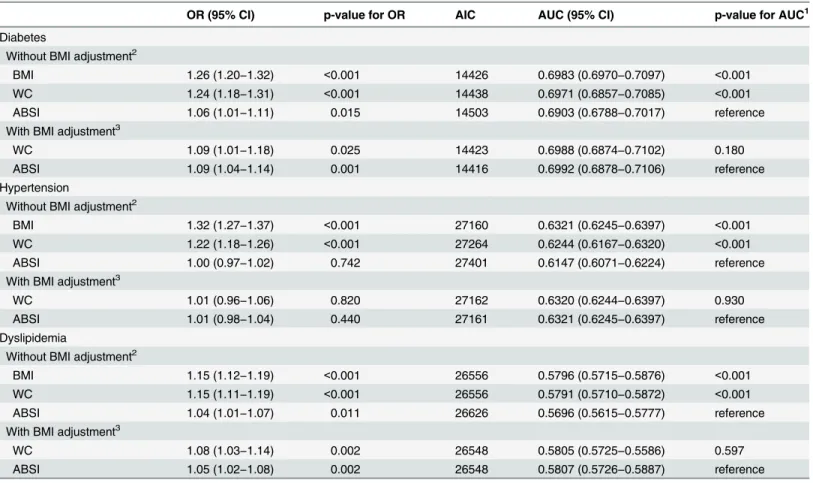
Table 3. Associations between new disease incidence (diabetes, hypertension, and dyslipidemia) and Z-scores for BMI, WC, and ABSI as revealed by logistic regression analysis of all subjects in the multivariable-adjusted model.
OR (95% CI) p-value for OR AIC AUC (95% CI) p-value for AUC1
Diabetes
Without BMI adjustment2
BMI 1.26 (1.20−1.32) <0.001 14426 0.6983 (0.6970−0.7097) <0.001
WC 1.24 (1.18−1.31) <0.001 14438 0.6971 (0.6857−0.7085) <0.001
ABSI 1.06 (1.01−1.11) 0.015 14503 0.6903 (0.6788−0.7017) reference
With BMI adjustment3
WC 1.09 (1.01−1.18) 0.025 14423 0.6988 (0.6874−0.7102) 0.180
ABSI 1.09 (1.04−1.14) 0.001 14416 0.6992 (0.6878−0.7106) reference
Hypertension
Without BMI adjustment2
BMI 1.32 (1.27−1.37) <0.001 27160 0.6321 (0.6245−0.6397) <0.001
WC 1.22 (1.18−1.26) <0.001 27264 0.6244 (0.6167−0.6320) <0.001
ABSI 1.00 (0.97−1.02) 0.742 27401 0.6147 (0.6071−0.6224) reference
With BMI adjustment3
WC 1.01 (0.96−1.06) 0.820 27162 0.6320 (0.6244−0.6397) 0.930
ABSI 1.01 (0.98−1.04) 0.440 27161 0.6321 (0.6245−0.6397) reference
Dyslipidemia
Without BMI adjustment2
BMI 1.15 (1.12−1.19) <0.001 26556 0.5796 (0.5715−0.5876) <0.001
WC 1.15 (1.11−1.19) <0.001 26556 0.5791 (0.5710−0.5872) <0.001
ABSI 1.04 (1.01−1.07) 0.011 26626 0.5696 (0.5615−0.5777) reference
With BMI adjustment3
WC 1.08 (1.03−1.14) 0.002 26548 0.5805 (0.5725−0.5586) 0.597
ABSI 1.05 (1.02−1.08) 0.002 26548 0.5807 (0.5726−0.5887) reference
OR, odds ratio; CI, confidence interval; ABSI, a body shape index; WC, waist circumference; BMI, body mass index; AIC, Akaike’s information criterion; AUC, area under the curve
1p-value with Bonferroni
’s correction
2Adjusted for sex and all baseline characteristics, including age (continuous variable, year), diabetes category, systolic blood pressure, diastolic blood
pressure, low-density lipoprotein cholesterol, log [high-density lipoprotein cholesterol], log [aspartate aminotransferase], log [alanine aminotransferase], log [gamma-glutamyltransferase] and smoking habit, depending on application. The diabetes category was omitted for the analysis of new diabetes incidence, systolic blood pressure and diastolic blood pressure were omitted for analysis of new hypertension incidence, and low-density lipoprotein cholesterol and log [high-density lipoprotein cholesterol] were omitted for the analysis of new dyslipidemia incidence.
3Adjusted for BMI Z-score and the variables described above
Fig 3. Odds ratio and 95% confidence interval of BMI, WC, and ABSI for predicting the onset of diabetes, hypertension, and dyslipidemia without BMI adjustment.Abbreviations: BMI, body mass index; WC, waist circumference; ABSI, a body shape index; AIC, Akaike’s information criterion; AUC, area under the curve; 95% CI, 95% confidence interval. Models were adjusted for sex and baseline
imbalances between cases and controls were less than 20% [23].Table 6shows the results of conditional logistic regression analysis for these case-matched subgroups. Results indicate that compared with WC and BMI, ABSI had weaker predictive power for the incidence of all three diseases.
Discussion
Our retrospective cohort study revealed that compared with BMI and WC, ABSI was not a bet-ter predictor of diabetes, hypertension, or dyslipidemia incidence in Japanese adults. In addi-tion, using propensity score matching as an alternative evaluation method, the predictive power of ABSI for all three diseases was also lower than those of BMI and WC.
In American Caucasians, high ABSI accounted for a greater proportion of the total mortali-ty hazard than did elevated BMI [13]. There are two possible reasons for this discrepancy. One is the different outcome measures used: all-cause mortality versus specific disease conditions. The other is racial differences. In regard to the first reason, a U-shaped or J-shaped association between all-cause mortality and BMI has been reported [1,10,13], while the associations of di-abetes, hypertension, and dyslipidemia incidence [5] and prevalence [25,26] with BMI are typically linear or nearly linear. In our study, near-linear associations between BMI and the in-cidence of diabetes and hypertension were also observed. In regard to the second reason, mor-phometric and physiological racial differences may alter the health implications of these indices. For example, the prevalence of obesity in Japanese adults was much lower than Ameri-cans [27]. In addition, East Asians, including the Japanese, are known to have limited innate capacity for insulin secretion, resulting in greater susceptibility to type 2 diabetes than Cauca-sians [28]. A prospective cohort study of Chinese adults of a smaller scale (n = 687) with the in-cidence of diabetes as the primary outcome has reported that the predictive power of ABSI was no better than that of WC or BMI [18]. In another study, the association of ABSI with hyper-tension incidence was found to be weaker than WC or BMI among 8,255 Indonesians [19]. Our results were consistent with those of these two studies of Asian subjects that examined the incidence of diabetes or hypertension as outcomes, even though the precise reasons for the dis-crepancy were unable to be ascertained. It should be noted that correlations between BMI, WC, and ABSI in our study were similar to those of Krakauer et al [13]. In brief, both studies found a high correlation between BMI and WC, a moderate correlation between ABSI and WC, but almost no correlation between ABSI and BMI.
ABSI was significantly associated with the incidence of diabetes and dyslipidemia even after adjustment for BMI. These BMI-independent associations may reflect the fact that ABSI repre-sents central body mass, such as higher visceral fat accumulation, higher trunk fat accumula-tion, and lesser limb lean mass. Furthermore, in the sex- and age-adjusted models, the finding that the predictive power of ABSI for diabetes independent of BMI was significantly greater than that of WC, could be interesting (Table 2). If this is true, ABSI has an advantage over WC in predicting diabetes. However, this association was not observed in the multivariable-adjust-ed models (Table 3), after propensity score matching (Table 6), or in sensitivity analyses (Table 4). Thus, the stronger predictive power of ABSI might be confounded by other co-vary-ing baseline characteristics.
[aspartate aminotransferase], log [alanine aminotransferase], log [gamma-glutamyltransferase] and smoking habit, depending on application. Diabetes category was excluded for the analysis of diabetes, systolic blood pressure and diastolic blood pressure for the analysis of hypertension, and low-density lipoprotein cholesterol and log [high-density lipoprotein cholesterol] for the analysis of dyslipidemia.
Fig 4. Odds ratio and 95% confidence interval of WC and ABSI categories for development of diabetes, hypertension and dyslipidemia with BMI adjustment.Abbreviations: BMI, body mass index; WC, waist circumference; ABSI, a body shape index; AIC, Akaike’s information criterion; AUC, area under the curve; 95% CI, 95% confidence interval. Adjusted for BMI category in addition to same variables as shown inFig 3.
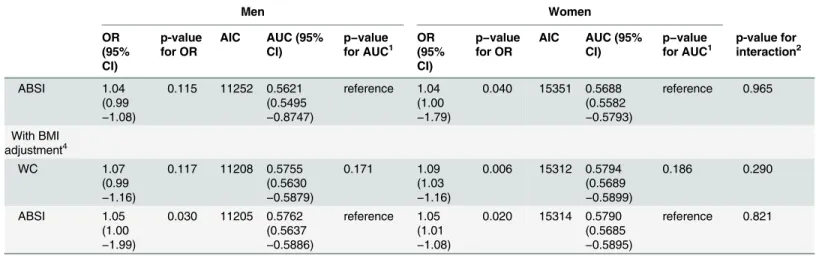
Table 4. Sensitivity analysis in subgroups stratified by sex. Men Women OR (95% CI) p-value for OR
AIC AUC (95% CI)
p−value for AUC1
OR (95% CI)
p−value for OR
AIC AUC (95% CI)
p−value for AUC1
p-value for interaction2 Diabetes Without BMI adjustment3 BMI 1.12 (1.04 −1.21)
0.002 7057 0.6385 (0.6212 −0.6557)
0.999 1.39
(1.30 −1.48)
<0.001 7350 0.7039 (0.6872 −0.7206)
<0.001 <0.001
WC 1.11
(1.03 −1.20)
0.005 7059 0.6384 (0.6211 −0.6556)
0.829 1.39
(1.29 −1.49)
<0.001 7358 0.7016 (0.6848 −0.7183)
<0.001 <0.001
ABSI 1.05
(0.98 −1.12)
0.132 7065 0.6369 (0.6197 −0.6542)
reference 1.08 (1.01 −1.15)
0.032 7437 0.6891 (0.6724 −0.7057) reference 0.465 With BMI adjustment4 WC 1.04 (0.92 −1.17)
0.566 7059 0.6386 (0.6213 −0.6556)
0.227 1.17
(1.06 −1.30)
0.002 7343 0.7048 (0.6881 −0.7215)
0.789 <0.001
ABSI 1.07
(0.99 −1.14)
0.053 7056 0.6396 (0.6224 −0.6569)
reference 1.11 (1.04 −1.19)
0.003 7343 0.7049 (0.6882 −0.7216) reference 0.607 Hypertension Without BMI adjustment3 BMI 1.26 (1.19 −1.34)
<0.001 9632 0.6157 (0.6028 −0.6287)
0.001 1.36
(1.30 −1.43)
<0.001 17487 0.6355 (0.6260 −0.6450)
<0.001 0.061
WC 1.20
(1.13 −1.27)
<0.001 9654 0.6116 (0.5986 −0.6246)
0.016 1.23
(1.18 −1.29)
<0.001 17574 0.6254 (0.6159 −0.6350)
<0.001 0.422
ABSI 1.00
(0.95 −1.05)
0.978 9693 0.6039 (0.5909 −0.6170)
reference 0.99 (0.96 −1.03)
0.619 17674 0.6157 (0.6062 −0.6253) reference 0.637 With BMI adjustment4 WC 1.01 (0.92 −1.10)
0.903 9634 0.6157 (0.6028 −0.6287)
0.665 1.01
(0.95 −1.07)
0.817 17489 0.6354 (0.6259 −0.6449) 0.395 0.166 ABSI 1.02 (0.97 −1.07)
0.418 9633 0.6159 (0.6029 −0.6288)
reference 1.00 (0.97 −1.04)
0.809 17489 0.6354 (0.5259 −0.6449) reference 0.373 Dyslipidemia Without BMI adjustment3 BMI 1.19 (1.13 −1.24)
<0.001 11208 0.5748 (0.5623 −0.5873)
0.004 1.14
(1.09 −1.19)
<0.001 15317 0.5775 (0.5670 −0.5880) 0.002 0.105 WC 1.17 (1.12 −1.23)
<0.001 11213 0.5735 (0.5611 −0.5860)
0.001 1.14
(1.10 −1.19)
<0.001 15314 0.5783 (0.5678 −0.5888)
<0.001 0.222
We found that the predictive powers of BMI and WC for diabetes incidence are greater in women than in men, while that of ABSI does not differ by sex (Table 4). Cross-sectional studies in the Japanese population [29] and in the Framingham Heart Study [30] have shown that as-sociations of metabolic risk factors, such as systolic and diastolic blood pressure, fasting glu-cose, and total cholesterol, with increasing volumes both of subcutaneous and visceral fat, strictly measured by computed tomography, were stronger in women than in men. Our obser-vation of a sex difference in BMI and WC could be the same phenomenon, but this is not the case with ABSI. Thus, ABSI might have an implication for disease incidence that is different from BMI or WC. Further studies are necessary to conclude whether this difference is true or not.
The following four limitations in our study are conceivable. First, due to the retrospective cohort design, we could not obtain other potentially relevant data, such as alcohol consump-tion and levels of physical activity, which may confound the associaconsump-tions of BMI, WC, and ABSI with disease incidence. To correct this, we have made adjustment for potential confound-ing factors as much as possible usconfound-ing logistic regression analysis and the propensity score matching method. Second, fasting blood glucose data for some subjects were not available. To compensate for this, we employed HbA1c data and history of diabetes medication to obtain an accurate diagnosis. Third, some bias might exist that resulted in underestimation of associa-tions because the reasons and outcomes of non-attendance of annual health checkup are un-known. Fourth, the generalizability of our findings might be limited because the subjects are
Table 4. (Continued)
Men Women OR (95% CI) p-value for OR
AIC AUC (95% CI)
p−value for AUC1
OR (95% CI)
p−value for OR
AIC AUC (95% CI)
p−value for AUC1
p-value for interaction2
ABSI 1.04
(0.99 −1.08)
0.115 11252 0.5621 (0.5495 −0.8747)
reference 1.04 (1.00 −1.79)
0.040 15351 0.5688 (0.5582 −0.5793) reference 0.965 With BMI adjustment4 WC 1.07 (0.99 −1.16)
0.117 11208 0.5755 (0.5630 −0.5879)
0.171 1.09
(1.03 −1.16)
0.006 15312 0.5794 (0.5689 −0.5899) 0.186 0.290 ABSI 1.05 (1.00 −1.99)
0.030 11205 0.5762 (0.5637 −0.5886)
reference 1.05 (1.01 −1.08)
0.020 15314 0.5790 (0.5685 −0.5895)
reference 0.821
OR, odds ratio; CI, confidence interval; ABSI, a body shape index; WC, waist circumference; BMI, body mass index; AIC, Akaike’s information criterion; AUC, area under the curve
Subjects were 13,588 men and 23,993 women without diabetes at baseline, 7,685 men and 15,405 women without hypertension at baseline, and 8,958 men and 11,818 women without dyslipidemia at baseline.
1p-value with Bonferroni
’s correction
2p-value for interaction of sex with BMI, WC, and ABSI
3Adjusted for baseline characteristics, including age (continuous variable, year), diabetes category, systolic blood pressure, diastolic blood pressure,
low-density lipoprotein cholesterol, log [high-low-density lipoprotein cholesterol], log [aspartate aminotransferase], log [alanine aminotransferase], log [gamma-glutamyltransferase] and smoking habit, except for diabetes category in the analysis of diabetes, systolic blood pressure and diastolic blood pressure in the analysis of hypertension, and low-density lipoprotein cholesterol and log [high-density lipoprotein cholesterol] in the analysis of dyslipidemia.
4Adjusted for BMI Z-score and the variables described above
mainly elderly adults living in one urban area of Japan with a relatively higher incidence of hy-pertension (30.2%) and dyslipidemia (35.0%) during the 4-year period. On the other hand, the major advantage of our study is that we obtained consistent results using two different covari-ate adjustment methods (logistic regression analysis and the propensity score matching) and also from sensitivity analyses. Furthermore, new-onset diabetes, hypertension, and dyslipide-mia was confirmed both by self-reported medication use and physiological measures. Since subjects are not always aware of their disease, we may underestimate disease incidence when it is determined only by self-reported medication use.
In conclusion, ABSI was not a better predictor of diabetes, hypertension, and dyslipidemia incidence than BMI and WC in Japanese adults. However, ABSI had significant associations with the incidence of diabetes and dyslipidemia independently of BMI.
Table 5. Baseline characteristics of controls and cases after propensity score matching.
Diabetes Hypertension Dyslipidemia
Without Incidence (controls) With Incidence (cases) p-value SD (%) Without Incidence (controls) With Incidence (cases) p-value SD (%) Without Incidence (controls) With Incidence (cases) p-value SD (%) Number of subjects
1,947 1,947 6,962 6,962 7,263 7,263
Men
percenta 53.6 52.6 0.477 1.4
c 38.0 38.3 0.220 -0.4c 40.4 40.4 0.971 0.0c
Age (years)b 64.4 (5.6) 64.5 (5.4) 0.526 2.0c 63.9 (5.7) 63.9 (5.8) 0.382 0.9c 63.3 (6.8) 63.3 (6.5) 0.726 0.5c
BMI 23.5 (3.2) 24.1 (3.4) <0.001 -19.3 22.1 (2.8) 22.7 (2.9) <0.001 -20.2 22.3 (3.1) 22.7 (3.1) <0.001 -12.3 WC 84.4 (8.5) 85.9 (9.0) <0.001 -17.1 80.8 (8.5) 82.2 (8.6) <0.001 -15.6 80.9 (9.0) 82.1 (8.8) <0.001 -13.2
ABSI 0.0817
(0.0048)
0.0818 (0.0048)
0.217 -4.0 0.0816 (0.0053)
0.0816 (0.0052)
0.713 0.6 0.0812 (0.0052) 0.0815 (0.0051) 0.002 -5.0 Diabetes categorya
Normal 89.3 43.5 <0.001 90.5 83.4 83.1 0.817 0.8c 83.2 83.3 0.235 -0.2c
Borderline 10.7 56.6 -64.4 9.3 9.3 -0.1c 9.0 9.3 -0.2c
Diabetes - - 7.4 7.6 -0.3c 7.7 7.4 0.3c
SBP (mmHg)
134 (17) 133 (16) 0.490 2.1c 118 (11) 126 (9) <0.001 -78.2 129 (17) 129 (17) 0.958 -0.1c
DBP (mmHg)
79 (11) 79 (10) 0.983 -0.1c 71 (8) 76 (8) <0.001 -56.6 77 (11) 77 (11) 0.944 0.1c
LDL-C (mg/dl)
128 (32) 128 (32) 0.664 1.4c 129 (31) 129 (31) 0.498 1.1c 107 (19) 122 (15) <0.001 -88.0
Log HDL-C 4.06 (0.26) 4.06 (0.26) 0.988 0.0c 4.14 (0.26) 4.14 (0.27) 0.545 0.9c 4.21 (0.24) 4.12 (0.25) <0.001 36.5
Log AST 3.18 (0.34) 3.19 (0.35) 0.307 -3.0c 3.13 (0.29) 3.13 (0.30) 0.788 -0.4c 3.12 (0.30) 3.12 (0.30) 0.463 1.2c
Log ALT 3.14 (0.48) 3.15 (0.50) 0.357 -2.3c 2.97 (0.44) 2.98 (0.45) 0.756 -0.5c 2.95 (0.43) 2.95 (0.45) 0.721 0.6c
Log GGT 3.55 (0.72) 3.54 (0.71) 0.936 0.2c 3.27 (0.63) 3.28 (0.65) 0.503 -0.9c 3.28 (0.69) 3.28 (0.68) 0.868 0.3c Smoking
habita
19.0 19.3 0.798 -0.3c 14.0 13.9 0.843 0.1c 14.0 13.7 0.701 0.2c
SD, standardized difference; SBP, systolic blood pressure; DBP, diastolic blood pressure; LDL-C, low-density lipoprotein cholesterol; HDL-C, high-density lipoprotein cholesterol; AST, aspartate aminotransferase; ALT, alanine aminotransferase; GGT, gamma-glutamyltransferase
aPercentage and p-value by McNemar ’s test
bMean (standard deviation) and p-value by paired t-test cThese variables were used for calculating the propensity score
Supporting Information
S1 Table. Baseline characteristics of retained subjects and dropouts during follow-up. (DOCX)
Acknowledgments
This study was supported by a grant for MEXT KAKENHI Grant Number 26460826, Joint Re-search Projects between Chiba City and Universities, 2013, and Grants from Chiba Foundation Health Promotion & Disease Prevention.
We greatly appreciate the invaluable help and support from staff of Chiba City Hall, Toshie Kakinuma, Yoshio Sato, Takayo Horinoguchi, Takao Imazeki, Takehumi Fujiyama, and Take-humi Kajiwara, who provided all data analyzed in this study.
Table 6. Associations between disease incidence (diabetes, hypertension, and dyslipidemia) and Z-scores for BMI, WC, and ABSI as revealed by conditional logistic regression analysis of case-matched subsets obtained by propensity score matching.
OR (95% CI) p-value for OR AIC AUC (95% CI) p-value for AUC1
Diabetes
Without BMI adjustment
BMI 1.20 (1.13−1.28) <0.001 2666 0.5549 (0.5369−0.5729) 0.002
WC 1.18 (1.11−1.26) <0.001 2676 0.5456 (0.5275−0.5636) <0.001
ABSI 1.03 (0.96−1.10) 0.385 2700 0.5098 (0.4917−0.5280) reference
With BMI adjustment2
WC 1.02 (0.91−1.15) 0.680 2668 0.5546 (0.5366−0.5726) 0.682
ABSI 1.05 (0.98−1.12) 0.134 2666 0.5554 (0.5374−0.5734) reference
Hypertension
Without BMI adjustment
BMI 1.26 (1.21−1.31) <0.001 9512 0.5567 (0.5472−0.5662) <0.001
WC 1.18 (1.14−1.23) <0.001 9570 0.5419 (0.5323−0.5514) <0.001
ABSI 0.99 (0.96−1.03) 0.713 9653 0.5025 (0.4929−0.5121) reference
With BMI adjustment2
WC 0.99 (0.94−1.05) 0.830 9514 0.5567 (0.5472−0.5663) 0.500
ABSI 1.00 (0.97−1.03) 0.995 9514 0.5567 (0.5472−0.5662) reference
Dyslipidemia
Without BMI adjustment
BMI 1.14 (1.10−1.18) <0.001 10015 0.5386 (0.5293−0.5480) 0.001
WC 1.15 (1.11−1.19) <0.001 10006 0.5391 (0.5298−0.5485) <0.001
ABSI 1.05 (1.02−1.09) 0.003 10062 0.5150 (0.5056−0.5244) reference
With BMI adjustment2
WC 1.11 (1.04−1.17) 0.001 10005 0.5409 (0.5315−0.5503) 0.600
ABSI 1.06 (1.02−1.09) 0.001 10006 0.5412 (0.5318−0.5506) reference
OR, odds ratio; CI, confidence interval; ABSI, a body shape index; WC, waist circumference; BMI, body mass index; AIC, Akaike’s information criterion; AUC, area under the curve
1p-value with Bonferroni
’s correction
2Adjusted for BMI
Author Contributions
Conceived and designed the experiments: MF YS KN. Performed the experiments: MF AH. Analyzed the data: MF. Contributed reagents/materials/analysis tools: YS KN ST. Wrote the paper: MF YS KN ST AH. Data acquisition: MF AH. Data interpretation: YS KN ST. Supervi-sion or mentorship: AH.
References
1. Berrington de Gonzalez A, Hartge P, Cerhan JR, Flint AJ, Hannan L, Maclnnis RJ, et al. (2010) Body-mass index and mortality among 1.46 million white adults. N Engl J Med 363: 2211–2219. doi:10. 1056/NEJMoa1000367PMID:21121834
2. Flegal KM, Kit BK, Orpana H, Graubard BI (2013) Association of all-cause mortality with overweight and obesity using standard body mass index categories: a systematic review and meta-analysis. JAMA 309: 71–82. doi:10.1001/jama.2012.113905PMID:23280227
3. Jiang J, Ahn J, Huang WY, Hayes RB (2013) Association of obesity with cardiovascular disease mortal-ity in the PLCO trial. Prev Med 57: 60–64. doi:10.1016/j.ypmed.2013.04.014PMID:23632233
4. Fujita M, Ueno K, Hata A (2009) Effect of obesity on incidence of type 2 diabetes declines with age among Japanese women. Exp Biol Med 234: 750–757. doi:10.3181/0810-RM-292PMID:19429850
5. Ishikawa-Takata K, Ohta T, Moritaki K, Gotou T, Inoue S (2002) Obesity, weight change and risks for hypertension, diabetes and hypercholesterolemia in Japanese men. Eur J Clin Nutr 56: 601–607. PMID:12080398
6. Pereira M, Lunet N, Paulo C, Severo M, Azevedo A, Barros H (2012) Incidence of hypertension in a pro-spective cohort study of adults from Porto, Portugal. BMC Cardiovasc Disord 12: 114. doi:10.1186/ 1471-2261-12-114PMID:23190867
7. Nevill AM, Stewart AD, Olds T, Holder R (2006) Relationship between adiposity and body size reveals limitations of BMI. Am J Phys Anthropol 129: 151–156. PMID:16270304
8. Gómez-Ambrosi J, Silva C, Galofré JC, Escalada J, Santos S, Millán D, et al. (2012) Body mass index classification misses subjects with increased cardiometabolic risk factors related to elevated adiposity. Int J Obes 36: 286–294. doi:10.1038/ijo.2011.100PMID:21587201
9. Ruhl CE, Everhart JE (2010) Trunk fat is associated with increased serum levels of alanine aminotrans-ferase in the United States. Gastroenterology 138: 1346–1356. doi:10.1053/j.gastro.2009.12.053 PMID:20060831
10. Czernichow S, Kengne AP, Stamatakis E, Hamer M, Batty GD (2011) Body mass index, waist circum-ference and waist-hip ratio: which is the better discriminator of cardiovascular disease mortality risk?: evidence from an individual-participant meta-analysis of 82 864 participants from nine cohort studies. Obes Rev 12: 680–687. doi:10.1111/j.1467-789X.2011.00879.xPMID:21521449
11. Welborn TA, Dhaliwal SS (2007) Preferred clinical measures of central obesity for predicting mortality. Eur J Clin Nutr 61: 1373–1379. PMID:17299478
12. Moore SC (2009) Waist versus weight: which matters more for mortality? Am J Clin Nutr 89: 1003–
1004. doi:10.3945/ajcn.2009.27598PMID:19244373
13. Krakauer NY, Krakauer JC (2012) A new body shape index predicts mortality hazard independently of body mass index. PLoS One 7: e39504. doi:10.1371/journal.pone.0039504PMID:22815707
14. Song X, Jousilahti P, Stehouwer CD, Söderberg S, Onat A, Laatikainen T, et al. (2013) Comparison of various surrogate obesity indicators as predictors of cardiovascular mortality in four European popula-tions. Eur J Clin Nutr 23: 1298–1302.
15. Krakauer NY, Krakauer JC (2014) Dynamic association of mortality hazard with body shape. PLoS One. 9: e88793. doi:10.1371/journal.pone.0088793PMID:24586394
16. Afsar B, Elsurer R, Kirkpantur A (2013) Body shape index and mortality in hemodialysis patients. Nutri-tion 29: 1214–1218. doi:10.1016/j.nut.2013.03.012PMID:23830741
17. Abete I, Arriola L, Etxezarreta N, Mozo I, Moreno-Iribas C, Amiano P, et al. (2014) Association between different obesity measures and the risk of stroke in the EPIC Spanish cohort. Eur J Nutr. in press. Avail-able:http://link.springer.com/article/10.1007%2Fs00394-014-0716-x. Accessed 27 August 2014.
18. He S, Chen X (2013) Could the new body shape index predict the new onset of diabetes mellitus in the Chinese population? PLoS One 8: e50573. doi:10.1371/journal.pone.0050573PMID:23382801
20. Seino Y, Nanjo K, Tajima N, Kadowaki T, Kashiwagi A, Araki E, et al. The Committee of the Japan Dia-betes Society on the diagnostic criteria of diaDia-betes mellitus. (2010) Report of the Committee on the classification and diagnostic criteria of diabetes mellitus. Diabetol Int 1: 2–20.
21. The Japanese Society of Hypertension (2009) Guideline for the management of hypertension 2009 (Japanese). Tokyo: Life Science Publishing Co., Ltd.
22. Committee for Epidemiology and Clinical Management of Atherosclerosis (2013) Executive summary of the Japan Atherosclerosis Society (JAS) guidelines for the diagnosis and prevention of atherosclerot-ic cardiovascular diseases in Japan -2012 version. J Atheroscler Thromb 20: 517–523. PMID: 23665881
23. Dongsheng Y, Jarrod ED. A unified approach to measuring the effect size between two groups using SAS. Available:http://support.sas.com/resources/papers/proceedings12/335-2012.pdf#search=% 27aunified+approach+to+measuring+effect+size+sas%27. Accessed 09 July 2014.
24. Parsons LS, Ovation Research Group. Reducing bias in a propensity score matches-pair sample using greedy matching techniques. Available:http://www2.sas.com/proceedings/sugi26/p214-26.
pdf#search=%27reducing+bias+in+propensity+score+matched+pair+greedy+matching%27. Ac-cessed 09 July 2014.
25. Bays HE, Chapman RH, Grandy S; SHIELD Investigators' Group (2007) The relationship of body mass index to diabetes mellitus, hypertension and dyslipidaemia: comparison of data from two national sur-veys. Int J Clin Pract 61: 737–747. PMID:17493087
26. Schmiegelow MD, Andersson C, Køber L, Andersen SS, Norgaard ML, Jensen TB, et al. (2014) Associ-ations between body mass index and development of metabolic disorders in fertile women—a nation-wide cohort study. J Am Heart Assoc 10; doi:10.1161/JAHA.113.000672
27. World Health Organization. World Health Statistics 2013.http://www.who.int/gho/publications/world_ health_statistics/2013/en/. Accessed 3 April 2013
28. Kodama K, Tojjar D, Yamada S, Toda K, Patel CJ, Butte AJ (2013) Ethnic differences in the relationship between insulin sensitivity and insulin response: a systematic review and meta-analysis. Diabetes Care 36: 1789–1796. doi:10.2337/dc12-1235PMID:23704681
29. Oka R, Miura K, Sakurai M, Nakamura K, Yagi K, Miyamoto S, et al. (2010) Impacts of visceral adipose tissue and subcutaneous adipose tissue on metabolic risk factors in middle-aged Japanese. Obesity 18:153–160. doi:10.1038/oby.2009.180PMID:19498348