CORRELATION BETWEEN THE HEARING LOSS
CLASSIFICATIONS AND SPEECH RECOGNITION
Correlação entre as classiicações de perdas auditivas
e o reconhecimento de fala
Willian Toledo dos Anjos(1), LudimilaLabanca(2), Luciana Macedo de Resende(3),
Letícia Pimenta Costa-Guarisco(4)
(1) Federal University of Minas Gerais – UFMG, Belo
Hori-zonte, MG, Brazil.
(2) Federal University of Minas Gerais – UFMG, Belo
Hori-zonte, MG, Brazil.
(3) Speech-language pathology and Audiology, Federal
Uni-versity of Minas Gerais – UFMG, Belo Horizonte, MG, Brazil.
(4) Speech-language pathology and Audiology, Federal
Uni-versity of Minas Gerais – UFMG, Belo Horizonte, MG, Brazil.
Conlict of interest: non-existent
Those aflicted by hearing impairments tend to avoid contact, develop low self-esteem, have few friends and limited participation in social relations3.
Ski slope sensorineural hearing loss is the most common type to be found in clinical audiology practice; it includes presbycusis and is frequently related to dificulties in speech intelligibility4-6. The
frequencies 500 Hz, 1000 Hz and 2000 Hz are considered to be the most relevant for speech. Vowels and consonants, the building blocks of
speech, have different spectral characteristics.
Vowels are naturally more intense and carry acoustic energy at low frequencies (400–500 Hz), which are favored by the range of human audibility7.
Consonants, in turn, are sounds having spectral
energy at high frequencies, above 2000 Hz, albeit 20–35 dB weaker than vowels8. However, speech
intelligibility depends on consonant sounds, which INTRODUCTION
Speech discrimination is essential for human communication and, in order for it to be effective, unimpaired hearing is critical. Hearing losses negatively impact the quality of life by restricting social interactions, especially in noisy environments1,2.
ABSTRACT
Purpose: to check the correlation between Speech Reception Threshold and Index of Speech
Recognition with mean audiometric results. Methods: we selected 241elderly patients who underwent
examinations of the pure tone audiometry and speech audiometry. As inclusion, audiometry should have a sensorineural hearing loss. The tone thresholds for air obtained were classiied according with the following averages: Average 1 – Average of frequencies of 500, 1000 and 2000 Hz; Average 2 – Average of frequencies of 500, 1000, 2000 and 4000 Hz; Average 3 – average of frequencies of 500, 1000, 2000 and 3000 Hz; and 4 average – average of frequencies of 500, 1000, 2000, 3000 and 4000 Hz. The data were compared with Speech Reception Threshold and Index of Speech
Recognition, and treated statistically. Results: Average 1 showed higher correlation with the Speech
Reception Threshold (rho = 0.934, CI = 0.901 to 0.958; eqm = 52.2). In relation to the Index of Speech Recognition, it was observed that the average 3 showed the highest degree of correlation with the test (rho = – 0.768, CI = –0.807 to –0.721; eqm = 245) followed averages 2 and 4. Conclusion: for elderly people with ski slop sensorineural hearing loss, the Speech Reception Threshold has the strongest
correlation with the average frequencies 500 Hz, 1000 Hz and 2000 Hz, while the Index of Speech Recognition has the highest correlation with the average which include the frequencies 3000 Hz and
4000 Hz.
correlation with the speech recognition threshold
(SRT) and with the speech discrimination score
(SDS).
METHODS
The present study was approved by the Research Ethics Committee of the Federal University of Minas Gerais (UFMG) under protocol no. 155 09. An informed consent form was prepared explaining the theme of the study, its aims and the importance of analyzing the audiometric tests of the individuals
selected for the study.
This comparative study based on the results of audiometric tests was conducted with an elderly population who received care at the Instituto Jenny de Andrade Faria, an annex to the UFMG Hospital
das Clínicas.
The study employed a convenience sample of all the elderly individuals with a complaint of hearing loss who underwent audiometric evaluation with measurements of pure-tone hearing thresholds for air and bone conduction and speech audiometry consisting of the SRT and SDS tests between April 2011–April 2012. Some exclusion criteria were established: individuals with mixed or conductive hearing loss in at least one ear, or incomplete/
inconclusive tests, e.g, when pure-tone thresholds
over the frequencies of 500 Hz to 4000 Hz were not obtained or speech audiometry was not performed.
In total, 241 tests were analyzed: 153 (63.5%) of female patients and 88 (36.5%) of male patients. Ages ranged from 60 to 97 years (mean, 77.9 years).
The results of 482 ears were evaluated.
The present study examined the pure-tone hearing thresholds for air conduction obtained through the analysis of pure-tone audiometry based
on the following averages:
• Average 1: tritone average of frequencies 500
Hz, 1000 Hz and 2000 Hz according to Davis
and Silverman, 197011 and Lloyd and Kaplan,
197812;
• Average 2: pure-tone average of frequencies 500
Hz, 1000 Hz, 2000 Hz and 4000 Hz according
to Recommendation 02/1 of the Bureau
Internacional d’Audiophonologie (BIAP)15;
• Average 3: pure-tone average of frequencies
500 Hz, 1000 Hz, 2000 Hz and 3000 Hz, and
• Average 4: pure-tone average of frequencies
500 Hz, 1000 Hz, 2000 Hz, 3000 Hz and 4000
Hz.
The data were treated statistically using the R
software. Distribution of frequencies was performed for the categorical variable (sex). For the continuous variables (age, frequencies, SRT and SDS), measures of central tendency (mean and median) contribute 60 % of it, while vowels contribute only
40%9. Due to the spectral characteristics of these
sounds and the range of human audibility, one can
understand why individuals with hearing loss at high
frequencies have impaired speech recognition. In audiology, speech recognition ability is measured by the tests Speech Reception Threshold
(SRT) and Speech Discrimination Score (SDS). The SRT corresponds to the softest sound intensity
level at which an individual can recognize 50% of the common words given. Typically, SRT and
SDS values are consistent with the average of the
hearing thresholds obtained for the speech-related frequencies. The SDS evaluates speech discrimi
-nation using a list of monosyllables and bisyllables 40 dB above the SRT thresholds10.
The classiication of hearing losses is a widely
discussed topic in speech-language pathology
and audiology. In Brazil, hearing losses have been predominantly classiied on the basis of the frequencies of speech relative to the tritone average of the air-conduction thresholds for 500 Hz, 1000
Hz and 2000 Hz11,12. However, a number of authors
have advocated the use of hearing loss classiica
-tions by frequency ranges in order to include the high frequencies in composing these averages,
especially for elderly individuals13,14.
The Bureau Internacional d’ Audiophonologie
(BIAP, 2005) recommended that the classiication of
hearing losses should take into account the averages of the pure-tone thresholds for air conduction at
500 Hz, 1000 Hz, 2000 Hz and 4000 Hz in order to encompass the high frequencies, as these are the most compromised in the pathologies of hearing15.
Because the frequency ranges of consonants above 2000 Hz are the chief constituents of speech intelligibility, Russo proposed, in 2009, that the degree of hearing loss should be classiied based on the average audibility threshold obtained over the frequencies of 500 Hz to 4000 Hz13.
The classiications of hearing losses relying on the tritone average as suggested by Lloyd & Kaplan
(1978)12 and Davis & Siverman (1970)11 were found
to be adequate to classify the hearing losses with a lat audiometric coniguration. However, in ski slope hearing losses, such as presbycusis, this classi
-ication is not always consistent with the patients’ complaints, as these refer to dificulties in speech recognition, mostly.
Given that the major auditory function concerns verbal communication and speech recognition abilities, it is paramount that the speech tests be considered in the classiication of hearing losses, thus expressing the actual hearing impairment of the patients. The aim of the present study was to
coeficient of correlation, i.e., the greater the corre -lation, the lower the MSE (lower prediction error);
consequently, the better the variable as a predictor. To ascertain whether the correlations obtained were statistically different, comparison of correla
-tions was the method adopted for hypothesis testing. The correlation values were compared both for the SRT and the SDS, and the results were obtained
using p-values, with statistical signiicance deined by p<0.05.
RESULTS
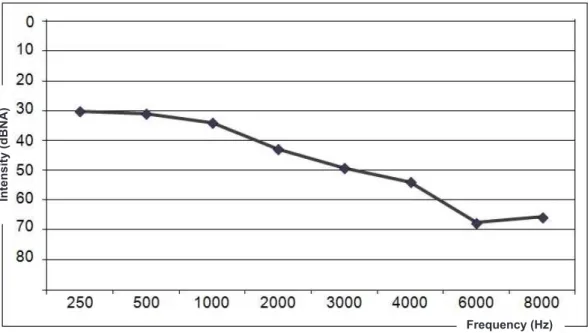
The mean values obtained in the audiologic evaluation of the 482 ears can be found in Figure 1. and variability (standard deviation, minimum and
maximum) were used.
The four averages and the individual frequencies 500 Hz, 1000 Hz, 2000 Hz, 3000 Hz and 4000 Hz
were correlated with the SRT and SDS values
obtained in the audiometric tests in order to assess which pure-tone average or individual frequency best represents speech recognition ability. To that end, Spearman’s coeficient of correlation was used, with a conidence interval of 95%. To determine
the strength of the correlation, the following
classiication scale was used16: 0–0.2: very poor
correlation; 0.21–0.4: poor correlation; 0.41–0.6:
moderate correlation; 0.61– 0.8: good correlation,
and 0.8 –1.0: very good correlation.
In addition, the mean squared error (MSE) was
calculated. The MSE is inversely related to the
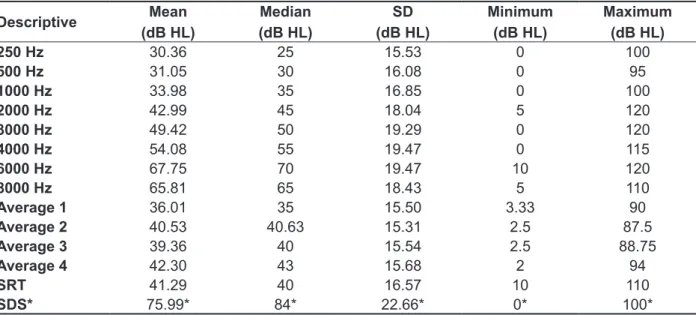
Table 1 shows the descriptive analysis of the threshold averages by frequency, the four calcu -lated pure-tone averages, the SRT in dBHL, and the SDS in percent values.
Correlations were established for the individual frequencies 500 Hz, 1000 Hz, 2000 Hz, 3000 Hz,
4000 Hz, Average 1, Average 2, Average 3 and
Average 4 with the SRT and SDS. In addition, conidence intervals and mean squared errors were
calculated, which served to identify the analyses with the highest predictive value for the SRT and
SDS. The results can be seen in Table 2.
Figure 1 – Means for the pure-tone thresholds by frequency of 482 ears
In
te
n
s
ity
(d
B
N
A
)
Table 1 – Descriptive analysis of the pure-tone frequencies, calculated means, mean SRT and SDS in the study sample
Descriptive Mean
(dB HL)
Median (dB HL)
SD (dB HL)
Minimum (dB HL)
Maximum (dB HL)
250 Hz 30.36 25 15.53 0 100
500 Hz 31.05 30 16.08 0 95
1000 Hz 33.98 35 16.85 0 100
2000 Hz 42.99 45 18.04 5 120
3000 Hz 49.42 50 19.29 0 120
4000 Hz 54.08 55 19.47 0 115
6000 Hz 67.75 70 19.47 10 120
8000 Hz 65.81 65 18.43 5 110
Average 1 36.01 35 15.50 3.33 90
Average 2 40.53 40.63 15.31 2.5 87.5
Average 3 39.36 40 15.54 2.5 88.75
Average 4 42.30 43 15.68 2 94
SRT 41.29 40 16.57 10 110
SDS* 75.99* 84* 22.66* 0* 100*
* – values in %
Table 2 – Correlations of the individual frequencies 500 Hz, 1000 Hz, 2000 Hz, 3000 Hz and 4000 Hz, Average 1, Average 2, Average 3 and Average 4 with the SRT and the SDS
Variable
SRT SDS
Rho CI MSE
(dBHL2) Rho
CI MSE
(dBHL2)
CI.inf CI.up CI.inf CI.up
500 Hz 0.807* 0.765 0.844 108.4 -0.569 -0.634 -0.501 322.9
1000 Hz 0.889* 0.857 0.915 71.5 -0.675** -0.720 -0.620 284.2 2000 Hz 0.841* 0.800 0.875 88.8 -0.735** -0.778 -0.688 282.1 3000 Hz 0.700 0.633 0.752 138.2 -0.696** -0.745 -0.637 323.4 4000 Hz 0.636 0.574 0.691 162.4 -0.653** -0.706 -0.589 348.1 Average 1 0.934* 0.901 0.958 52.2+ -0.734** -0.776 -0.683 251.6
Average 2 0.918* 0.887 0.941 59.0 -0.768** -0.811 -0.720 245.3 Average 3 0.922* 0.886 0.944 56.4 -0.768** -0.807 -0.721 245.0+
Average 4 0.895* 0.861 0.921 68.7 -0.773** -0.813 -0.725 251.2
Average 1- mean of frequencies 500 Hz, 1000 Hz and 2000 Hz
Average 2- mean of frequencies 500 Hz, 1000 Hz, 2000 Hz and 4000 Hz Average 3- mean of frequencies 500 Hz, 1000 Hz, 2000 Hz and 3000 Hz
Average 4- mean of frequencies 500 Hz, 1000 Hz, 2000 Hz, 3000 Hz and 4000 Hz Rho- Spearman’s coeficient of correlation
MSE- Mean Squared Error
SRT- Speech Reception Threshold
SDS- Speech Discrimination Score CI- Conidence Interval
CI inf- lower limit of Conidence Interval CI up- upper limit of Conidence Interval *very good correlation
**good correlation
+best variable as a predictor of correlation
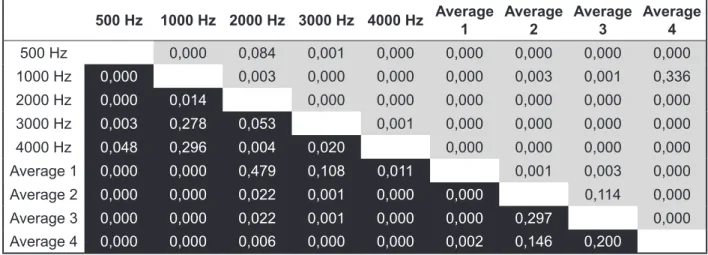
to assess whether the correlations found in Table 2 are statistically different, both for the SRT and SDS. In Figure 2, a matrix with hypothesis testing
p-values is presented. Using that matrix, it is possible
500 Hz 1000 Hz 2000 Hz 3000 Hz 4000 Hz Average 1
Average 2
Average 3
Average 4
500 Hz 0,000 0,084 0,001 0,000 0,000 0,000 0,000 0,000
1000 Hz 0,000 0,003 0,000 0,000 0,000 0,003 0,001 0,336 2000 Hz 0,000 0,014 0,000 0,000 0,000 0,000 0,000 0,000 3000 Hz 0,003 0,278 0,053 0,001 0,000 0,000 0,000 0,000 4000 Hz 0,048 0,296 0,004 0,020 0,000 0,000 0,000 0,000 Average 1 0,000 0,000 0,479 0,108 0,011 0,001 0,003 0,000 Average 2 0,000 0,000 0,022 0,001 0,000 0,000 0,114 0,000 Average 3 0,000 0,000 0,022 0,001 0,000 0,000 0,297 0,000 Average 4 0,000 0,000 0,006 0,000 0,000 0,002 0,146 0,200
- p-value for the SDS - p-value for the SRT
Average 1- mean of frequencies 500 Hz, 1000 Hz and 2000 Hz.
Average 2- mean of frequencies 500 Hz, 1000 Hz, 2000 Hz and 4000 Hz. Average 3- mean of frequencies 500 Hz, 1000 Hz, 2000 Hz and 3000 Hz.
Average 4- mean of frequencies 500 Hz, 1000 Hz, 2000 Hz, 3000 Hz and 4000 Hz. Hypothesis testing of the equality of the correlations of Spearman’s coeficient of correlation. Level of signiicance: p<0.05.
Figure 2 – Correlation matrix with hypothesis testing p-values comparing the signiicance of the correlations for the SRT and SDS
DISCUSSION
The aim of the present study was to identify which
pure-tone average has the greatest correlation with speech recognition. To that end, the pure-tone
thresholds for air conduction were classiied using four different averages: Average 1 (500 Hz, 1000 Hz and 2000 Hz), average 2 (500 Hz, 1000 Hz, 2000 Hz and 4000 Hz), average 3 (500 Hz, 1000 Hz, 2000 Hz and 3000 Hz) and average 4 (500 Hz,
1000 Hz, 2000 Hz, 3000 Hz and 4000 Hz). These averages were correlated with the tests of speech
recognition, SRT and SDS, obtained in the audio -logic evaluation.
The curve depicted in Fig. 1, which shows the average pure-tone thresholds of all the study patients
by frequency, is similar to a typical audiogram of elderly individuals, as expected. In this population, a ski slope coniguration is commonly found, with a high-frequency hearing loss and preserved
low-pitch sensitivity14,17-20. Presbyacusis is deined
as a bilateral sensorineural hearing loss that is more pronounced for high-pitched sounds due to
the degenerative and physiologic changes in the
auditory system that arise with aging17,21. In elderly
individuals with presbyacusis, the apical coil of the cochlea, responsible for the detection of low-pitched sounds, is more preserved compared with the basal
coil, which detects the high-pitched sounds17.
Regarding speech discrimination, Table 1 shows that the mean for the SDS was 75.99%, which was expected for elderly patients22-26. Studies suggest
that the dificulty in speech comprehension, demon
-strated by the lower SDS, occurs as a result of the
structural and physiologic changes in the auditory
system with aging22,23.
Table 2 shows the correlation values for the individual frequencies 500 Hz, 1000 Hz, 2000
Hz, 3000 Hz and 4000 Hz, Average 1, Average 2, Average 3 and Average 4 with the SRT and SDS. Although all the averages showed very good corre-lation, it was found that Average 1 had greater correlation with the SRT (0.934). For that reason,
Average 1 was considered to be the most adequate estimator of the threshold of speech recognition16.
This fact was corroborated by the mean squared
error found in the correlation of Average 1 with the
are more frequent in the patient’s vocabulary, which
increases redundancy and the chances of correct
guesses. This makes guessing with the SRT test
easier than with the SDS.
A recent study compared the audiologic perfor
-mance of elderly individuals based on the classii
-cations of Davis and Silverman, 197011 and on the
Recommendation 02/1 of the Bureau Internacional
d’Audiophonologie (BIAP)15. The authors reviewed
the records of 140 elderly individuals focusing on
the clinical history and the pure-tone audiometry results. Predominance of mild to moderate sensori -neural hearing loss was found, with slight differences regarding its prevalence depending on the hearing
loss classiication adopted. Based on Davis and Silverman, 99 cases of ears with normal thresholds were found, while only 66 cases were identiied
according to the BIAP recommendation. The study concluded that the classiications achieved similar
results; however, the BIAP recommendation was found to be more sensitive in detecting hearing
losses in the elderly27. A study conducted in Finland
with 5400 volunteers aged 55–75 years demon
-strated a remarkable difference between the hearing loss classiication by the World Health Organization (WHO) criteria compared with the European Union criteria. In that study, the percentage of individuals with normal hearing was greater when the WHO classiication was used28.
The results of the analyses enabled us to conclude that speech discrimination as measured by the SDS is inluenced by the frequencies 3000 Hz and 4000 Hz. For that reason, the importance of including these frequencies in the pure-tone
average used for classifying the hearing loss
should be emphasized, since one of the objectives of this classiication is to relect a person’s hearing abilities and dificulties especially with regard to communication.
CONCLUSION
For the elderly population with ski slope
senso-rineural hearing loss, the SRT is more strongly correlated with the average of frequencies 500
Hz, 1000 Hz and 2000 Hz, while the SDS shows greater correlation with the average that includes
frequencies 3000 Hz and 4000 Hz. prediction error of Average 1 relative to the SRT. In
other words, Average 1 is the best predictor of SRT
values. Additionally, Fig. 2 shows that the correlation
of SRT and Average 1 differs statistically from the correlations between SRT and the other averages. This proves that, even with such narrow conidence intervals (Table 2), the correlation of Average 1 with the SRT can be regarded as the strongest. Thus, this result indicates that the averages of 500 Hz, 1000 Hz and 2000 Hz used to compose Average 1 are key frequencies to estimating the SRT. This fact can be conirmed by the analysis of the individual frequencies in Table 2.
The correlation values for the SDS are negative, since they are inversely proportional: as averages increase, SDS percentages decline. All the averages had good correlation with the SDS, with statisti-cally superior correlation values for Averages 2, 3
and 4 (Table 2 and Fig. 2). As Fig. 2 illustrates, the correlation between Average 1 and the SDS, albeit good, is statistically inferior. On the other hand, no statistically signiicant difference was found when comparing the correlations between Averages 2 and 3; 2 and 4, and 3 and 4. This inding indicates
that the correlations of the SDS and Averages
2, 3 and 4, in addition to being superior, are also quite similar; therefore, it is impossible to infer which of these three averages is the best predictor.
Nevertheless, these results allow us to conclude
that the frequencies 3000 Hz and 4000 Hz are important for speech recognition, since the corre -lation of Average 1 was lower with the SDS, and
statistically different as compared with the other three averages. To corroborate these indings, the MSE (Table 2) was lower for Average 3, followed by Average 2—albeit with quite similar values. This shows that both averages, 2 and 3, have a greater predictive value regarding the SDS, i.e., the more severe the impairment at 3000 Hz and 4000 Hz, the worse the performance in the SDS test. This inding is explained in the literature7,9 which indicates that
60% of speech intelligibility relies on frequencies above 1000 Hz.
The contribution of high frequencies to speech recognition was more evident in the SDS than in the SRT. We believe this occurred because in the SDS
test, whose purpose is to assess the percentage of
speech recognition, one-syllable words are used,
as they provide fewer clues in speech and are less redundant, which reduces the likelihood of correct
guesses. In the SRT evaluation, the purpose is
to assess the threshold of speech recognition;
10. Redondo MC, Lopes Filho OC. Testes básicos
de avaliação auditiva. In: Lopes Filho OC. Tratado
de Fonoaudiologia. São Paulo: Roca; 1197. P. 83-108;
11. Davis H, Silverman RS. Auditory tests and hearing aids. New York: Holt Rinehart and Winston; 1970. Hearing handicap standards for
hearingandmedicolegalrules; p.253-79.
12. Lloyd L, Kaplan H. Audiometric interpretation: a
manual of basic audiometry: Press, 1978.
13. Russo ICP, Pereira LD, Carvallo RMM,
Anastasio ART. Encaminhamentos sobre a classiicação do grau de perda auditiva em nossa
realidade. RevSocBrasFonoaudiol [periódico
online]. 2009;14(2):287-8.Disponível em: http:// www.scielo.br/pdf/rsbf/v14n2/23.pdf.
14. Baraldi GS, Almeida LC, Borges AC. Evolução
da perda auditiva no decorrer do envelhecimento. RevBrasOtorrinolaringol. 2007;73(1):64-70.
15. Bureau International d’ Audiophonologie (BIAP). [Les recommendations] [Internet]. Liège: BIAP; 2005. Recommendation BIAP nº 02/1bis. Classiication audiométrique des déiciencesauditives; [cited 2011 May 15]; p.5. Available from: http://www.biap.org/ recom02-1.htm. French;
16. Fonseca JS; Martins GA. Curso de Estatística. 6ª Edição. São Paulo: Atlas; 1996;
17. Corso JF. Presbycusis, hearing aids and aging. Audiology. 1977;16(2):146-63.
18. Melo ADP, Castiquini EAT, Noronha-Souza AEL.
Identiicação de perda auditiva nos alunos que REFERENCES
1. Magalhães ATM, Gómez MVSG. Speech
discrimination index in presbycusis. Arq. Int. Otorrinolaringol. 2007;11(2):169-74.
2. Veras RP, Mattos LC. Audiologia do
envelhecimento: revisão da literatura e perspectivas atuais. RevBrasOtorrinolaringol. 2007;73(1):128-34.
3. Francelin M, Motti TF G, Morita I. As implicações
sociais da deiciência auditiva adquirida em
adultos. Saude Soc. 2010;19(1):180-92.
4. Humes LE, Watson BU, Christensen LA, Cokely
CG, Halling DC, Lee L. Factors associated with
individual differences in clinical measures of speech recognition among the eldery. J. Speech Hear Res. 1992;37:465-74.
5. Jerger J, Jerger S, Pirozzolo F. Correlacional
analysis of speech audiometric scores, hearing loss, age and cognitive abilities in the elderly. Ear
Hear. 1991;12:103-8.
6. Solomon LN, Webster JC, Curtis JF. A factorial study of speech perception. J. Speech Hear. Res.
1960;37:655-61.
7. Russo ICP, Behlau M. Percepção da fala: análise
acústica do português brasileiro. São Paulo: Lovise;
1993.
8. Miller GA, Nicely PE. An analysis of perceptual
confusions among some English consonants. J.Acoust.Soc.Am. 1955;27(2):338-14.
9. Fletcher H. Speech and hearing communication.
New Jersey: D.VanNostrand; 1953.
RESUMO
Objetivo: veriicar quais médias tonais possuem maior correlação com o Limiar de Recepção da Fala
e com o Índice de Reconhecimento da Fala. Métodos: foram selecionados 241 exames de pacientes
idosos com perda auditiva neurossensorial que realizaram audiometria tonal liminar e logoaudiome
-tria. As avaliações audiométricas foram classiicados com base nos limiares tonais de via aérea das seguinte formas: Média 1- Média das frequências de 500, 1000 e 2000 Hz; Média2-Média das frequ
-ências de 500, 1000, 2000 e 4000 Hz; Média 3 – Média das frequ-ências de 500, 1000, 2000 e 3000 Hz e Média 4 –Média das frequências de 500, 1000, 2000, 3000 e 4000 Hz. Os dados foram comparados com os testesLimiar de Recepção da Fala e Índice de Reconhecimento da Fala e tratados estatistica
-mente. Resultados: a Média 1 apresentou maior valor de correlação com o Limiar de Recepção da
Fala (rho=0,934; IC=0,901 a 0,958; eqm=52,2). Em relação ao Índice de Reconhecimento da Fala, foi observado que amédia 3 apresentou omaior grau de correlação com o teste(rho= – 0,768; IC= –0,807 a –0,721; eqm = 245) seguido das médias 2 e 4. Conclusão: para a população idosa com perda audi
-tiva neurossensorial descendente, o Limiar de Recepção de Fala possui correlação mais forte com a média das frequências 500 Hz, 1000 Hz e 2000 Hz, enquanto o Índice de Reconhecimento de Fala possui maior correlação com as média que incluem as frequências de 3000 Hz e 4000 Hz.
24. Studebaker GA, Sherbecoe RL, McDaniel DM,
Gwaltney CA. Monosyllabic word recognition at higher-than-normal speech and noise levels. J. Acoust. Soc. Am. 1999;105(4):2431-44.
25. Martini A, Mazzoli M, Rosignoli M, Trevisi P, Maggi S, Enzi G, et al. Hearing in the elderly: a
population study. Audiology. 2001;40(6):285-93.
26. Kano CE, Mezzena LH, Guida HL. Estudo
comparativo da classiicação do grau de perda auditiva em idosos institucionalizados. Rev CEFAC.
2009;11(3):473-7.
27. Tenório JP, Guimarães JATL, Flores NGC, Iório
MCM. Comparação entre critérios de classiicação dos achados audiométricos em idosos. J. Soc. Bras.
Fonoaudiol. 2011;23(2):114-8.
28. Uimonen S, Maki-Torkko E, Jounio-Ervasti
K, Sorri M. Hearing in 55 to 75 year old people in northern Finland-a comparison of two classiications of hearing impairment. Acta Otolaryngol. 1997;33:53-9.
frequentam a Universidade Aberta à Terceira Idade.
Salusvita. 2004;23(2):279-90.
19. Mattos LC, Veras RP. A prevalência da perda
auditiva em uma popu lação de idosos da cidade do Rio de Janeiro: um estudo seccional. Braz J Otorhinolaryngol. 2007;73(5):654-9.
20. Russo ICP. Achados audiométricos em uma
população de idosos presbiacúsicos brasileiros em função do sexo e da faixa etária. Pró-Fono R Atual Cient. 1993;5(1):8-10.
21. Pedalini M, Liberman P, Piranas S, Jacob W,
Câmara J, Miniti A Análise do peril audiológico de idosos através de testes de função auditiva periférica e central. Rev Soc Bras Fonoaudiol. 1997;5(63):489-95.
22. Felder E, Schrott, EA. Quantitative evaluation
of myelinated nerve ibres and hair cells in cochlea of humans with age-related high-tone hearing loss. Hear. Res. 1995;91:19-32.
23. Fish I. The selective and differential vulnerability
of the auditory system. In: Wolstenholmeand GEW,
Knight J (eds). Sensorioneural Hearing Loss. New York, Churchill-Livingstone, 1970.
Received on: October 08, 2012
Accepted on: July 26, 2013
Mailing address:
Letícia Pimenta Costa Guarisco
Rua Ouro Preto, 1275/ 04, Santo Agostinho
Belo Horizonte – MG – Brasil CEP: 30170-041