Trends in the Prevalence of Morbid and
Severe Obesity in Australian Children Aged
7-15 Years, 1985-2012
Sarah P. Garnett1,2*, Louise A. Baur2,3, Aimee M. D. Jones1, Louise L. Hardy3
1Institute of Endocrinology and Diabetes and Kids Research Institute at the Children's Hospital at
Westmead, Sydney, Australia,2The Children's Hospital at Westmead Clinical School, University of Sydney, Sydney, NSW, Australia,3Prevention Research Collaboration, School of Public Health, University of Sydney, Sydney, NSW, Australia
*sarah.garnett@health.nsw.gov.au
Abstract
Objective
Children with severe obesity have greater risk of adverse health outcomes. The purpose of this study was to assess trends in the prevalence of morbid and severe obesity in Australian children between 1985 and 2012.
Methods
Secondary analysis of four national Australian cross-sectional surveys of measured height/ weight in 7–15 year olds: Australian Health and Fitness Survey 1985 (n = 8,486), National Nutrition Survey 1995 (n = 1,541), the National Children’s Nutrition and Physical Activity Survey 2007 (n = 2,585) and the National Health Survey 2012 (n = 2,940). International Obesity Taskforce cut-point was used for morbid obesity (equivalent to a BMI35kg/m2at age 18 years). Severe obesity class 2 was defined as BMI120% and<140% of the 95th
percentile of the CDC 2000 growth charts or a BMI35 and<40, and severe obesity class
3 as BMI140% of the 95th percentile or a BMI40.
Results
Between 1985 and 2012 the prevalence of morbid obesity increased from 0.2% to 1.8%, class 2 severe obesity from 0.3% to 2.0%, and class 3 from 0.1% to 0.5%. Children with morbid obesity represented 11.3% of children with obesity in 1985 and increased to 22.5% in 2012 (P = 0.005). Children with severe obesity represented 19.3% of children with obesity in 1985 and increased to 32.0% in 2012 (P = 0.016). The greatest increase was observed between 1995 and 2007. The proportion of children who were classified as morbidly or severely obese was not significantly different between 2007 and 2012, nor was it signifi-cantly different between age and sex groups.
a11111
OPEN ACCESS
Citation:Garnett SP, Baur LA, Jones AMD, Hardy LL (2016) Trends in the Prevalence of Morbid and Severe Obesity in Australian Children Aged 7-15 Years, 1985-2012. PLoS ONE 11(5): e0154879. doi:10.1371/journal.pone.0154879
Editor:Fakir M Amirul Islam, Swinburne University of Technology, AUSTRALIA
Received:September 8, 2015
Accepted:April 20, 2016
Published:May 12, 2016
Copyright:© 2016 Garnett et al. This is an open access article distributed under the terms of the
Creative Commons Attribution License, which permits unrestricted use, distribution, and reproduction in any medium, provided the original author and source are credited.
Conclusion
Prevalence of morbid and severe obesity among children is low, but has significantly increased between 1985 and 2012. In contrast to overweight and obese children, children with morbid obesity require tertiary intervention. Failure to treat these children will have sig-nificant implications for the individual child and community.
Introduction
Emerging evidence suggests that the increasing rates of obesity in children and adolescents, as measured by body mass index (BMI), may be slowing or even plateauing in several countries,
including Australia and the US [1]. However, there is concern that the BMI distribution curve
has shifted further to the right, indicating that the proportion of children with morbid obesity
(equivalent to age and sex adjusted BMI35 kg/m2 at 18 years [2] and severe obesity
(BMI120% of the 95th percentile or a BMI35 kg/m2 of CDC 2000 growth charts) is
increasing [3]. In the US, severe obesity is one of the fastest growing subcategories of obesity in
children age 2–19 years, with rates of severe obesity increasing from 4.7% to 8.0% between
1999/2000 and 2011/2012 [4]. Children with severe obesity have a greater risk of serious short
and long term cardiovascular, metabolic and other health consequences compared with
chil-dren and who are overweight or obese [3].
Monitoring trends in the severity of obesity is essential to predict the associated disease bur-den and inform options for intervention. The prevalence rates of morbid and severe obesity in Australian children have not been reported previously. The aim of this study was to report changes in morbid and severe obesity in Australian children age 7 to 15 years between 1985 and 2012.
Methods
Secondary data analysis of measured height and weight data of children age 7 to15 years from four Australian representative cross-sectional surveys: the Australian Health and Fitness
Sur-vey 1985 (AHF85) [5], the National Nutrition Survey 1995 (NNS95) [6], the 2007 Australian
National Children’s Nutrition and Physical Activity Survey (NCNPAS07) [7] and the
Austra-lian National Health Survey 2012 (NHS12) [8]. Details of AHF85, NNS95 and NCNPA07 have
been described previously in detail [9]. Briefly, the AHF85 was a national population survey
with measured height and weight of 8,486 school children aged 7 to 15years (response rate, 67.5%). The NNS95 was a joint project of the Australian Bureau of Statistics and the then Com-monwealth Department of Health and Aged Care, with measured height and weight on 1,541 children aged 7 to 15years (response rate, 61%). The NCNPAS07 (n = ~4,490) was commis-sioned by the Department of Health and Ageing, the Department of Agriculture and Fisheries and Forestry, and the Australian Food and Grocery Council and included measured height and weight of 2,585 children aged 7 to 15years (response rate, 40%). The NHS12 was conducted by the Australian Bureau of Statistics. The overall response rate was 85% of which 83% had weight and height measured. Data on young people aged 7 to 15 years were included in this analysis (n = 2,940) and were provided by the Australian Bureau of Statistics as a confidentialised unit record file.
Ethics approval for the studies was obtained from the State Directors General of Education (AHF85), the Australian Institute of Health and Welfare (NNS95) or the Australian
Funding:The authors have no support or funding to report.
Commonwealth Scientific Research Organization and the University of South Australia (NCNPAS07) and the Department of Health and Aging (NHS12).
Definition of morbid and severe obesity
There is no consensus on the definition of severity of obesity, so we applied the most recent International Obesity Taskforce (IOTF) BMI cut-points for morbid obesity (equivalent to age
and sex adjusted BMI35kg/m2at 18 years) [2] and the American Heart Association
defini-tion for severe obesity class 2, defined as BMI120% and<140% of the 95th percentile of the
CDC 2000 growth references, or a BMI35kg/m2, whichever was lower, and severe obesity
class 3,defined as BMI140% of the 95th percentile or a BMI40 kg/m2, whichever was
lower [3].
Age groups
To allow comparison with previous Australian studies [9,10] data were categorised by age
groups, 7 to 11 years and 12 to 15 years.
Statistical analysis
Data were analysed using the PAWS Statistical Package version 21.0.0 (http://www-01.ibm.
com/software/analytics/spss). Differences in categorical data were assessed by Chi squared tests. The effects of age and sex were examined by logistic regression.
Results
Between 1985 and 2012 the prevalence of obesity in children increased over two and a half fold, the prevalence of morbid obesity eightfold, and severe obesity fivefold (class 2) and
four-fold (class 3),Table 1. The proportion of obese children who were classified as morbidly or
severely obese did not change significantly between 1985 and 1995 nor did the proportion
change significantly between 2007 and 2012,Fig 1a and 1b. However, the proportion of obese
children who were morbidly obese significantly (P = 0.033) increased from 12.9% in 1995 to
24.2% in 2007,Fig 1a. Similarly, during this time, severe obesity (both class 2 and 3) increased
from 21.1% to 31.1% (P = 0.092) of obese children,Fig 1b. The proportion of children who
were classified as obese, or morbidly or severely obese was not significantly different between age and sex groups.
Discussion
This study is the first to describe the temporal trends over 27 years in morbid and severe obe-sity in Australian children. The prevalence of children with morbid/severe obeobe-sity increased between 1985 and 2012, but of great public health concern is the proportional increase in mor-bid/severe obesity among children with obesity. In 1985 morbid obesity represented 11.3% of children with obesity and 22.5% in 2012. A similar trend was seen in children with combined class 2 and 3 severe obesity.
An increased prevalence of children with morbid obesity has been observed elsewhere, with higher rates reported among certain population groups. In 2013 in New Zealand, 2.5% of chil-dren had morbid obesity, based upon the IOTF definition, however the prevalence was higher among Pacific Islander (9%) and Maori (5%) children and those living in areas of high
depriva-tion (6%) [11]. In the UK the prevalence of morbid obesity (defined as99.6th centile of the
UK 1990 growth charts) from 2006 to 2013 was 4.1% in 4–5 year olds and 5.9% in 10–11 year
groups and among older boys [12]. Similarly, in 2011to 2012 in the US, 8% of 2–19 years olds were severely obese, with the prevalence being higher among adolescents and non-Hispanic
black males [4].
A plateauing of the proportion of children with overweight or obesity as measured by BMI
has been previously reported in Australia [13]. In contrast to the US [4] and Italy [14] our
results show a similar trend for morbid/severe obesity. Potentially, the plateau in morbid obe-sity may reflect the plateau in obeobe-sity, that is, efforts to stabilise obeobe-sity have slowed the inci-dence of obese children becoming morbidly obese. Since the early 2000s child obesity
prevention has been a public health priority and there has been significant government
invest-ment in the early childhood and the primary school sectors [15–18]. While the study findings
are positive, a major concern is accessing morbidly obese children through population surveil-lance surveys. The response rates of the surveys decreased over time, raising a strong possibility of systematic non-response bias. Further, bias may have occurred due to the fact that in the 2012 National Health Survey ~18% of children living in households that agreed to participate in the survey refused to have their height and weight measured. A higher proportion (20.3%) of girls aged 12 to 15 years refused to be measured compared to boys aged 7 to 11 years (16.7%). The implications are not clear, but given the stigma associated with obesity we
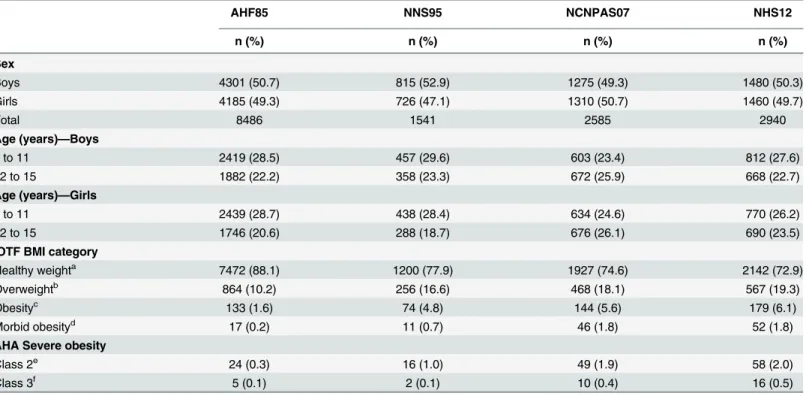
Table 1. Characteristics and BMI status of Australian children age 7 to 15 years 1985, 1995, 2007 and 2012.
AHF85 NNS95 NCNPAS07 NHS12
n (%) n (%) n (%) n (%)
Sex
Boys 4301 (50.7) 815 (52.9) 1275 (49.3) 1480 (50.3)
Girls 4185 (49.3) 726 (47.1) 1310 (50.7) 1460 (49.7)
Total 8486 1541 2585 2940
Age (years)—Boys
7 to 11 2419 (28.5) 457 (29.6) 603 (23.4) 812 (27.6)
12 to 15 1882 (22.2) 358 (23.3) 672 (25.9) 668 (22.7)
Age (years)—Girls
7 to 11 2439 (28.7) 438 (28.4) 634 (24.6) 770 (26.2)
12 to 15 1746 (20.6) 288 (18.7) 676 (26.1) 690 (23.5)
IOTF BMI category
Healthy weighta 7472 (88.1) 1200 (77.9) 1927 (74.6) 2142 (72.9)
Overweightb 864 (10.2) 256 (16.6) 468 (18.1) 567 (19.3)
Obesityc 133 (1.6) 74 (4.8) 144 (5.6) 179 (6.1)
Morbid obesityd 17 (0.2) 11 (0.7) 46 (1.8) 52 (1.8)
AHA Severe obesity
Class 2e 24 (0.3) 16 (1.0) 49 (1.9) 58 (2.0)
Class 3f 5 (0.1) 2 (0.1) 10 (0.4) 16 (0.5)
AHF85, Australian Health and Fitness Survey 1985; NNS95, National Nutrition Survey 1995 NCNPA07, Australian National Children’s Nutrition and Physical Activity Survey 2007; NHS12, National Health Survey 2012; IOTF, International Obesity Taskforce; AHA American Heart Association. a
Equivalent to age and sex adjusted BMI<25 at 18 years bEquivalent to age and sex adjusted BMI25 &<30 at 18 years cEquivalent to age and sex adjusted BMI30 &<35 at 18 years d
Equivalent to age and sex adjusted BMI35 at 18 years eBMI120% and<140% 95th centile or BMI35 and<40 f
BMI140% 95th centile or BMI40
Fig 1. Prevalence of morbid obesity (Fig 1a) and prevalence of severe obesity (Fig 1b) among children with obesity 1985, 1995, 2007 and 2012.Morbid obesity was defined as age and sex adjusted BMI35kg/ m2at 18 years) (2) and severe obesity included class 2 and 3 and was defined as BMI120% 95th percentile of the CDC 2000 growth references, or a BMI35kg/m2, whichever was lower (3).Statistical significance was determined by chi-squared test.
speculate that that the proportion of children with morbid/severe obesity may be underesti-mated and the underestimation may differ by sex and age. A further limitation of the study is that the absolute numbers of children with morbid and/or severe obesity are low. For example, for severe obesity class 3 the numbers ranged from two children in 1995 to 16 children in 2012 and hence the magnitude of change should be interpreted with caution. The strength of the study is that it based on four national Australian cross-sectional surveys of measured height and weight.
In this study we applied the IOTF BMI cut-points for morbid obesity [2] and the American
Heart Association definition, based on the CDC 2000 growth charts, for severe obesity class 2
and class 3 [3]. In Australia both IOTF criteria and CDC 2000 growth chart cut-points are used
in clinical practice and research to identify overweight and obesity. Both definitions indicated a similar trend in the severity of obesity, that is a significant increase between 1995 and 2007, although the proportion of severe obesity at all time periods was approximately 10% higher compared to morbid obesity. These results stress the importance of using the same definition when comparing population data. Nevertheless, both definitions use BMI criteria and selection of cut-points is based on statistical considerations rather than a clear relation with health risk
or degree of body fatness [19]. Studies using skinfold and waist circumference measurements
suggest that BMI underestimates change in fatness in children [20]. Further research efforts are
need to address the relation between BMI and body fat in children.
Based on the NHS 2012 data morbid obesity affects over 30,000 Australian children age 7-15-years. Of concern is that current paediatric obesity services are under-resourced and
fund-ing for primary prevention of child obesity is limited [21]. In contrast to overweight and obese
children, children with morbid obesity have a worse adverse cardiometabolic risk factor profile, demonstrate early signs of vascular dysfunction and subclinical atherosclerosis and required tertiary intervention. There are currently not enough tertiary paediatric obesity services to respond to the high number of children with morbid obesity, and better paediatrician training in obesity management is needed. The protracted nature of morbid obesity requires policy decisions to invest in coordinated models of care for health-service delivery for the manage-ment of morbid obesity in children. In the absence of such policy decisions, Australia is in a precarious situation as greater pressure is placed on limited health care services and managing associated health costs.
Acknowledgments
We would like to thank the Australian Council on Health, Physical Education and Recreation for providing the data from the 1985 survey and the Australian Bureau of Statistics for provid-ing the Confidential Unit Record Files of the National Nutrition Survey 1995 and National Health Survey 2011-2012.We also would like to thank the Commonwealth Department of Health and Ageing, the Department of Agriculture and Fisheries and Forestry, and the Austra-lian Food and Grocery Council for granting access to the data from the 2007 National
Chil-dren’s Nutrition and Physical Activity Survey and the provision of the data computer file by
the Australian Social Science Data Archive, The Australian National University, Canberra. We declare that those who carried out the original analysis and collection of the data bear no responsibility for the analysis or interpretation of the data presented in this paper.
Author Contributions
References
1. Rokholm B, Baker JL, Sorensen TI. The levelling off of the obesity epidemic since the year 1999–a review of evidence and perspectives. Obes Rev. 2010; 1: 835–846.
2. Cole TJ, Lobstein T. Extended international (IOTF) body mass index cut-offs for thinness, overweight and obesity. Pediatr Obes. 2012; 7: 284–294. doi:10.1111/j.2047-6310.2012.00064.xPMID: 22715120
3. Kelly AS, Barlow SE, Rao G, Inge TH, Hayman LL, Steinberger J, et al. Severe obesity in children and adolescents: identification, associated health risks, and treatment approaches: a scientific statement from the American Heart Association. Circulation. 2013; 128: 1689–1712. doi:10.1161/CIR. 0b013e3182a5cfb3PMID:24016455
4. Skinner AC, Skelton JA. Prevalence and trends in obesity and severe obesity among children in the United States, 1999–2012. JAMA Pediatr. 2014; 168: 561–566. doi:10.1001/jamapediatrics.2014.21 PMID:24710576
5. Pyke JE. Australian health and fitness survey 1985. Parkside SA: The Australian Council for Health and Physical Education and Recreation Inc, 1987.
6. McLellan W, Podger A. A national nutrition survey nutrient intakes and physical measurements Austra-lia 1995. AustraAustra-lian Bureau of Statistics 1998.
7. Commonwealth Department of Health and Aging. The 2007 National Children's Nutrition and Physical Activity Survey. [Computer file]. Australian Social Science Data Archive, The Australian National Uni-versity: Canberra, 2009.
8. Australian Bureau of Statistics. The Australian National Health Survey 2011–2012. Available:http:// www.abs.gov.au/ausstats/abs@.nsf/Lookup/4324.0.55.001main+features12011-12.
9. Garnett SP, Baur LA, Cowell CT. The prevalence of increased central adiposity in Australian school children 1985 to 2007. Obes Rev. 2011; 12:887–896. doi:10.1111/j.1467-789X.2011.00899.xPMID: 21722299
10. Magarey AM, Daniels LA, Boulton TJ. Prevalence of overweight and obesity in Australian children and adolescents: reassessment of 1985 and 1995 data against new standard international definitions. Med J Aust. 2001; 174: 561–564. PMID:11453327
11. Farrant B, Utter J, Ameratunga S, Clark T, Fleming T, Denny S. Prevalence of severe obesity among New Zealand adolescents and associations with health risk behaviors and emotional well-being. J Pediatrics. 2013; 163: 143–149.
12. Ells LJ, Hancock C, Copley VR, Mead E, Dinsdale H, Kinra S, et al. Prevalence of severe childhood obesity in England: 2006–2013. Arch Dis Child. 2015; 100: 631–636. doi: 10.1136/archdischild-2014-307036PMID:25628459
13. Norton K, Dollman J, Martin M, Harten N. Descriptive epidemiology of childhood overweight and obesity in Australia: 1901–2003. Int J Ped Obes. 2006; 1: 232–238.
14. Lombardo FL, Spinelli A, Lazzeri G, Lamberti A, Mazzarella G, Nardone P, et al. Severe obesity preva-lence in 8- to 9-year-old Italian children: a large population-based study. Euro J Clin Nutr. 2015; 69: 603–608.
15. Hardy LL, King L, Kelly B, Farrell L, Howlett S. Munch and Move: evaluation of a preschool healthy eat-ing and movement skill program. Int J Behav Nutr Phys Act. 2010; 7: 80. doi:10.1186/1479-5868-7-80 PMID:21047434
16. King L, Turnour C, Wise M. Analysing NSW state policy for child obesity prevention: strategic policy ver-sus practical action. Aust New Zealand Health Policy. 2007; 4:22. PMID:17935632
17. Pettigrew S, Pescud M, Donovan RJ. Traffic light food labelling in schools and beyond. Health Edu J. 2012; 71:746–753.
18. Wolfenden L, Finch M, Nathan N, Weaver N, Wiggers J, Yoong SL, et al. Factors associated with early childhood education and care service implementation of healthy eating and physical activity policies and practices in Australia: a cross-sectional study. Trans Behav Med. 2015; 5: 327–334.
19. Flegal KM, Ogden CL. Childhood obesity: are we all speaking the same language? Adv Nutr. 2011; 2: 159s–166s. doi:10.3945/an.111.000307PMID:22332047
20. Dollman J, Olds TS. Secular changes in fatness and fat distribution in Australian children matched for body size. Int J Ped Obes. 2006; 1:109–113.