Prostate-Specific Antigen fluctuation: what does it mean
in diagnosis of prostate cancer?
_______________________________________________
Jun Seok Kim
1, Je-Guk Ryu
2, Jin Woong Kim
2, Eu Chang Hwang
2, Seung Il Jung
2, Taek Won Kang
2,
Dongdeuk Kwon
2, Kwangsung Park
21 Department of Urology, Kwangju Christian Hospital, Gwangju, Korea and 2 Departments of Urology
and Radiology, Research Institute of Medical Sciences, Chonnam National University Hospital, Gwangju, Korea
ABSTRACT
ARTICLE
INFO
______________________________________________________________ ______________________
Objective: To investigate whether prostate-specific antigen (PSA) fluctuation correlates with a prostate cancer and to assess whether PSA fluctuation could be used for diag-nosis of prostate cancer.
Materials and Methods: Our study included 229 patients who were performed a pros-tate biopsy (non-cancer group, 177; prospros-tate cancer group, 52). Enrolled patients were provided twice PSA tests within 6 months. PSA fluctuation (%/month) was defined as a change rate of PSA per a month. Independent t test was used to compare between two groups. Receiver operator characteristic curve was used to assess the availability as a differential diagnostic tool and the correlation. Simple linear regression was performed to analyze a correlation between PSA fluctuation and other factors such as age, PSA, PSA density, and prostate volume.
Results: There were significant differences in PSA, PSA density, percentage of free PSA, and PSA fluctuation between two groups. PSA fluctuation was significantly greater in non-cancer group than prostate cancer group (19.95±23.34%/month vs 9.63±8.57%/ month, P=0.004). The most optimal cut-off value of PSA fluctuation was defined as 8.48%/month (sensitivity, 61.6%; specificity, 59.6%; AUC, 0.633; P=0.004). In a simple linear regression model, only PSA level was significantly correlated with PSA fluctuation. Conclusion: Patients with wide PSA fluctuations, although baseline PSA levels are high, might have a low risk of diagnosis with prostate cancer. Thus, serial PSA measu-rements could be an option in patients with an elevated PSA level.
Key words:
Prostatic Neoplasms; Prostate-Specific Antigen; Diagnosis
Int Braz J Urol. 2015; 41: 258-64
_____________________
Submitted for publication: October 07, 2013
_____________________
Accepted after revision: June 08, 2014
INTRODUCTION
Prostate-specific antigen (PSA) measu-rement in patients with serum PSA level above 4.0 ng/mL has a sensitivity of about 20%, and the specificity of PSA measurements is approximately 60% to 70% at this cut-off (1). If patients with PSA levels below 10 ng/mL were submitted to prostate biopsy, 20–40% would be diagnosed with prostate cancer and 60–80% should undergo unnecessary biopsy without detecting prostate cancer (2).
or percentage of free PSA (%Free-PSA) has been introduced and used (4-8). In the last two decades, individual fluctuation in serial PSA measurements has been reported to characterize the normal bio-logical variability in PSA among men without prostate cancer (9-13). The aims of this study were to investigate whether PSA fluctuation correlates with a prostate cancer and to assess Whether PSA fluctuation could be used for diagnosis of a pros-tate cancer.
MATERIALS AND METHODS
Patients and Study design
This was a retrospective cohort study in the department of urology of Chonnam National University Hospital (Gwangju, Korea) between Ja-nuary, 2012 and March, 2013. This study included 229 patients who were submitted to a transrectal ultrasonography (TRUS) guided prostate biopsy (177 in non-cancer group, 52 in prostate cancer group). TRUS-guided prostate biopsy was perfor-med in at least 8 cores or more of tissue targeting the peripheral zone at the apex, mid gland, and base on each side of the prostate. Enrolled patients were provided twice PSA measurements within 6 months (baseline PSA, PSA1; secondary PSA, PSA2), and PSA2 was measured at the day before prostate biopsy. Patients with urinary tract infec-tion and who were receiving a 5-alpha reductase inhibitor were excluded from the study. The rese-arch attained ethical approval from the institutio-nal review board of Connam Natioinstitutio-nal University Hospital (IRB No. 210-05-082). The recommenda-tions of the Declaration of Helsinki for biomedical research involving human subjects were followed.
Definition and Measurements
PSA fluctuation (%/mo) was defined as a change rate of PSA ((PSA2-PSA1)/PSA1) per a month. PSAD (ng/mL/g) was defined as a PSA2 di-vided by prostate volume. Prostate volume (g) was measured according to the prostate ellipsoid for-mula, multiplying the largest anteroposterior (hei-ght, H), transverse (width, W), and cephalocaudal (length, L) prostate diameters by 0.524 (H × W × L × π/6) by using TRUS. An automated immunoas-say analyzer (ARCHITECT i2000SR®, Abbott
Diag-nostics, Abbott Park, IL, USA) was used for all PSA measurements, and TRUS-guided prostate biopsy was recommended for a PSA level > 3.0 ng/mL or suspicious digital rectal examination.
Statistical analysis
Whitney U test was used to compare be-tween two groups. Receiver operator characte-ristic (ROC) curve was used to assess the avai-lability as a differential diagnostic tool and the correlation. Simple linear regression was per-formed to analyze a correlation between PSA fluctuation and other factors such as age, PSA, PSAD, and prostate volume. Statistical signifi-cance was set at P<0.05. All statistical analy-ses were performed with SPSS software version 20.0 (SPSS Inc., Chicago, IL, USA).
RESULTS
Baseline Characteristics
The patients’ baseline characteristics are shown in Table-1. Mean PSA1 and PSA2 levels were 5.93 ng/mL and 4.90 ng/mL. PSA fluctuation ran-ged from 0.12%/month to 122.6%/month, PSAD
Table 1 - Baseline characteristics of patients.
Variables Mean (range) Age (year) 66.91 (41-85) PSA1 (ng/mL) 5.93 (0.23-24.62) PSA2 (ng/mL) 4.90 (0.20-9.96) Interval of PSA tests (month) 1.93 (1-6) PSA fluctuation (%/month) 17.61 (0.12-122.60) PSAD (ng/mL/g) 0.15 (0.01-0.58) Prostate volume (g) 37.61 (8.90-160) %Free-PSA (%) 20.22 (3.79-61.50)
No. biopsy results (%)
Non-cancer 177 (77.3) Prostate cancer 52 (22.7)
from 0.01 ng/mL/g to 0.58 ng/mL/g, and prosta-te volume from 8.9 g to 160 g. Patients diagnosed with prostate cancer were 52 (22.7%), and patients with non-cancer were 177 (77.3%). Patients with non-cancer presented benign prostatic hyperpla-sia (155, 67.7%), chronic prostatitis (16, 7.0%), and atypical small acinar proliferation (6, 2.6%).
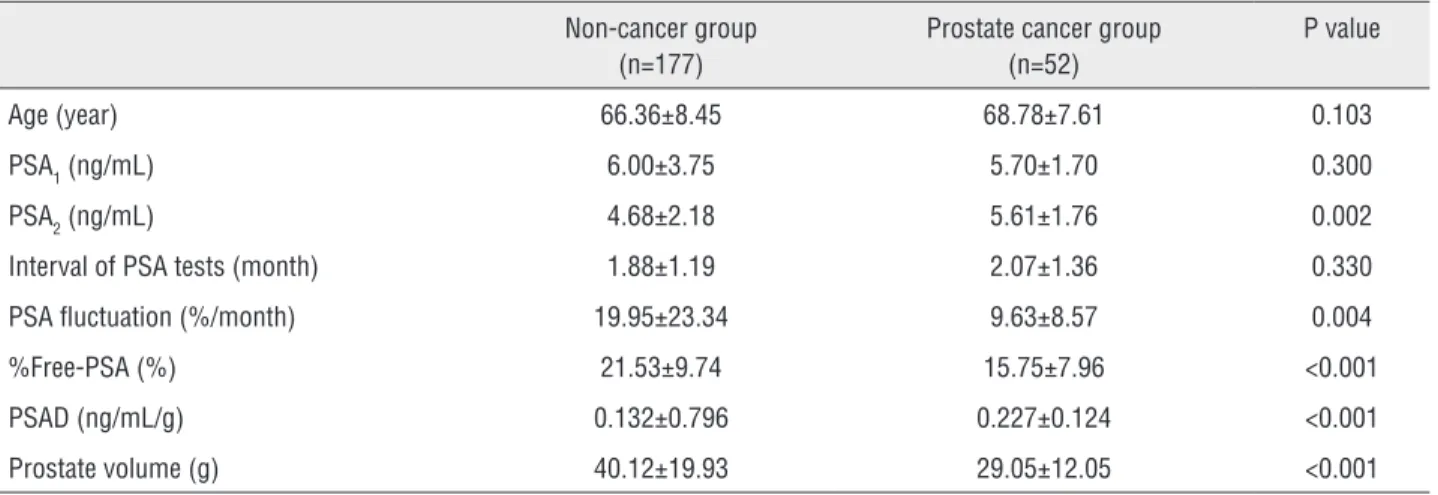
Comparison between Non-cancer group and Prostate cancer group
PSA2 and PSAD were significantly lo-wer in non-cancer group than prostate cancer group (4.68±2.18 vs 5.61±1.76 ng/mL, P=0.002; 0.132±0.796 vs 0.227±0.124 ng/mL/g, P<0.001). PSA fluctuation and %Free-PSA was significantly greater in non-cancer group than prostate can-cer group (19.95±23.34 vs 9.63±8.57%/month, P=0.004; 21.53±9.74 vs 15.75±7.96%, P<0.001). There was significant difference in prostate vo-lume between the two groups (40.12±19.93 vs 29.05±12.05 g, P<0.001) (Table-2).
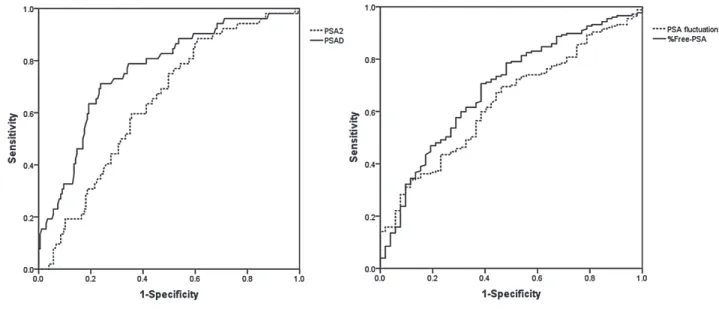
ROC curve analyses of PSA, PSAD, %Free-PSA, and PSA fluctuation
PSA2, PSAD, % Free-PSA, and PSA fluc-tuation was statistically significant as a diffe-rential diagnostic tool. The optimal cut-off va-lues for detecting prostate cancer of PSA and PSAD were defined as 4.92 ng/mL (sensitivity, 65.4%; specificity, 56.5%; area under curve
(AUC), 0.64; P=0.002) and 0.155 ng/mL/g (sen-sitivity, 73.1%; specificity, 71.2%; AUC, 0.762; P<0.001). The appropriate cut-off values of %Free-PSA and PSA fluctuation were defined as 17.31% (sensitivity, 63.3%; specificity, 63.5%; AUC, 0.688; P<0.001) and 8.48%/month (sen-sitivity, 61.6%; specificity, 59.6%; AUC, 0.633; P=0.004), respectively (Figure-1).
Correlation Analysis between PSA fluctuation and other variables
Simple linear regression was performed to analyze a correlation between PSA fluctuation and other factors such as age, PSA, PSAD, and prostate volume. PSA1 and PSA2 levels were significantly correlated with PSA fluctuation in a simple linear regression model (coefficient B, 3.404, P<0.001 in PSA1; coefficient B, -3.978, P<0.001 in PSA2). Age, %Free-PSA, PSAD, and prostate volume did not affect on PSA fluctuation (Table-3).
DISCUSSION
After the recent reports of highly antici-pated data from the Prostate, Lung, Colorectal, and Ovarian Cancer Screening Trial (PLCO) and the European Randomized Study of Screening for Prostate Cancer (ERSPC), the benefit of PSA screening remains controversial (14, 15). Twenty--five percent of men with PSA levels from 4 to
Table 2 - Comparison between non-cancer and prostate cancer group.
Non-cancer group (n=177)
Prostate cancer group (n=52)
P value
Age (year) 66.36±8.45 68.78±7.61 0.103 PSA1 (ng/mL) 6.00±3.75 5.70±1.70 0.300 PSA2 (ng/mL) 4.68±2.18 5.61±1.76 0.002 Interval of PSA tests (month) 1.88±1.19 2.07±1.36 0.330 PSA fluctuation (%/month) 19.95±23.34 9.63±8.57 0.004 %Free-PSA (%) 21.53±9.74 15.75±7.96 <0.001 PSAD (ng/mL/g) 0.132±0.796 0.227±0.124 <0.001 Prostate volume (g) 40.12±19.93 29.05±12.05 <0.001
10 ng/mL have a biopsy-proven prostate cancer, but 75% undergo unnecessary prostate biopsies, potentially leading to anxiety, discomfort, and sig-nificant additional health care cost (16). To impro-ve the low sensitivity of PSA, age-adjusted PSA, PSAD, PSAV, and %Free-PSA have been introdu-ced and used (4-8). In our study, the sensitivity and specificity of PSA was not high (65.4%; 56.5%; AUC, 0.64; P=0.002) in a ROC curve. Similarly with previous reports, both PSAD and %Free-PSA were
the available parameters to improve the low sensi-tivity of PSA (sensisensi-tivity, 73.1%, 63.3%; specificity, 71.2%, 63.5%; AUC, 0.762, 0.688). In addition to PSAD and %Free-PSA, we found that PSA fluctu-ation is associated with the presence of a prostate cancer. Although low sensitivity and specificity, PSA fluctuation could be valuable by using with other PSA indices such as PSAD and %Free-PSA.
In several studies, biological fluctuations in PSA levels have been previously reported to
cha-Table 3 - Simple linear regression analyses of prostate-specific antigen fluctuation and clinical parameters.
Variables Coefficient B SE P value Age (year) -0.059 0.170 0.728 PSA1 (ng/mL) 3.404 0.392 <0.001 PSA2 (ng/mL) -3.978 0.625 <0.001 %Free-PSA (%) 0.163 0.165 0.325 PSAD (ng/mL/g) -20.061 16.029 0.212 Prostate volume (g) -0.029 0.075 0.696
PSA = prostate-specific antigen, PSA1 = baseline PSA, PSA2= secondary PSA, %Free-PSA = percentage of free PSA, PSAD = PSA density.
Figure 1 - Receiver operator characteristic curves analyses of secondary prostate-specific antigen (PSA2), prostate-specific
antigen density (PSAD), percentage of free prostate-specific antigen (%Free-PSA), and prostate-specific antigen (PSA) fluctuation. The optimal cut-off values for detecting prostate cancer were defined as 4.92 ng/mL in PSA2 (sensitivity, 65.4%;
racterize the normal biological variability in PSA levels among men without prostate cancer (9-13). These reports suggest that PSA fluctuation was unrelated to age (9,10). Roehrborn et al. reported a significant fluctuation between two serum PSA measurements obtained within a short-time inter-val of less than 90 days, and authors suggested not a single PSA measurement but repeated PSA tests (9). In our study, mean interval of twice PSA measurements was 1.93 months (approximately 57.9 days), and there was no difference in PSA1 but significant difference in PSA2 between two groups within a more shorter-time interval. John et al. studied to assess the relationship between prostate volume and PSA fluctuation, and found that PSA fluctuation was not correlated with PSA volume but correlated with baseline PSA levels (11). In our study, PSA fluctuation was correla-ted with baseline PSA levels, and not correlacorrela-ted with age, PSAD, %Free-PSA, and prostate volu-me. Thus, we suggest that PSA fluctuation could be used for the differential diagnosis regardless with age and prostate volume. Nixon et al. eva-luated daily biological variations of PSA levels by obtaining 10 serum samples from 24 patients during a 2-week (12). They concluded that the degree of biological fluctuation differs among patients, and the difference between serial PSA measurements that is less than 20% to 46% may be due to biological and analytical variation alone. The reports mentioned above targeted to patients without prostate cancer, and focused on the biologic fluctuation itself. The hypothesis of our study was that degree of PSA fluctuation mi-ght differ according to the presence or absence of prostate cancer, and we found the characteris-tic of PSA fluctuation that patients with prostate cancer had a narrow range of fluctuation in se-rial PSA measurements. In addition, these results are as practically useful as other indices related to PSA such as a PSAD or %Free-PSA.
It is important to clarify that the PSA fluc-tuation should not be confused with PSAV as des-cribed by Carter et al. (17, 18). PSAV represent the rate of change of PSA over time that optimally re-quires three consecutive PSA measurements over a 2-year period, as described by Carter et al. (17, 18). PSA fluctuation is simply a mathematical
es-timate of the absolute monthly changes in PSA (ng/mL per a month) between two measurements that can be separated by less than 1 year. In our study, the mechanism of PSA fluctuation could not be investigated; however, PSA fluctuation mi-ght include the possibility of physiologic changes in serial PSA measurements, in contrast with the PSAV to consider a disease-progression.
In our study, when patients with prostate cancer (n = 52) were divided by a Gleason sco-re, PSA fluctuation was greater in patients with Gleason score ≤6 (n=22) than Gleason score ≥7 (n=30), although not significantly (10.50±9.45 vs 8.99±7.97 %/month, P=0.535; data are not sho-wn in tables). However, this result might not have sufficient statistical power, due to small sample size. We carefully suppose that there might be differences in the PSA fluctuation between low--risk and high-risk prostate cancer. A stu-dy based on larger population is necessary for further conclusive data.
The present study has several limitations. The major limitation is its retrospective design, and thus the present results may be vulnerable to confounding errors and bias. Second, intervals of PSA measurements were not regular. We enrolled patients that measured two times PSA levels wi-thin 6 months to minimize the confounding by irregular intervals. Third, there was significant difference in the prostate volume between two groups. However, we could have concluded about the difference of PSA fluctuation between two groups, because PSA fluctuation was not correla-ted with prostate volume in a simple linear regres-sion model. Finally, this study may not have had sufficient statistical power, due to the relatively small sample size. Future research should inclu-de increased sample size to increase the statistical power. A prospective study based on a larger po-pulation is necessary for further conclusive data.
CONCLUSIONS
ba-seline PSA levels are high, might have a low risk of diagnosis with prostate cancer, and that serial PSA measurements could be an option in patients with an elevated PSA level.
ABBREVIATIONS
PSA = prostate-specific antigen
PSA1 = baseline prostate-specific antigen
PSA2 = secondary prostate-specific antigen
PSAD = prostate-specific antigen density
PSAV = prostate-specific antigen velocity
%Free-PSA = percentage of free prostate-specific antigen
TRUS = transrectal ultrasonography
ROC = receiver operator characteristic
ACKNOWLEDGEMENTS
This study was financially supported by a grant (CRI 120061-31) Chonnam National Univer-sity Hospital Research Institute of Clinical Medici-ne and Chonnam National University (2009-1088).
CONFLICT OF INTEREST
None declared.
REFERENCES
1. Thompson IM, Ankerst DP, Chi C, Lucia MS, Goodman PJ, Crowley JJ, et al.: Operating characteristics of prostate-specific antigen in men with an initial PSA level of 3.0 ng/mL or lower. JAMA. 2005; 294: 66-70.
2. Gosselaar C, Roobol MJ, Roemeling S, de Vries SH, Cruijsen-Koeter Iv, van der Kwast TH, et al. Screening for prostate cancer without digital rectal examination and transrectal ultrasound: results after four years in the European Randomized Study of Screening for Prostate Cancer (ERSPC), Rotterdam. Prostate. 2006; 66: 625-31. 3. Tchetgen MB, Oesterling JE. The effect of prostatitis,
urinary retention, ejaculation, and ambulation on the serum prostate-specific antigen concentration. Urol Clin North Am. 1997; 24: 283-91.
4. Moul JW, Sun L, Hotaling JM, Fitzsimons NJ, Polascik TJ, Robertson CN, et al. Age adjusted prostate specific antigen and prostate specific antigen velocity cut points in prostate cancer screening. J Urol. 2007; 177: 499-503.
5. Vickers AJ, Savage C, O’Brien MF, Lilja H. Systematic review of pretreatment prostate-specific antigen velocity and doubling time as predictors for prostate cancer. J Clin Oncol. 2009; 27: 398-403.
6. Catalona WJ, Partin AW, Slawin KM, Brawer MK, Flanigan RC, Patel A, et al. Use of the percentage of free prostate-specific antigen to enhance differentiation of prostate cancer from benign prostatic diseases. JAMA. 1998; 279: 1542-7. 7. Djavan B, Remzi M, Zlotta AR, Ravery V, Hammerer P, Reissigl
A, et al. Complexed prostate-specific antigen, complexed prostate-specific antigen density of total and transition zone, complexed/total prostate-specific antigen ratio, free-to-total prostate-specific antigen ratio, density of total and transition zone prostate specific antigen: results of the prospective multicenter European trial. Urology. 2002; 60: 4-9.
8. Kim HW, Ko YH, Kang SH, Lee JG. Predictive factors for prostate cancer in biopsy of patients with prostate-specific antigen levels equal to or less than 4 ng/mL. Korean J Urol. 2011; 52: 166-71.
9. Roehrborn CG, Pickens GJ, Carmody T 3rd. Variability of repeated serum prostate-specific antigen (PSA) measurements within less than 90 days in a well-defined patient population. Urology. 1996; 47: 59-66.
10. Lujan M, Paez A, Sanchez E, Herrero A, Martin E, Berenguer A. Prostate specific antigen variation in patients without clinically evident prostate cancer. J Urol. 1999; 162: 1311-3. 11. Nichols JH, Loeb S, Metter EJ, Ferrucci L, Carter HB. The
relationship between prostate volume and prostate-specific antigen variability: data from the Baltimore Longitudinal Study of Aging and the Johns Hopkins Active Surveillance Program. BJU Int. 2012; 109: 1304-8.
12. Nixon RG, Wener MH, Smith KM, Parson RE, Strobel SA, Brawer MK. Biological variation of prostate specific antigen levels in serum: an evaluation of day-to-day physiological fluctuations in a well-defined cohort of 24 patients. J Urol. 1997; 157: 2183-90.
13. Park YH, Lee JK, Jung JW, Lee BK, Lee S, Jeong SJ, et al. Prostate cancer detection rate in patients with fluctuating prostate-specific antigen levels on the repeat prostate biopsy. Prostate Int. 2014; 2: 26-30.
14. Andriole GL, Crawford ED, Grubb RL 3rd, Buys SS, Chia D, Church TR, et al. Mortality results from a randomized prostate-cancer screening trial. N Engl J Med. 2009; 360: 1310-9.
15. Schroder FH, Hugosson J, Roobol MJ, Tammela TL, Ciatto S, Nelen V, et al. Screening and prostate-cancer mortality in a randomized European study. N Engl J Med. 2009; 360: 1320-8.
17. Carter HB, Pearson JD, Metter EJ, Brant LJ, Chan DW, Andres R, et al. Longitudinal evaluation of prostate-specific antigen levels in men with and without prostate disease. JAMA. 1992; 267: 2215-20.
18. Carter HB, Pearson JD, Waclawiw Z, Metter EJ, Chan DW, Guess HA, et al. Prostate-specific antigen variability in men without prostate cancer: effect of sampling interval on prostate-specific antigen velocity. Urology. 1995; 45: 591-6.
_______________________ Correspondence address: