*Correspondence: D. A. Santos. Laboratório de Microbiologia, Faculdade de Ciências da Saúde, Universidade Vale do Rio Doce, Rua Israel Pinheiro, 2000 - Bairro Universitário, 35020-220 - Governador Valadares - MG, Brasil. E-mail: [email protected]
A
rti
Pharmaceutical Sciences vol. 45, n. 4, oct./dec., 2009
Comparison of microbiological assay and HPLC-UV for
determination of luconazole in capsules
Kelly Marques Queiroz
1, Maria-Luiza Martins Silva
1, Nathália Duque Prado
1, Paulo Marcelo
Andrade Lima
1, Rosiane Dias Lopes Diniz
1, Isabela Costa César
2, Gerson Antônio Pianetti
2,
Daniel Assis Santos
1*
1Laboratório de Microbiologia, Faculdade de Ciências da Saúde, Universidade Vale do Rio Doce, 2Departamento de Produtos
Farmacêuticos, Faculdade de Farmácia, Universidade Federal de Minas Gerais
The development of a speciic agar diffusion bioassay for the quantitative determination of luconazole formulated in capsules was carried out using a strain of Candida albicans ATCC 18804 as the test organism. A prospective validation of the method showed adequate linearity (r2=0.9995), precision (R.S.D. = 4.0% for intra-day and 4.5% for inter-day precision) and accuracy (mean recovery = 102.9%). High performance liquid chromatography was chosen as a comparison method for the luconazole determination. The contents of luconazole determined by both methods, for four capsule samples, showed a strong correlation, conirmed by Pearson’s correlation coeficient value (r = 0.9884). The bioassay is a suitable method for both research and pharmaceutical industry laboratories.
Uniterms: Fluconazole/quantitative determination. Microbiological assay/agar diffusion. High performance liquid chromatography.
Este trabalho visou ao desenvolvimento e validação de um método microbiológico por difusão em ágar para quantiicação de luconazol em cápsulas utilizando o isolado Candida albicans ATCC 18804 como reagente biológico. O método foi validado e foi veriicada linearidade (r2=0,9995), precisão (D.P.R. = 4.0% para precisão intra-dia e 4,5% para precisão inter-dia) e exatidão (recuperação média = 102,9%). Concomitantemente, foi realizado o doseamento de luconazol nas cápsulas por meio de cromatograia líquida de alta eiciência. Os teores encontrados por ambos os métodos demonstraram alta correlação, conirmada pelo Coeiciente de Correlação de Pearson (r = 0,9884). O ensaio microbiológico desenvolvido pode ser considerado ferramenta valiosa tanto para a pesquisa cientíica quanto para a rotina da indústria farmacêutica.
Unitermos: Fluconazol/quantiicação. Ensaio microbiológico/por difusão em ágar. Cromatograia líquida de alta eiciência.
INTRODUCTION
Fluconazole, a triazole agent, is one of the most commonly prescribed systemic antifungals (Koks et al., 1996; Marchetti et al., 2001; Kim et al., 2007). It is well absorbed after oral administration and shows good penetration into cerebrospinal luid (Harris et al., 1999). This agent is used in the treatment of oropharyngeal, esophageal, or vulvovaginal candidiasis, as well as other serious systemic candida infections. It is also used for
the treatment of meningitis caused by Cryptococcus sp. (Mathy et al., 2003; Porta et al., 2005). Fluconazole is available commercially for oral administration in capsu-les of 50, 150 and 200 mg. A sodium chloride solution of this agent for intravenous administration is also available (Porta et al., 2005).
et al., 2003; Porta et al., 2005; Kim et al., 2007; Lima et
al., 2009).
The most commonly described assay for fluco-nazole content in capsules are high performance liquid chromatography (HPLC), gas liquid chromatography and spectrophotometry (Harris et al., 1989; Rex et al., 1991; Moraes et al., 1999; Porta et al., 2005; Kim et al., 2007). These methods require expensive equipment and consi-derable technician time (Rex et al., 1991). Furthermore, luconazole, as with other antibiotics, may be also quan-tiied by bioassay for its activity assessment (Puranjoti et
al., 1999; Porta et al., 2005), but experimental conditions
such as concentrations of the inocula, incubation tempe-rature and test microorganism are not yet well established oficial methods.
Previous studies focusing on luconazole bioassay development presented methods used for determination of the antifungal levels in plasma, serum (Rex et al., 1991; Porta et al., 2005) and saliva (Koks et al., 1996). Studies of luconazole determination in pharmaceutical capsules have used mainly HPLC and UV (Abdel-Moety et al., 2002; Porta et al., 2005; Kim et al., 2007), while micro-biological method use is scarce. This assay can reveal subtle changes not demonstrable by chemical methods. Moreover, it gives the possibility to evaluate the potency of luconazole, which is considered important for the analysis of antibiotics (Salgado et al., 2006).
The purpose of this study was to develop and vali-date a microbiological method to determine the potency of fluconazole in commercial capsules. The bioassay results were compared to those obtained by HPLC, using the same samples.
MATERIAL AND METHODS
Reagents and materials
Fluconazole reference standard was kindly supplied by Pizer. Fluconazole capsules (150 mg) were obtained from four different compounding pharmacies of Gover-nador Valadares, Minas Gerais State, Brazil. Distilled water puriied in a Millipore (Bedford, MA, USA) system was used in the analysis. Acetonitrile (HPLC grade) was purchased from Tedia (Fairield, OH, USA) and dimethyl sulfoxide (DMSO) (analytical grade) from Synth (Diade-ma, São Paulo State, Brazil).
10 mL. This solution was further diluted in sterile distil-led water to a concentration of 625.00 µg/mL, which was used for serial two-fold dilution up to 39.06 µg/mL. The standard tested concentrations were 625.00 (S1), 312.50 (S2), 156.25 (R: reference concentration), 78.13 (S4) and 39.06 (S5) µg/ml.
A pool of each sample of luconazole capsules was made and a stock solution of 1000 µg/mL in DMSO was prepared. This solution was diluted in sterile distilled water to a concentration of 156.25 µg/mL (identical to the standard reference concentration - R). All the luconazole solutions (standard and test) were prepared immediately before performing the test.
Candida albicans ATCC 18804 was maintained on
Sabouraud dextrose slant agar at 4 °C. Prior to use, the mi-croorganism was transferred to Sabouraud dextrose slant agar and incubated for 24 h at 28 °C. After this period, a small portion of the yeast was transferred to a sterile sali-ne solution (0.9%) and the transmittance was adjusted to 85% at a wavelength of 520 nm, which measured 1-5 x 10⁶ CFU/mL (Figueiredo et al., 2007). Further dilution of
the inocula suspension was made in 15 mL of Sabouraud dextrose agar melted at 45 °C to achieve a inal concen-tration of 1-5 x 10⁵ CFU/mL.
Sterile Petri dishes (100 mm x 20 mm) were used in all microbiological tests. A base layer of Sabouraud dextrose agar (8 ml) was plated before the test to facilitate the visua-lization of inhibition zones. After base layer solidiication, the next layer, to be used for inoculation, was poured into Petri dishes on top of the base layer. The agar was allowed to gel at room temperature for 10 to 15 min. After solidii-cation, 5 mm-diameter wells were bored at six points for a 5 x 1 assay (Figure 1). Five Petri dishes were used for each assay in order to test the reference concentration (R) conco-mitantly with each standard or sample concentrations. Forty microliters of each standard or test solution were pipetted into individual wells. The plates were incubated at 28 °C for 24 h. The inhibition zone was measured using calipers. Assay plates were tested in triplicate (corresponding to 15 dishes in each assay), resulting in nine measures of the standards S1, S2, S4 and S5 and the test sample. The R con-centration was tested forty-ive times (Figure 1) in order to it data obtained in all the dishes.
28 °C and 37 °C and (iii) inocula concentration varying from 1-5 x 10³ to 1-5 x 10⁵ CFU/mL.
Correction of the inhibition zone (IZc) with the reference (R) concentration
The average of all measures of R concentration (in all the dishes) was used to it the values of inhibition zones in each individual dish.
To it the obtained data, the following equation was applied:
IZc = IZ + (RA -Rs)
where: IZc is the value of the corrected inhibition zone; IZ, the average value of the inhibition zone of the standard or tested sample in the studied dish; RA, the ave-rage of the inhibition zone values for the R concentration in all dishes (a total of 45 values) and Rs, the average of inhibition zone values for the R in the studied dish (a total of nine values) (Lima et al., 2009).
The data analysis was made by plotting log10 of lu-conazole concentration versus inhibition zones; the curve equation was obtained by regression analysis. Concen-trations of test solutions were determined using the curve equation of the standard curve.
Method validation
The microbiological method was validated by evalu-ation of linearity, precision and accuracy, according to the procedures described in ICH guidelines Q2 (R1).
(i) Linearity: in order to assess the linearity of the assay, five concentrations of the reference standard were tested (625.00; 312.50; 156.25; 78.16 and 39.06 µg/mL). A calibration curve for log10 of luconazole concentration versus inhibition zones was plotted and the obtained data were sub-jected to regression analysis using the Least Squares Method. (ii) Precision: the intra-day precision was evalu-ated by analyzing six replicates of luconazole solutions (n=6), at 100% of the test concentration (156.25 µg/mL).
Similarly, the inter-day precision was evaluated on two consecutive days (n=12). The concentration of lucon-azole in capsule samples was determined and the relative standard deviation (R.S.D.) was calculated.
(iii) Accuracy: this was determined by adding known amounts of luconazole reference standard (39.06, 117.18 or 195.30 µg/mL) to a sample solution (39.06 µg/mL) at the beginning of the analyses, corresponding to 50, 100 and 150% of the test concentration. At each level, solutions were prepared in triplicate and applied to the plate assay de-scribed above. The recovery percentage of luconazole was determined. In addition, the bioassay results were compared to a second known method (HPLC-UV).
HPLC assay for luconazole
The HPLC analyses were carried out on a Agilent 1200 system (Santa Clara, CA, USA), composed of a qua-ternary pump, an auto sampler, a photodiode array detector (DAD) and HP ChemStation software. The chromatogra-phic conditions employed were those described by Porta
et al. (2005). The column used was a reversed-phase C18
(150 × 4.6 mm I.D.; 5 µm particle size) from ACE (Aber-deen, Scotland), at 30 °C. UV-photodiode array detection was performed at 260 nm. The mobile phase was com-posed of acetonitrile and water (22:78), at a low rate of 1.0 mL/min. The injection volume was 20 µL.
Approximately 25 mg of fluconazole reference standard were accurately weighed in a volumetric lask of 50 ml and dissolved in mobile phase. The flask vo-lume was adjusted to 50 ml with the same solvent. The sample solutions were prepared by weighing a portion of the capsule’s powder, equivalent to about 25 mg of luconazole, and dissolving in mobile phase, obtaining a 500 µg/mL solution. All solutions were iltered through 0.45 µm membranes before injection.
Analysis of luconazole capsules
Four commercial samples of luconazole capsules were analyzed using both the developed and validated
Method development
In this study we developed and validated a bioassay to determine luconazole potency in capsules. The stan-dardization of experimental conditions is crucial to obtain reliable and reproducible results. In spite of achieving adequate results, the lack of this standardization is clearly detectable in previous studies involving potency determi-nation of antifungals, since each paper describes a differ-ent way of performing the tests. Firstly, the presence of a base layer without the inocula provided easier-to-measure inhibition zones. The described incubation temperatures were 30 °C (Espinel-Ingroff et al., 1977; Odds et al., 1999), 32 °C (Purangioti et al., 1999), 35 °C (Pascual et al., 2007) and 37 °C (Law et al., 1994; Perea et al., 2000). The temperatures tested in the present paper (28 °C and 37 °C) did not yield different results, revealing that both can be used in the experiments. Published incubation times varied from 14 h (Pascual et al., 2007) to 24 h (Odds et al., 1999). The incubation time tested in our study (24 h) was adequate to provide suficient yeast growth and regular inhibition zones. This was not observed when the plates were incubated for 36 h, which provided lower zones and culminated in signiicantly reduced concentrations (prob-ably due to the more prominent yeast growth) which were not well correlated to the HPLC assay (data not shown).
A large number of strains have also been used as test organisms: Candida kefyr 706 (Garcia-Hermoso et al., 1995), Candida kefyr ATCC46764 (Perea et al., 2000),
Candida albicans DSY1024 (Marchetti et al., 2001),
Candida albicans ATCC95020 (Pascual et al., 2007) and
Sacharomyces cerevisiae ATCC2601 (Adams, 2006). The
strain C. albicans ATCC 18804 used in this work was con-sidered to be adequate for luconazole testing. In addition, it would be very helpful if researchers and industries used the same strain to perform antifungal determination so as to improve test standardization. The inocula concentration of 1-5 x 10⁵ CFU/mL provided the best visualization of
the inhibition zones compared to the inocula with 103 and
104 CFU/mL, for which zones were not clearly delineated.
In our study design, we used six wells per plate (as depicted in Figure 1), which make possible lower devia-tions due to the correction of the inhibition zone values by a standard concentration (R). Other researchers have
Furthermore, the excessive manipulation of each plate increases the possibility of undesirable contamination.
Bioassay
The inhibition zones were clearly delineated by using optimized testing conditions. Triplicate wells gave the same zone diameters within 1 mm. The average of the corrected inhibition zones values for standard concentra-tions were 16.61 mm (S1), 13.78 mm (S2), 10.72 mm (R), 8.07 mm (S4) and 5.28 mm (S5). Calibration curves were plotted and the r2 value was > 0.9990. DMSO, at the inal
concentration, did not inluence the C. albicans ATCC 18804 growth.
Validation of bioassay
A good linear relationship (r2 = 0.9995) was found
between the luconazole concentrations and growth inhi-bition zone diameter, in the assayed range. The regression analysis data are shown in Table I. The representative linear equation for luconazole was 9.429x + 9.869. The low R.S.D. value (1.04%) indicated the precision of the calibration curve.
Precision was expressed as relative standard devia-tion (R.S.D.). In the intra-day precision assay (n=6), the mean content of luconazole was 95.8% (R.S.D. = 4.0%). For the inter-day precision (n=12), the obtained mean was 96.8% (R.S.D. = 4.5%). The obtained R.S.D. values conirmed the adequate precision of the method.
Accuracy was investigated by means of a standard addition experiment, at three concentration levels, in triplicate (n=9). The recovery percentages varied from 101.5% to 104.4% (Table II). The mean recovery of
TABLE I -Overview of the linearity data obtained for luconazole
Parameters Regression analysis results Regression coeficient 0.9995
Slope ± standard deviation 9.429 ± 0.118 Intercept ± standard deviation -9.869 ± 0.264 Relative standard deviation (%) 1.04 Concentration range (µg/ml) 39.06 - 625.00
102.9% assured accuracy of the method. In addition, an adequate correlation with HPLC-UV method was obtai-ned, as depicted in Table III.
HPLC assay
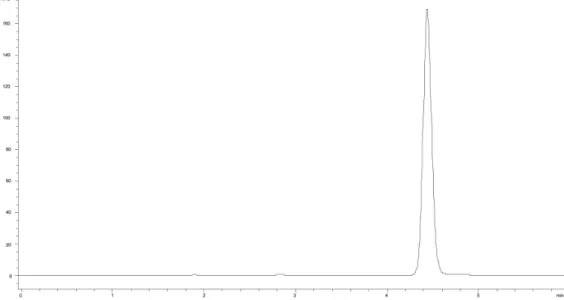
Samples of four commercial luconazole 150 mg capsules were quantified in triplicate by HPLC. The obtained chromatogram (Figure 2) shows a symmetrical peak, with a tailing factor of 1.09 and retention time of
4.44 min. The luconazole contents in each sample are presented in Table III.
Correlation of bioassay results and HPLC
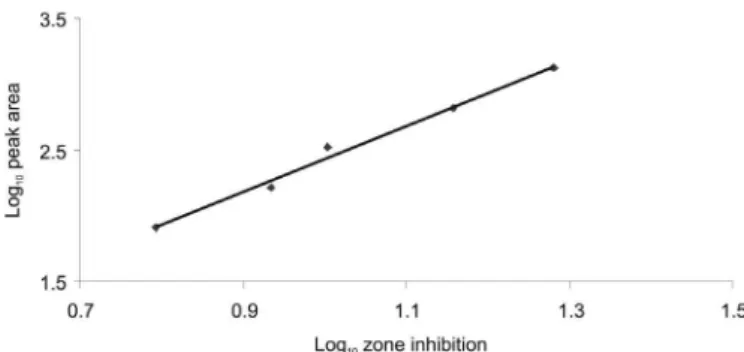
The correlation between both methods was evalua-ted. Figure 3 demonstrates the high agreement regarding the zone inhibition of the bioassay and the peak area of the HPLC method, in five different concentrations (r = 0.9950). The contents of luconazole determined by both methods, for four capsule samples, showed strong correlation, indicated by Pearson’s correlation coeficient value (r = 0.9884).
The data in Table III indicate higher contents of luconazole determined by bioassay in comparison to the concentrations assayed by the HPLC method. This obser-ved deviation may be due to the considerable differences between the two distinct methods, such as experimental conditions and detection techniques. In addition, bio-assays can reveal subtle changes not demonstrable by chemical methods. However, the contents of luconazole determined by both methods showed a strong correlation (r = 0.9884), which is clear evidence of the corresponden-ce in the results. Similar results were found by Warnock (1988) when comparing bioassay and HPLC for determi-nation of itraconazole.
The bioassay, as presented, is suitable for both rese-arch and pharmaceutical industry laboratories. The major advantage of the bioassay is its low cost and relative simpli-city; it is easy to perform and requires no special equipment (Rex et al., 1991; Perea et al., 2000). It is interesting to note that in some studies involving bioassay for luconazole in
FIGURE 2 - Chromatogram obtained with acetonitrile:water (22:78), using an ACE C18 column (250 × 4.6mm I.D.; 5 µm particle size), at 30 °C, detection at 260 nm. Retention time of luconazole peak was 4.44 min.
TABLE II - Recovery of fluconazole in a standard addition experiment for accuracy evaluation
Sample (Added µg/mL)
Found
(µg/mL)* %
1 39.06 40.78 104.4
2 117.18 118.95 101.5
3 195.30 200.99 102.9
* average of three determinations
TABLE III - Fluconazole contents in capsule samples obtained by bioassay and HPLC methods
Samples Fluconazole content (%) Bioassay HPLC
1 103.9 99.1
2 95.6 90.7
3 95.5 90.7
plasma and sera, the r2 values were lower than the value
found in the present paper (Rex et al., 1991; Hüsewede, Dermoumi, 1996). In spite of this slight difference, our re-sults showed bioassay to be reliable, which may encourage other authors and the pharmaceutical industry to perform it for luconazole, concomitantly with the HPLC method. This is an important step for potency veriication of antifun-gals, even though this kind of test is not present in oficial pharmacopoeias (Farmacopéia Brasileira, 1988; British Pharmacopoeia, 2007; The United States Pharmacopoeia, 2007). For antibacterial drugs, pharmacopoeias recommend the performing of both HPLC and bioassays, as the tests are complementary to each other.
Bioassays play an essential role in manufacturing and quality control of antibiotic medicines (Salgado et al., 2006). Therefore, the method reported here represents a simple and low cost assay to quantify fluconazole in capsules. The potential of adapting this method for use with other azole antifungals warrants further investigation.
In conclusion, the bioassay for the determination of luconazole in capsules proved reliable when performed using an inoculum of 1-5 x 10⁵ CFU/mL of C. albicans
ATCC 18804 and an incubation time of 24h, at 28°C or 37°C.
REFERENCES
ABDEL-MOETY, E. M.; KHATTAB, F. I.; KELANI, K. M.; ABOUAL-ALAMEIN, A. M. Chromatographic determination of clotrimazole, ketoconazole and luconazole in pharmaceutical formulations. Farmaco, v.57, p.931-938, 2002.
ADAMS, A. I. H.; STEPPE, M.; FRÖEHLICH, P. E.; BERGOLD, A. M. Comparison of microbiological and UV-spectrophotometric assays for determination of voriconazole in tablets. J. AOAC Int., v.89, p.960-965, 1996.
standard. 2.ed. Wayne: Clinical and Laboratory Standards Institute, 2002. p.1-26.
CLINICAL AND LABORATORY STANDARDS INSTITUTE (CLSI). Reference method for broth dilution antifungal susceptibility testing of ilamentous fungi. Wayne: Clinical and Laboratory Standards Institute, 2002. (Approved standard M38-A).
COHEN, L. G.; DIBIASO, A.; LISCO, S. J.; HURFORD, W. E. Fluconazole serum concentration and pharmacokinetics in an obese patient. Pharmacotherapy, v.17, p.1023-1026, 1997.
ESPINEL-INGROF, A.; SHADOMY, S.; FISCHER, J. F. Bioassay for miconazole. Antimicrob. Agents Chemother., v.11, p.365-368, 1977.
FARMACOÉIA Brasileira. 4.ed. Atheneu: São Paulo, 1988. p.287.1-287.2.
FIGUEIREDO, V. T.; SANTOS, D. A.; RESENDE, M. A.; HAMDAN, J. S. Identification and in vitro antifungal susceptibility testing of 200 clinical isolates of Candida spp. responsible for fingernail infections. Mycopathol.,
v.164, p.27-33, 2007.
GARCIA-HERMOSO, D.; DROMER, F.; IMPROVISIS, L.; PROVOST, F.; DUPONT, B. Fluconazole concentrations in saliva from AIDS patients with oropharyngeal candidosis refractory to treatment with luconazole. Antimicrob. Agents Chemother., v.39, p.656-660, 1995.
HARRIS, S. C.; WALLACE, J. E.; FOULDS, G.; RINALDI, M. G. Assay of fluconazole by megabore capillary gas-liquid chromatography with nitrogen-selective detection.
Antimicrob. Agents Chemother., v.33, p.714-716, 1989.
HOSTETLER, J. S.; HEYKANTS, J.; CLEMONS, K. V.; WOESTENBORGHS, R.; HANSON, L. H.; STEVENS, D. A. Discrepancies in bioassay and chromatograph determinations explained by metabolism of itraconazole to hydroxyitraconazole: studies of interpatient variations in concentrations. Antimicrob. Agents Chemother., v.37, p.2224-2227, 1993.
HÜLSEWEDE, J. W.; DERMOUMI, H. Serum level determination of luconazole by high-performance liquid chromatography and bioassay. Zentralbl. Bakteriol., v.283, p.492-496, 1996.
KEEVIL, B. G.; NEWMAN, S.; LOCKHART, S.; HOWARD, S. J.; MOORE, C. B.; DENNING, D. W. Validation of an assay for voriconazole in serum samples using liquid chromatograph-tandem mass spectrometry. Ther. Drug Monit., v.26, p.650-657, 1994.
KIM, S. S.; IM, H. T.; KANG, I. M.; LEE, H. S.; LEE, H. W.; CHO, S. H.; KIM, J. B.; LEE, K. T. An optimized analytical method of fluconazole in human plasma by high-performance liquid chromatography with ultraviolet detection and its application to a bioequivalence study. J. Chromatogr. B., v.852, p.174-179, 2007.
KOKS, C. H.; MEENHORST, P. L.; HILLEBRAND, M. J.; BULT, A.; BEIJNEN, J. H. Pharmacokinetics of luconazole in saliva and plasma after administration of an oral suspension and capsules. Antimicrob. Agents Chemother., v.40, p.1935-1937, 1996.
LAW, D.; MOORE, C. B.; DENNING, D. W. Bioassay for serum itraconazole concentrations usin hydroxyitraconazole standards. Antimicrob. Agents Chemother., v.38, p.1561-1566, 1994.
LIMA, P. M. A.; PRADO, N. D.; SILVA, M. L. M.; DINIZ, R. D. L.; QUEIROZ, K. M.; CÉSAR, I. C.; PIANETTI, G. A.; SANTOS, D. A. Determination of ketoconazole in capsules by HPLC and microbiological assay. J. AOAC Internat., v.92, p.1076-1081, 2009.
MARCHETTI, O.; MAJCHERCZYK, P. A.; GLAUSER, M. P.; BILLE, G.; MOREILLON, P.; SANGLARD, D. Sensitive bioassay for determination of luconazole concentrations in plasma using a Candida albicans mutant hypersusceptible to azoles. Antimicrob. Agents Chemother., v.45, p.696-700, 2001.
MATHY, F. X.; VROMAN, B.; NTIVUNWA, D.; WINNE, A. J. D.; VERBEECK, R. K.; PRÉAT, V. On-line determination of luconazole in blood an dermal rat microdialysates by microbore high-performance liquid chromatograph. J. Chromat. B., v.787, p.323-331, 2003.
MORAES, L.A.; LERNER, F.E.; MORAES, M.E.; MORAES, M.O.; CORSO, G.; DE NUCCI G. Fluconazole bioequivalence study: quantification by tandem mass spectrometry. Ther. Drug Monit., v.21, p.200-207, 1999.
ODDS, F. C.; DUPONT, B.; RINALDI, M. G.; STEVENS, D. A.; WARNOCK, D. W.; WOESTENBORGHS, R. Bioassays for itraconazole blood levels: an interlaboratory collaborative study. J. Antimicrob. Chemother., v.43, p.723-727, 1999.
PASCUAL, A.; NIETH, V.; CALANDRA, T.; BILLE, J.; BOLAY, S.; DECOSTERD, L. A.; BUCLIN, T.; MAJCHERCAYK, P. A.; SANGLARD, D.; MARCHETTI, O. Variability of voriconazole plasma levels measured by new high-performance liquid chromatograph and bioassay methods. Antimicrob. Agents Chemother., v.51, p.137- 143, 2007.
PEREA, S.; PENNICK, G. J.; MODAK, A.; FOTHERGILL, A. W.; SUTTON, D. A.; SHEEHAN, D. J.; RINALDI, M. G., Comparison of high-performance liquid chromatographic and microbiological methods for determination of voriconazole levels in plasma. Antimicrob. Agents Chemother., v.44, p.1209-1213, 2000.
PORTA V.; CHANG, K. H.; STORPIRTIS, S. Evaluation of the bioequivalence of capsules containing 150 mg of luconazole. Int. J. Pharm., v.288, p.81-86, 2005.
PURANJOTI, P.; KASINA, R.; TENJARLA, S. Microbiological and HPLC analysis of miconazole in skin, serum and phase-solubility studies. J. Clin. Pharm. Therap., v.24, p.445-450, 1999.
REX, J. H.; HANSON, L. H.; AMANTEA, M. A.; STEVENS, D. A.; BENNETT, J. E. Standardization of a luconazole bioassay and correlation of results with those obtained by high-pressure liquid chromatography. Antimicrob. Agents Chemother., v.35, p.846-850, 1991.
SALGADO, H. R. N.; LOPES, C. C. G. O.; LUCCHESI, M. B. B. Microbiological assay for gatiloxacin in pharmaceutical formulations. J. Pharm. Biomed. Anal., v.40, p.443-446, 2006.