Bull Part Am Healrh Organ 17(4), 1983.
ALCOHOL
CONSUMPTION
LEVELS
IN COSTA RICA’
Hugo Adolf0 Miguez L.*
A nationwide survey of Costa Rican drinking patterns was conducted in 1981- 1982 in order to assess general patterns of alcoholic beverage consumption. This article reports the results of that survey.
Introduction
Alcoholism in Costa Rica has been a subject of concern to the general population and par- ticularly to those responsible for public health. In 1970, studies performed by Charles Chas- soul and Irma Morales (I) showed that ap- proximately 7 per cent of the population had problems with “pathologic consumption” of alcoholic beverages. Unfortunately, the lim- ited resources available at the time were in- sufficient to expand this work into a truly thoroughgoing exploration of the subject.
Ten years later, when more funding be- came available, another study of alcoholic beverage consumption in Costa Rica was be- gun. This study, undertaken with the collab- oration of Dr. Juan Marconi in his capacity as a PAHO consultant, employed a different methodology than its predecessor. The pres- ent article describes this more recent study and the results obtained.
Materials and Methods
A total of 18 cantons (political subdivisions of Costa Rican provinces) were selected for in- clusion in the study. This selection included 20 per cent of all the cantons in the country. The choice of cantons was based on the prin- ciple that those selected should include a rea- sonable spectrum of locales-in terms of high,
‘Also appearing in Spanish in the B&in de la CJJccina Sanifaria Panamericana, 95(5):451-460, 1983.
2Director, Department of Research, National Alcohol- ism Institute of Costa Rica.
medium, and low alcohol consumption per capita vis-a-vis the national average;3 in terms of rural versus urban populations;4 and in terms of geographic distribution-with each of the country’s regions5 being represented by at least two of the selected cantons. In some cases a “program area” within the selected canton was defined-because that area had a relatively denser population or was relatively accessible.
The subsequent surveys of drinking preva- lence in the selected cantons and program areas were made one at a time, because the available funds and resources were not suff- cient to permit simultaneous coverage of all the study areas. Proceeding in this manner, the first survey was conducted in July 1980 and the last was completed in July 1982.
Demographic maps drawn up for Costa Rica’s 1973 census provided the basis for se- lecting population samples in each canton or program area. This meant that in each case the census figures had to be updated to include new human settlements and other important changes occurring since the time of the cen- sus. Depending on the characteristics of the area involved, the record was also updated to include residents staying more than a month
3Estimated on the basis of a previous study (3). 4A complementary study is currently seeking to com- pare specific variations in alcohol consumption among rural and urban populations.
5These regions are geographic subdivisions with at least 250,000 inhabitants and 10,000 square kilometers of territory that are employed for research purposes and for planning socioeconomic development. In all, Costa Rica contains 81 cantons grouped into five regions.
M&LeZ l ALCOHOL CONSUMPTION IN COSTA RICA 397
in hotels, boarding-houses, and “bathes”
(bachelor quarters for laborers in banana- raising zones). The modified cartography was then divided into conglomerate& with approx- imately equal populations, and various of these conglomerates were selected indepen- dently and at random for inclusion in the sur- vey. After that, the names of individuals 15 years of age and over within these chosen con- glomerates were listed, and those to be inter- viewed were systematically selected.7 The total sample of selected individuals consisted of 5,647 subjects at least 15 years of age, of whom 5,244 (92.9 per cent) were interviewed. In 97 cases (1.7 per cent) the subject refused to be interviewed; and in another 306 cases (5.4 per cent) the subject could not be located, was unable to answer questions, or provided in- complete data.
These interviews, however, were really just the first step in a three-stage process. That is, during the interview each subject was asked about his or her drinking habits and any re- sulting problems or consequences. After that the answers given were checked with an infor- mant. And finally, in all cases where a subject was classed as an alcoholic, that subject was examined by a physician in order to obtain a clear diagnosis.
The definitions of alcohol intake levels used in this study were obtained by the National Institute on Alcoholism from a document prepared by Dr. Marconi (4). Those defmi- tions are as follows:
l Nondrinker-One who never drinks alcoholic
beverages.
l Quasiabstainer-One who drinks four or five
times a year but does not get drunk.
l Moderate drinker-One who drinks alcoholic
beverages more than five times a year but whose
‘These conglomerates were small subdivisions, defined solely for the purposes of this study, that contained ap-
proximately 20 residences each.
7.91 those listed were assigned numbers, and one of the first three people on the list was selected at random.
Starting with that person’s number and counting, eve-v third person on the list was selected.
episodes of heavy drinking are limited. Specifically, a male whose daily consumption of alcohol equals or exceeds 120 cc less than twice a month or 24 times a year, or a female whose consumption of alcohol equals or exceeds 60 cc less than twice a
month or 24 times a year.
l Excessive drinker-One who driiks two or more times a month (or the equivalent number of
times a year) and whose pure alcohol intake is 120 cc or more (if male) or 60 cc or more (if female) dur- ing a single day or single sitting.
l Alcoholic-One who has any of the following
symptoms: inability to abstain from drinking, in-
ability to stop drinking, or withdrawal symptoms.
l Former drinker-One who was a moderate
drinker, an excessive drinker, or an alcoholic, but who has abstained from
ages for a year or more.*
drinking alcoholic bever- The work providing these definitions also states that light or moderate withdrawal symp- toms (including anxiety, anxious expectation, depression, slight trembling, insomnia, sweat- ing, or indigestion) do not indicate alcoholism when they appear only after cultural crises such as those occurring on Easter Week, New Year’s Eve, or saints’ days. It also notes that the alcohol intake levels used to categorize male and female drinkers (120 cc versus 60 cc) are different because of basic differences be- tween men and women. Not only do women usually weigh less, but a larger share of the female body is given over to fatty tissues. So pound for pound, women’s bodies contain about a third less of the water-bearing tissues in which alcohol dissolves. These factors, taken together, provide the basis for using dif- ferent alcohol intake levels to distinguish be- tween moderate and excessive drinking among men and women (4).
Overall, the questionnaire interviews indi-
398 PAHO BULLETIN l vol. 17, no. 4, 1983
cated that a total of 3 14 subjects subsequently given medical examinations were possible al- coholics. However, the medical examinations only confirmed the alcoholic status of 264. In 44 cases this failure to confirm the subject’s classification related to whether or not the per- son was able to stop drinking after having started. The subjects involved-who were later classified as excessive drinkers-general- ly told their interviewers about a compulsive urge to keep drinking during a weekend of heavy drinking; but they generally indicated during the subsequent medical consultation that they were able to stop drinking voluntari- ly. The consultations also indicated that an- other six possible alcoholics had abstained for a year or more, and these six were accordingly reclassified as former drinkers.
In order to see how the status of excessive drinkers changed, an additional survey was conducted in many of the study areas approxi- mately one year after the first. The first and second stages of this second survey were essen- tially the same as those of the initial survey. However, because of funding limitations, the medical examination of those reclassified as possible alcoholics was replaced with an inter- view by nonmedical personnel trained for this purpose. The difficulty of monitoring exces-
sive drinkers residing in very remote jungle or mountain areas caused various cantons with such areas to be excluded, so long as this did not adversely affect representation of all the national regions represented in the original sample.
This survey of excessive drinkers was per- formed in two phases. The first included seven of the original 18 cantons and 275 study sub- jects classified as excessive drinkers. The sec- ond enlarged the area covered to 12 cantons containing 376 subjects previously classified as excessive drinkers. Of these 376 subjects (72 per cent of all subjects originally classified as excessive drinkers), 13 refused to be inter- viewed a second time, 91 could not be located, and 10 did not provide adequate data, so that in all 262 subjects were interviewed.
Results
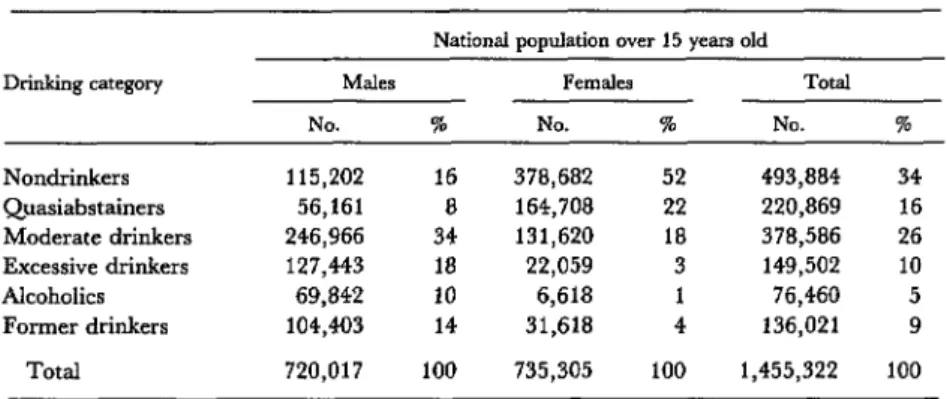
Patterns of alcohol consumption among the survey subjects, by age and sex, are shown in Table 1; and a projection, based on these find- ings, of the national population’s drinking patterns is shown in Table 2. The percentages of people in the different drinking categories are not precisely the same in the two tables be- cause it was necessary to weight the results to
Table 1. Drinking categories of survey subjects, by age group and sex.
Drinking category
Males (%)a Females (%)b
529 30-44 245 s-i9 30-44 245
years years years Total years years years Total
Nondrinkers Quasiabstainers Moderate
drinkers
Excessive
drinkers Alcoholics Former drinkers
Total
25.4 6.2 12.3 17.4 52.6 49.1 65.7 55.1
9.0 4.3 4.3 6.6 21.2 20.9 19.4 20.7
35.2 30.8 26.6 31.9 17.5 18.1 8.9 15.4
19.6 5.2 5.6 100.0 n: 1,207
21.2 10.8 17.6 4.1 3.8 0.7
16.6 13.4 10.0 0.4 1.3 1.0
20.9 32.6 16.5 4.2 6.8 4.3
100.0 100.0 100.0 100.0 100.0 100.0 n: 561 n: 657 n: 2,425 n: 1,391 n: 708 n: 720
3.2 0.7 4.9 100.0 n: 2,819’ aFor columns 1-4, X2 =
bForcolumns X’
Mip&?.Z l ALCOHOL CONSUMPTION IN COSTA RICA 399
Table 2. Estimated drinking patterns in Costa Rica, as indicated by the eighteen-canton
survey results, weighted for the size of local populations on 1 January 1982 as indicated by census data.
National population over 15 years old
Dlialdng category Males FclrK& Total
NO. % NO. 5% NO. I
Nondrinkers 115,202 16 378,682 52 493,884 34
Quasiabstainers 56,161 8 164,708 22 220,869 16
Moderate drinkers 246,966 34 131,620 18 378,586 26 Excessive drinkers 127,443 18 22,059 3 149,502 10
Alcoholics 69,842 10 6,618 1 76,460 5
Former drinkers 104,403 14 31,618 4 136,021 9
Total 720,017 100 735,305 100 1,455,322 100
reflect population growth during the two-year survey period (5-21) in order to arrive at a uniform national projection. Accordingly, es- timates of the male and female populations 15 years of age and over in all of the study com- munities as of 1 January 1982 were obtained from the Statistics and Census Bureau, and the results in each community were weighted in accord with these population figures to pro- vide the projection shown in Table 2. This projection did not include any of the other variables covered in the survey (education, marital status, socioeconomic status, or occu-
pation) because appropriate census data in- cluding these variables were not available.
As Tables 1, 3, 4, and 5 clearly show, male survey subjects seemed far more likely to have alcohol problems than did their female coun- terparts; this was especially true of males with limited schooling and those who were un- skilled workers.
Tables 1, 3, and 5 also point to markedly higher levels of moderate drinking among younger women, women with more schooling, and working women-signalling a noteworthy shift away from women’s traditional status as nondrinkers among members of younger generations.
The data in Table 6, based on the repeat survey of subjects classified as excessive drink- ers, indicate that some 10 per cent of these subjects had become physically dependent
Table 6. Drinking categories of subjects previously classified as excessive drinkers, upon reclassification
one year after the initial survey.
New drinking or other category
Abstainers and quasiabstainers Moderate drinkers
Excessive drinkers Alcoholics Refused interview Not located Incomplete dataa
Total
% of total (n: 376)
3.7 22.1 33.8 10.1 3.5 24.7 2.1 100.0 ?Subjects yielding incomplete data included six yielding in- complete or suspect information, one who was incapacitated, and one who had died.
upon alcohol within a year of the initial sur- vey.
Table 7 shows the various kinds of alcoholic beverages regularly consumed by the subjects classified as excessive drinkers and alcoholics. These figures show a tendency for the alco- holics to be somewhat less selective about what they drink.
Table 3. Drinking categories of survey subjects, by educational level and sex. Those in each of the intermediate educational levels were enrolled at that level or had completed that level (without proceeding further) at the time their formal education stopped.
Drinking category
Nondrinkers Quasiabstainers Moderate drinkers Excessive drinkers Alcoholics Former drinkers
None 7.3 2.8 18.3 13.8 16.5 41.3
Males (%)a Formal education Primary Se~pJT
School c University 15.1 22.0 15.3
4.0 9.6 a.7
26.6 35.1 46.0 17.9 17.9 17.0
13.0 6.9 6.3
23.4 8.5 6.7
Total None 17.4 59.5 6.6 17.4 31.9 a.3 17.6 3.3 10.0 1.6 16.5 9.9
Females (%)b Formal education Primary
School Sg;d:do4ry 0 University Total
61.6 51.7 38.9 55.1
18.2 23.2 23.4 20.7
10.7 17.4 30.2 15.4
2.7 3.7 3.3 3.2
1.3 0.1 0.3 0.7
5.5 3.9 3.9 4.9
Total 100.0 100.0 100.0 100.0 100.0 100.0 100.0 100.0 100.0 100.0
n: 109 n: 1,088 n: 928 n: 300 n: 2,425 n: 121 n: 1,293 n: 1,071 n: 334 n: 2,819 aForcolumns 1-5, X2 = 242 629, 01 <O 001, V = 0 18, and c c = 0.30
bForcolumns 6-10. X2 = 136 305, 01 <0 001, V = 0 12, and c c = 0 21
Table 4. Drinking categories of survey subjects, by marital status and sex.
Drinking category
Sinale
Males (%)a Females (%)b
Marital status Marital status
Separated, Separated,
divorced, divorced,
Married Cohabiting or widowed Total Si”df2 Married Cohabiting or widowed Total
Nondrinkers 26.9 9.9 9.3 13.6 17.4 53.4 56.3 52.1 58.6 55.1
Quasiabstainers 9.2 5.1 3.7 2.5 6.6 20.7 21.6 19.1 17.3 20.7
Moderate drinkers 33.0 31.5 27.3 34.6 31.9 16.6 14.9 14.9 13.4 15.4
Excessive drinkers 17.2 16.7 26.4 11.1 17.6 4.5 2.2 4.2 1.6 3.2
Alcoholics 6.7 12.4 13.9 11.1 10.0 0.9 0.4 0.9 1.6 0.7
Former drinkers 7.0 24.4 19.4 27.1 16.5 3.9 4.6 8.8 7.5 4.9
Total 100.0 100.0 100.0 100.0 100.0 100.0 100.0 100.0 100.0 100.0
n: 1,058 n: 1,070 n: 216 n: 81 n: 2,425 n: 1,098 n: 1,252 n: 215 n: 254 n: 2,819 =Forc&mns 1-5, X2 = 258.388; 01 <O.OOl; V = 0.18; and C.C. = 0.31.
Table 5. Drinking categories of survey subjects, by occupational status and sex.
Occupational status
Drinking category Economically inactive Economically active
Technicians, Executives Fishing, hunt-
employees, and admin- Merchants ing, forestry,
and pm- istrative and Service and agricultur- Other Housewives Students Unemployed fessionals p%WId salespeople workers al workers workers Tot.@
A4ales (%):
Nondrinkers Quasiabstainers Moderate drinkers Excessive drinkers Alcoholics Former drinkers
Total
Femalts (%): Nondrinkers Quasiabstainers Moderate drinkers Excessive drinkers Alcoholics Former drinkers
Total
59.1
20.0 12.3 2.4 0.8 5.4 100.0 n: 1,353
42.8 18.8 12.4 13.1 11.1 16.2 16.3
16.8 6.6 7.5 7.9 6.2 4.9 2.5
32.8 24.6 45.3 34.5 36.7 37.3 28.9
6.8 24.6 14.9 26.2 18.6 18.4 18.6
0.4 11.5 8.7 8.9 11.5 7.6 11.3
0.4 13.9 11.2 9.4 15.9 15.6 22.4
100.0 100.0 100.0 100.0 100.0 100.0 100.0
n: 280 n: 122 n: 161 n: 191 n: 226 n: 185 n: 318
58.4 26.6 11.9 1.4 1.7 100.0 n: 293
48.0 12.3 19.2 9.6 2.7 8.2 100.0 n: 73
39.6
20.7 31.6 4.0 4.1 100.0 n: 222
41.2 48.9 56.4
25.7 25.5 16.1
26.5 15.4 16.4
2.2 5.1 5.7
0.7 0.7 0.9
3.7 4.4 4.5
100.0 n: 136
100.0 n: 137
100.0 n: 335
50.0 10.0 30.0 10.0 100.0 n: 10
12.7 17.5 4.8 6.7 29.0 32.4 20.5 18.4 13.9 10.1 19.1 14.9 100.0 100.0 n: 742 n: 2,225
49.0 54.9
402 PAHO BULLETIN l vol. 17, no. 4, 1983
Table 7. Types of drinks consumed by drinkers and excessive drinkers, according to responses to the survey questionnaire.
Drinking category
Beer
% of subjects who reported drinking indicated beverage Contraband
GILWO Rum Gin Whiskey kP=J0
Other beverages
Excessive drinkers 69.0 16.1 28.1 3.3 11.8 0.8 2.9
Alcoholics 60.6 46.6 20.5 8.3 9.1 5.7 3.8
Table 8. Reasons cited by former excessive drinkers and alcoholics for abstaining from alcoholic beverages.
Reason cited for Excessive Alcoholics abstinence drinkers (%) (%) Abstinence prescribed
by doctor Health problem Participation in
Alcoholics Anonymous Family pressure Religious prohibition Economic problems No informationa
Total
1.4 3.6
31.2 29.4
1.4 12.2
9.2 6.6
7.8 10.2
3.6 3.0
45.4 35.0
100.0 100.0 (n: 141) (n: 197) aIncludes subjects giving responses such as “I stopped lik- ing it.”
Discussion
Overall, these results (see Table 1) indicate that some 10 per cent of Costa Rica’s popula- tion over 14 years of age are excessive drinkers and another 5 per cent are alcoholics. A previ- ous study of Chilean drinking patterns (22) has indicated a similar prevalence of excessive drinkers and alcoholics in that country.g However, nondrinkers and quasiabstainers accounted for only about 20 per cent of the total population in Chile (as compared to
some 50 per cent in Costa Rica), while rough- ly 60 per cent of those studied were moderate drinkers. This suggests that the hard liquors (most notably ordinary rum and a locally pro- duced rum called “guaro “) commonly con- sumed in Costa Rica tend to have a stronger polarizing effect on public attitudes and drink- ing habits- as well as a more dramatic bio- social impact-than does the wine commonly consumed in Chile. Since it was also found (24) that 15.2 per cent of those classified as ex- cessive drinkers in Chile became alcoholics over a three-year period (as compared to 10 per cent over a one-year period in Costa Rica) there is some evidence of a stronger trend to- ward alcoholism among excessive drinkers in Costa Rica.
As already noted, the Costa Rican data also show sharply differing drinking patterns among men and women. The high percent- ages of women in the nondrinker and qua- siabstainer categories (see Tables 1 and 2) contrasts sharply with the low percentages of men in those categories; and the percentages of men in the moderate drinker, excessive drinker, and alcoholic categories are likewise sharply higher than the percentages of women in those categories. Previous studies carried out in Latin America have found considerably lower prevalences of alcoholism among wom- en than among men (2.9, and these findings
M&wz 9 ALCOHOL CONSUMPTION IN COSTA RICA 403
are obviously supported by our study. This phenomenon has been attributed to the “dou- ble standard” whereby masculine drinking excesses are judged far less strictly than femi- nine drinking excesses, and also to the tradi- tional role of ethyl alcohol as a symbol of viril- ity (26).
The prevalence of abstinence among the male Costa Rican population was found to be highest among very young subjects (those 15 to 17 years old). This, however, is presumably a transitory level of abstinence, and one that should not be taken as an indicator of future behavior. In this vein, it should be noted that the average age of excessive drinkers was about 31 years (with a standard deviation of f 12 years) and that of alcoholics was about 40 years (with a standard deviation of f 13 years).
As previously mentioned, younger women showed less of a tendency than older women to be nondrinkers-a trend that can be seen clearly by comparing the prevalences of non- drinking among those above and below the age of 45 (Table 1). Another correlation, seen in both males and females, between moderate drinking and education can be viewed, in the case of women, as a sign of erosion of tradi- tional feminine behavior patterns (27) and also as a response to the social pressures im- plicit in assuming a new social status (see Table 3). The fact that housewives reported substantially lower levels of drinking, on the average, than working women (see Table 5) tends to support this theory.
Regarding marital status (Table 4), un- married men living with women showed more of a tendency to drink excessively than did either their single or married counterparts. In contrast, the prevalences of alcoholism were quite similar among cohabiting, married, and separated males. Marital status was not found to have any strong association with the preva- lences of female nondrinkers and quasiab- stainers. But excessive drinking was some- what more prevalent in unmarried (single or cohabiting) women than among married or
formerly married women. On the other hand, the prevalence of alcoholism appeared to be somewhat higher among formerly married (separated or divorced) women than among women in other groups (28).
In contrast to moderate drinking (most prevalent among the better-educated), rela- tively high prevalences of alcoholism were found among those with the least education (see Table 3). Similarly, as Table 5 shows, relatively high prevalences of alcoholism and excessive drinking were found among unem- ployed men and women. In this connection, it
seems appropriate to cite observations made by other studies that point to a greater preva- lence of alcoholism and alcohol-related prob- lems among economically disadvantaged pop- ulation sectors (2.5).
Within the economically active male popu- lation, the highest prevalences of excessive drinking and alcoholism were found among executives and administrative personnel, mer- chants and salesmen, and other nonservice workers. And within the economically active female population, the highest prevalences of alcoholism and excessive drinking were found among merchants and saleswomen, service workers, and a small number of outdoor workers. It should be noted, however, that in the case of men the differences between the various categories of actively employed sub- jects were rather small, and in the case of women the number of outdoor workers was not sufficient to permit a meaningful assess- ment.
404 PAHO BULLETIN l vol. 17, no. 4, 1983
Among other things, this could reflect the al- coholic’s urgent need to satisfy his body’s de- mands for liquor, a compulsion that by defini- tion has not come to regularly afflict the ex- cessive drinker.
The most salient characteristic of the aver- age alcoholic diagnosed by the survey was a loss of the ability to control alcohol consump- tion. This type of problem, sometimes re- ferred to as “compulsive” (Gamma) alcohol- ism, involves complete loss of the ability to control drinking behavior after taking a drink
(29,30). In our survey, nearly three-quarters of the alcoholics reported having a problem of
this kind.
Regarding former drinkers who had been moderate or excessive drinkers or alcoholics, many of them said their abstinence resulted
from “health problems,” most of which arose from the physical and mental difficulties as-
sociated with alcohol deprivation. Consider-
able numbers of former alcoholics attributed their abstinence to religious bans on drinking
or to membership in Alcoholics Anonymous.
SUMMARY
A nationwide survey of drinking patterns in Costa Rica was conducted from July 1980 through July 1982. Its aim was to determine the extent of
alcoholic beverage consumption within a repre- sentative sample of 5,244 interview subjects and to use this information in an attempt to assess drink- ing patterns within the country as a whole.
The results of this survey showed that male sub- jects were far more likely to have alcohol problems
than were their female counterparts; this was es- pecially true of unskilled workers and those with lit- de or no formal education. However, the survey also indicated a shift in female drinking patterns, with moderate drinking being notably more com- mon among women under 45 years old, especially those with a university education and jobs, than it was among older women.
A majority of the heavy drinkers interviewed said they commonly drank beer. However, significant numbers also consumed hard liquor-mostly ordi- nary rum and a locally produced rum called “‘gu- ro. ” The fact that wine-drinking was relatively rare could help account for the relatively small propor-
tion of moderate drinkers found in Costa Rica as compared to the proportion in countries like Chile, where wine makes up a large share of total national consumption.
Overall, the survey indicated that some 5 per cent of all Costa Rican adults over 14 years of age were alcoholics, while another 10 per cent could be classified as “excessive” drinkers. A subsequent survey of subjects initially classified as excessive drinkers indicated that some 10 per cent of them became alcoholics within a year. The most typical characteristic of those classified as alcoholics was the utter inability to stop drinking after having taken a drink-a problem found to afflict some three-quarters of the alcoholic subjects interviewed.
M&.&Z l ALCOHOL CONSUMPTION IN COSTA RICA 405
ANNEX 1. SURVEY QUESTIONS
The following are tranrkatiom of the entriks from the portion of the Spanish surucy questionnaire used to dejine each subject’s drinking status. The actual questionnaire form provided /&aces for recording the responses of the interview subjxt, an infomzant, and a physician.
Question
No. Question
32 33
34 35
36
37
38 39 40
41
42 43
44 45 46 47 48 49
50
51
Do you drink any kind of alcoholic beverage? (yes or no)
How long has it been since you have had a drink? (have never drunk, - months, - years; if “have never drunk,” skip remaining questions in this section) Why are you not driing at present? Why did you not drink in the past? (list reasons) How often do you take some kind of drink? (once a year, four or five times a year, twice
a month, every weekend, all the time)
What kind of liquor do you usually drink? (beer, guano, rum, gin, whiskey, contraband guaro, others-specify)
How much do you drii at one sitting? (No. of beers, No. of liters, No. of bottles, No. of quarts, No. of single servings, No. of double shot-glasses, No. of pints, depending on type of beverage consumed)
How many hours are usually occupied by a single sitting? Have you ever been drunk? (yes, no; if no, skip to question 41)
How often does this occur? (three or four times a year, once a month, twice a month, more than twice a month)
When you drink, do you have to continue because a powerful urge to do so arises? (yes, no; if no, skip to question 43)
In that case, how do you make yourself stop? (list ways)
Some people drink continually, stop a few hours, and then go on again, proceeding for months in this way. Does that happen to you? (yes, no)
Have you ever gone on a bender? (yes, no; if no, skip to question 47) How long has the bender lasted?
How many times a year does this happen?
Can you go without a drink for four or five days without difficulty or distress? (yes, no) Do you get a hangover after drinking? (yes, no; if no, skip to question 50)
How do you cure it? (with a drink, with medication, by waiting for it to pass, by other methods-specify)
Several hours after you have stopped drinking, do you experience a cold sweat (yes, no), anxiety or “jitters” (yes, no), insomnia or difficulty sleeping (yes, no), depres- sion or “the blues” (yes, no), trembling (yes, no), nausea or the urge to vomit (yes, no), vomiting (yes, no), diarrhea (yes, no), convulsions or “blackouts” (yes, no), hallucinations or “seeing things” (yes, no). If no to all, skip question 51.
406 PAHO BULLETIN . vol. 17, no. 4, 1983
REFERENCES
(1) Chassoul, C., and I. Morales. Encuesta na- cional de habitos de ingestion de alcohol. Instituto National sobre Alcoholismo; San Jose, 1970.
(2) Marconi, J. Informe sobre la asesorfa brin- dada al Instituto National sobre Alcoholismo en la organization de 10s servicios a nivel comunitario O.P.S., 19 al 30 de noviembre de 1979. Oficina Sa- nitaria Panamericana, San Jose, 1979.
(3) Miguez, H. A. Ingestion de alcohol en Costa Rica: Consideraciones acerca de la ingestion de al- cohol en Costa Rica. Instituto National sobre Al- coholismo; San Jose, 1980.
(4) Marconi, J. Deiiniciones basicas para un programa integral de control y prevention de al- coholismo en Costa Rica. Instituto National sobre Alcoholismo, San Jose, 1979.
(5) Instituto National sobre Alcoholismo, De- partamento de Investigation. El alcoholismo en el * canton de Desamparados (A.P.). San Jose, 1981.
(6) Instituto National sobre Alcoholismo, De- partamento de Investigation. El alcoholismo en la ciudad de Golfito. San Jose, 1981.
(7) Instituto National sobre Alcoholismo, De- partamento de Investigation. El alcoholismo en la ciudad de Liberia. San Jo&, 1982.
(8) Instituto National sobre Alcoholismo, De- partamento de Investigation. El alcoholismo en 10s cantones de Orotina y San Mateo. San Jo&, 1982.
(9) Instituto National sobre Alcoholismo, De- partamento de Investigacidn. El alcoholismo en el distrito central de Puntarenas. San Jose, 1981.
(IO) Instituto National sobre Alcoholismo, De- partamento de Investigation. El alcoholismo en ciudad Quesada. San Jose, 1982.
(11) Instituto National sobre Alcoholismo, De- partamento de Investigation. El alcoholismo de1 canton de Santa Cruz (A.P.). San Jose, 1981.
(12) Instituto National sobre Alcoholismo, De- partamento de Investigation. El alcoholismo en la ciudad de San Isidro de El General. San Jose, 1981. (13) Instituto National sobre Alcoholismo, De- partamento de Investigation. El alcoholismo en la ciudad de Alajuela. San Jose, 1983.
(14) Instituto National sobre Alcoholismo, De- partamento de Investigation. El alcoholismo en la zona rural de1 canton de Desamparados (A.P.). San Jose, 1983.
(15) Instituto National sobre Alcoholismo, De- partamento de Investigation. El alcoholismo en la ciudad de Heredia. San Jose, 1983.
(16) Instituto National sobre Alcoholismo, De- partamento de Investigation. El alcoholismo en el canton de Parrita (A.P.). San Jo& 1983.
(17) Instituto National sobre Alcoholismo, De- partamento de Investigaci&. El alcoholismo en la ciudad de Quepos. San Jose, 1983.
(18) Instituto National sobre Alcoholismo, De- partamento de Investigation. El alcoholismo en el canton de Upala (A.P.). San Jose, 1983.
(19) Miguez, H. A. El alcoholismo en la ciudad de Limon. Instituto National sobre Alcoholismo, San Jose, 1980.
(20) Miguez, H. A. El alcoholismo en el canton de Matina (A.P.). Instituto National sobre Alco- holismo, San Jose, 1980.
(21) Miguez, H. A. El alcoholismo en el canton de Talamanca (A.P.). Instituto National sobre Al- coholismo, San Jose, 1980.
(22) Marconi, J. Alcoholismo. In: R. Armigo. Epidemiologia. Inter-Midica, Buenos Aires, 1976, p. 483.
(23) Marconi, J. Definiciones basicas. In: Adis Castro, Juan Marconi, and JosC Horwitz. Epidemio- lo&a de1 alcoholismo en Am&a Latina. Editorial Acta, Buenos Aires, 1967, p. 18.
(24) Marconi, J. Personal communication, Ja- nuary 1983.
(25) Negrete, J. C. El alcohol y las drogas coma problemas de salud en America Latina. Bol Of Sanit Panam 81(2):158-175, 1976.
(26) Alonso, F. Alcohol dependencia. Pirhmide, Madrid, 1981.
(27) Alonso, F. Alcohol dependencia. Pirrimide, Madrid, 1981, p. 161.
(28) Feverhake, O., et al. Alcoholismo femeni- no. In: Alcoholismo-II Congreso Iberoamericano de alcohol y alcoholismo. Asociacion Iberoamerica- na de Estudio de 10s Problemas de Alcohol. Santia- go, Chile, 1981.
(29) Jellinek, E. The Disease Concept ofAlcoholism. Hillhouse Press, Highland Park, N.Y., 1960.