ABSTRACT
Statistical methods for assessing agreement
Sonia VIEIRA1, José Eduardo CORRENTE2
1- PhD, São Leopoldo Mandic Dental Research Center, Campinas, SP, Brazil.
2- PhD, Department of Biostatistics, Institute of Biosciences, State University of São Paulo - UNESP, Botucatu, SP, Brazil.
Corresponding address: José Eduardo Corrente - Departamento de Bioestatística - IB - UNESP - Botucatu - Distrito de Rubião Jr, s/n - 18618-900 - Botucatu - São Paulo - e-mail: [email protected]
!
S
tatistical analysis of data is crucial in cephalometric investigations. There are certainly ! " #$ % &' ' ( ' ) to in Orthodontics and Facial Orthopedics as the Dahlberg error, can be calculated only for estimating precision if accuracy is already proven. When double readings are collected, ' differences of readings should be presented and outliers discussed.Key words: Measurements. Orthodontics. Errors.
INTRODUCTION
Clinical measurements are generally imprecise because they cannot be measured directly (such )+ (such as knee joint circumference). Hence, different methods of measuring the same phenomenon or on different types of physical records have been / universal, double readings of the same quantity by the same method and the same operator in are advised.
0
by the same method on the same material and under the same condition (same operator, same apparatus, same setting and same time). Reproducibility is the closeness of agreement
method on identical testing material, but under different conditions (different operator or different apparatus or different setting or different time). Lack of precision means that repeated measures spread out or scattered.
In Orthodontics, locating the same point on the same image in repeated acts of landmark location
$!7 (1974),
in a classical paper, compared the positions of 15 landmarks calculated by the same observer taken consecutively on each of 25 children and " $ emphasized by Houston, et al.4 (1986). According
CR=1.96x
6
(
d-d)
2
n
-1
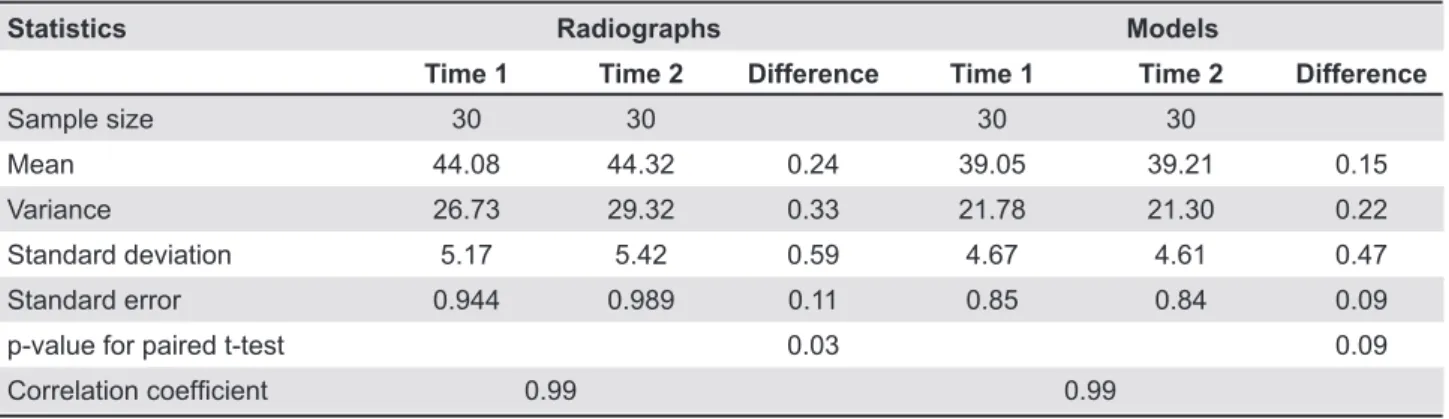
Statistics Radiographs Models
Time 1 Time 2 Difference Time 1 Time 2 Difference
Sample size 30 30 30 30
Mean 44.08 44.32 0.24 39.05 39.21 0.15
Variance 26.73 29.32 0.33 21.78 21.30 0.22 Standard deviation 5.17 5.42 0.59 4.67 4.61 0.47
Standard error 0.944 0.989 0.11 0.85 0.84 0.09
p-value for paired t-test 0.03 0.09
&RUUHODWLRQFRHI¿FLHQW 0.99 0.99
Table 1- Data analysis for upper-arch length projected onto the midsagittal plane in millimeters measured from models and cephalometric radiographs, each on two separate occasions (in mm)
Source: Houston5 (1983)
cephalometric measurements three times using 40 digital radiographs and concluded that differences the cephalometric measurements analyzed. Hence, repeatability must be evaluated.
On the other hand, different methods of measuring the same phenomenon need to be carefully compared. So, reproducibility must be studied.
Battagel1 :;<<=+
to the assessment of measuring cephalometric radiographs and provided some suggestions for estimating all types of errors. Martelli Filho, et al.6
(2005) studied statistical methods for evaluating reproducibility of quantitative measurements in Orthodontics and also offered many suggestions.
repeatability needs to be assessed, a control chart for means should be set up if a patient’s records are practice. A control chart gives limits of agreement, $ > ) $ ? ##$ Bland and Altman2 (1986) should be set up.
MATERIAL AND METHODS
The data used in this study are from Houston5
:;<@=+ repeatability, reproducibility or precision in Orthodontics are mentioned. For analyzing repeatability, Houston5 (1983) used Pearson’s
# in Table 1.
In this paper, scatter plots and regression lines ( # #
J K standard deviations of the means assuming that ) popularized in Orthodontics and Facial Orthopedics "
RESULTS
' K; K N > zero (p=0.0736 for radiographs and p=0.2854 for + ; :UVVXV;+ for models (p=0.3821).
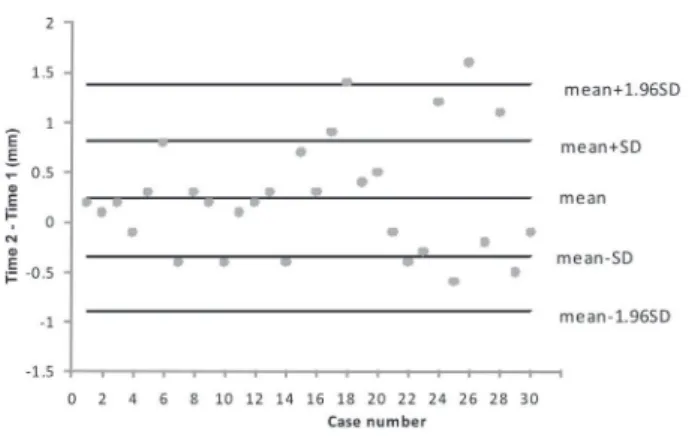
Control charts for the mean of the differences K 3 and for models in Figure 4. An error analysis / Y midsagittal plane in millimeters measured from models and cephalometric radiographs are given in Table 2. Coefficients of repeatability7
%
(1)
Statistics Radiographs Models
Mean of difference between readings 0.24 0.15 &RQ¿GHQFHLQWHUYDOORZHUOLPLW 0.04 -0.02
&RQ¿GHQFHLQWHUYDOXSSHUOLPLW 0.45 0.32 &RHI¿FLHQWRIUHSHDWDELOLW\ 1.13 0.92
Number of points in the warning zone 9 6
Number of out-of-control points 2 2
Table 2- Error analysis for upper-arch length projected onto the midsagittal plane in millimeters measured from models and cephalometric radiographs
Figure 1- Double readings of radiographs with the line of equality
Figure 2- Double readings of models with the line of equality
Figure 3- Control chart for the mean of differences between radiographs readings
Figure 4- Control chart for the mean of differences between models readings
DISCUSSION
; look impressive, but they do not mean agreement. ' % ^U_ points lie along any straight line. For radiographs, V<<`;
; / 5
:;<@=+ ) % for better results. Houston5 (1983) also calculated
measurements (Time 1 and Time 2) from models V<w; of radiograph enlargement is approximately 13%.
A control chart for analyzing errors in double readings is a better statistical tool, since it is used to detect excessive process variability. It serves to expected, that means, an average not different from zero and, even considering the natural repeatability small in relation to the measurement taken.
>
1 2@
V
> @
1V
> @
22
V
2V
V
X
r
X
X
X
n
d
s
X2
2¦
[;<\ Z" ) differences out of these limits are out-of-control points. Out-of-control points are uncertain and a risk of adverse results in treatment or diagnosis. Therefore, the clinician should look for them and ) considering they should be zero. Number of points ) # # N measuring upper arch length projected onto the midsagittal plane. It has to be noted that averages both from radiographs and models are above zero and there are out-of-control points more than 2 SD far from means.
It has to be pointed out that many papers consider precision can be estimated by a statistic $ K
under the name of Dahlberg error3>$
distributed random variables, sums or differences ) variance:
(2)
If a large number of readings are performed by the same operator and the same method on the same material (such as a blood sample or an oil sample), it can be assumed that measurements are distributed closely to the true value. If readings are performed in duplicates and the difference $ from the same probability curve. When another duplicate is read by the same method and the same operator on another sample of the same material, chosen at random from another probability curve of the same type as that of the previous one. By continuing the process, a series of differences is obtained that conforms to the series of differences probability curve. Under such circumstances, an estimate of the standard deviation is calculated by adding the squares of the differences (because ) + the number of differences (because the variance of the difference is 2V2) and extracting the root of the
(3)
This estimate of the standard deviation is a measure of dispersion (and, inversely, precision)
material (a standard practice in laboratories, identically distributed variables). This is not $ are performed on the same radiograph. Therefore, radiographs taken from different patients not only imply measurement errors, but also take into account the variability of patients.
' Dahlberg equation is s
x=0.437 mm for radiographs
and s
xUV=X`
> ( provided, the uncertainty of the measurement can be tested by an F-test. On the other hand, it is easy to interpret that the expected percent of [Z" =w and approximately 27% for models.
CONCLUSION
In the study of repeatability, neither the is appropriate. The standard deviation Dahlberg3
:;<X\+ $ readings are independent and identically distributed
) cephalometric investigations.
REFERENCES
1- Battagel JMA. Comparative assessment of cephalometric errors. Eur J Orthod. 1993;15:305-14.
2- Bland JM, Altman DG. Statistical methods for assessing 1986;8:307-10.
3- Dahlberg G. Statistical methods for medical and biological students. 2nd^ $> ;<X\
4- Houston WJ, Maher RE, McElroy D, Sherriff M. Sources of error in measurements from cephalometric radiographs. Eur J Orthod. 1986.8:149-51.
5- Houston WJB. The analysis of errors in orthodontic measurements. Am J Orthod. 1983;5:382-90.
\# ! ' K ! ' K (' statistical methods to evaluate reproducibility. Rev Dent Press Ortodon Ortop Facial. 2005;10:122-9.