ABSTRACT
www.scielo.br/jaos
http://dx.doi.org/10.1590/1678-775720140319
Evaluation of protein undernourishment on the
condylar process of the Wistar rat mandible
correlation with insulin receptor expression
Marcelo Arthur CAVALLI1, Aline GONÇALVES1, Joice Naiara Bertaglia PEREIRA1, Jodonai Barbosa da SILVA1, Silvia de Campos BOLDRINI2, Edson Aparecido LIBERTI3
1- Department of Surgery, Faculty of Veterinary Medicine and Animal Science, University of São Paulo, São Paulo, SP, Brazil.
2- (In memoriam) Laboratory of Functional Anatomy Applied to Clinical and Surgery, Department of Anatomy, Biomedical Science Institute, University of São Paulo, São Paulo, SP, Brazil.
3- Laboratory of Functional Anatomy Applied to Clinical and Surgery, Department of Anatomy, Biomedical Science Institute, University of São Paulo, São Paulo, SP, Brazil.
Corresponding address: Marcelo Arthur Cavalli - Laboratório de Anatomia Funcional, Departamento de Anatomia, Instituto de Ciências Biomédicas – Universidade de São Paulo – São Paulo – SP – Brazil - Fax +551130917226 - e-mail: [email protected]
Submitted: August 19, 2014 - Modiication: December 2, 2014 - Accepted: December 3, 2014
T
he mandible condylar process cartilage (CP) of Wistar rats is a secondary cartilage and acts as a mandibular growth site. This phenomenon depends on adequate proteins intake and hormone actions, including insulin. Objectives: The present study evaluated the morphological aspects and the expression of the insulin receptor (IR) in the cartilage of the condylar process (CP) of rats subjected to protein undernourishment. Material and Methods: The nourished group received a 20% casein diet, while the undernourished group (U) received a 5% casein diet. The re-nourished groups, R and RR, were used to assess the effects of re-nutrition during puberty and adulthood, respectively. CPs were processed and stained with picro-sirius red, safranin-O and azocarmine. Scanning electron microscopy and immunohistochemistry were also performed. Results: The area of the CP cartilage and the number of cells in the chondroblastic layer decreased in the U group, as did the thickness of the CP layer in the joint and hypertrophic layer. Renourishment during the pubertal stage, but not during the adult phase, restored these parameters. The cell number was restored when re-nutrition occurred in the pubertal stage, but not in the adult phase. The extracellular matrix also decreased in the U group, but was restored by re-nutrition during the pubertal stage and further increased in the adult phase. IR expression was observed in all CPs, being higher in the chondroblastic and hypertrophic cartilage layers. The lowest expression was found in the U and RR groups. Conclusions:Protein malnutrition altered the cellularity, the area, and the ibrous cartilage complex, as
well as the expression of the IRs.
Keywords: Mandibular condyle. Protein malnutrition. Wistar rats. Insulin receptor.
INTRODUCTION
Craniofacial growth and development stem from a constant process of remodeling and sutural bone apposition24 controlled by several factors, such as mechanical, physical and nutritional29. The mandibular condylar process (CP) is a major site of mandibular length and height growth5,14. It is also a determinant of face morphology and in the performance of complex functions such as
chewing and talking2. For growth and developmental processes to occur normally, a balanced intake of proteins is essential. Protein malnutrition alters the
endochondral and intramembranous ossiication
which is considered a growth hormone10, and growth factors similar to insulin (IGFs)15. The activity of insulin becomes compromised during malnutrition, and induces a clinical condition very similar to type 2 diabetes19. Moreover, the complete development of the cartilage tissue is dependent on when malnutrition begins, as well as the cell proliferation stage of the cartilage8. However, the conditions that can effectively promote a resumption of growth and development are still unknown. Thus, the present study aimed at the evaluation of morphological effects of pre- and postnatal protein malnutrition and postnatal re-nutrition on CP growth, as well as insulin receptor (IR) expression in the cartilage of the CP.
MATERIAL AND METHODS
Animals and experimental groups
After approval by the Ethics Committees for the Use of Animals of the Faculty of Veterinary Medicine and Animal Science at the University of São Paulo (protocol nº 2161/2011) and from Biomedical Sciences Institute at the University of São Paulo (protocol nº 075, page 33, book 2/2006), São Paulo, Brazil, male and young female Wistar rats that weighed between 280 and 320 g were mated for 7 days. Two mating groups were formed, separated according to different diets (AIN-93G), with normal protein (20% casein) and low protein (5% casein), prepared according to the protocol of the American Institute of Nutrition20 in a specialized laboratory (Rhoster® – Araçoiaba da Serra, SP, Brazil). Once
pregnancy was conirmed, females were separated
into individual cages and continued to be fed their respective diets, either 20% or 5% casein, in a room with a controlled temperature and under a regular light/dark cycle. These animals were monitored daily for the birth of new litters. To standardize the experiment, only litters with six rat pups from the groups were used. The adoption of this criterion minimized the differences of body masses of the obtained animals and ensured a relatively similar stress level for mothers in both groups. Thus, the only variable experimental factor for this protocol was the type of diet. The mothers were maintained on their respective diets until their cubs completed 21 days of extrauterine life, which was the determined weaning time. Two males from each litter were randomly assigned for experimental standardization, and the animals that were not selected were excluded from the study. In one of the litters of the N group, only one animal was chosen, so that the experiment was standardized according to the number of animals. After this step, the following groups were formed: nourished (N - nourished from day 21 to day 60); undernourished (U - undernourished from day 21 to day 60); renourished (R - renourished from day 21 to day 60); adult nourished, animals from nourished mothers and fed on a 20% casein diet from weaning to 100 days of life (NN - nourished until day 100) and adult re-nourished (RR - renourished from day 21 to day 100), totaling 5 groups (n=3). Thus, pups were euthanized at 60 or 100 days of life, depending on their group (Figure 1).
Collection and processing of CPs
Five male rats of the groups N, U, R, NN and RR were euthanized in a carbon dioxide (CO2) chamber.
The CPs were dissected, ixed in Bouin’s solution for 8 h and decalciied17 for 30 days. After washing in distilled water, the tissues were dehydrated through an ascending series of alcohols (70 to 100%),
diaphanized in xylene and parafin-embedded. Semi-serial sections of 5 μm, in the sagittal plane, were
obtained from the CPs using a microtome (Leica SM 200R, São Carlos, SP, Brazil), mounted on slides
and placed in an oven for deparafinization. The
sections were stained with azocarmine23 to identify and measure cartilage layers thickness (TCPC) and the area of CP cartilage, as well as to quantify the number of cells of the chondroblastic layer. For the
analysis and quantiication of the cartilage matrix
(CM) of the CP, the safranin-O method was used. To evaluate the collagen component, the picro-sirius red method was used. Samples were processed for immunohistochemistry to observe the sensitivity of the IR in CP cartilage and a structural analysis was performed by scanning electron microscopy (SEM) of the CP cartilage.
Morphometry
Four slides, each containing ive sections, were
made with the most central part of the CP cartilage of each animal (n=3) from each group (N, U, R, NN and RR), and the sections were stained using the azocarmine method. Successive mitoses in the chondroblastic zone are the basis of bone growth, so the quantity of cell were counted in this zone; the
cells were identiied and counted by a series of ields
that were sequentially organized across the extent of the section. The cartilaginous zone was also analyzed using imaging software (Axiovision 4.0, Karl Zeiss,
Oberkochen, Germany) coupled to a high deinition
digital camera (AxioCam HRc 12MP, Karl Zeiss, Oberkochen, Germany) to obtain the density of the chondroblastic zone cells. The thickness of each CP layer (articular, prechondroblastic, chondroblastic and hypertrophic zones) was measured.
Four slides, each containing ive sections, were
made from the most central part of the CP cartilage of each animal (n=3) from each group (N, U, R, NN and RR), and the sections were submitted to safranin-O coloration. A test system containing 200
ixed points was superimposed on the images of
the chondroblastic and hypertrophic cartilage layers to count the number of points that coincided with safranin-O positively stained areas.
Four slides, each containing ive sections, were
made with the most central part of the CP cartilage of each animal (n=3) from each group (N, U, R, NN and RR), and the sections were submitted to immunohistochemistry for the IR. The CP cartilage was analyzed with image software and the area of
CP cartilage was measured. The number and density of IR-immunostained cells in the CP cartilage were also measured on the slides.
Immunohistochemical localization of the IR
The IRs of three animals of each group were subjected to immunohistochemical localization. The sample sections were subjected to a decreasing alcohol series (absolute to 50%) for 2 min each and then washed with distilled water for 5 min. The sections were exposed for 5 min to a 3% hydrogen peroxide solution diluted in 100% methanol, washed with picro-sirius red phosphate buffered saline (PBS) solution for 5 min, and incubated in normal goat serum in PBS (1:5 ratio) at room temperature for
30 min. To stain the IR, the anti-insulin Rβ antibody
(C-19; Santa Cruz Biotechnology, Paso Robles, CA, USA) was used. The slides were incubated with the primary rabbit polyclonal antibody for 2 h in a moist chamber at room temperature. Subsequently, they were washed in PBS (4×10 min) and incubated with the secondary biotinylated goat anti-mouse IgG antibody, diluted in PBS (1:200) for 30 min at room temperature. The sections were rinsed with 0.01% Triton diluted in PBS, followed by incubation with Vectastain ABC (prepared 30 min in advance, but refrigerated until used) diluted in PBS (1:100) for 30 min. After a washing with PBS for 5 min, the sections were stained with the chromogen
3,3’-diaminobenzidine (DAB) for 8 min at room
temperature. Then the sections were washed with distilled water for 5 min, dehydrated in an ascending alcohol series (70% to absolute) for 2 min each, and diaphonized in xylene (2×7 min).
To obtain qualitative results on IR localization,
one slide with ive sections and one section of an
animal of each group (N, U, R, NN and UU) were used. The reaction followed the protocol described in the previous section, differing only in the incubation reagent. This slide was incubated in the
luorochrome 4’,6-diamidino-2-phenylindole (DAPI),
which is evidenced by the binding with previously incubated secondary antibody goat anti-mouse IgG biotinylated. The histological slides were analyzed by a high resolution camera using specialized software.
SEM
One CP from an animal in each group was excised and immersed for 8 h at 4°C in a 2.5%
glutaraldehyde modiied Karnovsky solution with
dehydration using an ascending alcohol series (70% to absolute) and a drying in a critical point apparatus
(Balzers CPD-030) using liquid CO2. The sections were placed on metal stubs, covered with gold (Au) and examined with a Zeiss scanning electron microscope (Leo 435 VP).
Statistical analysis
Data were statistically analyzed using ANOVA and
post hoc Tukey’s test was performed. The homogeneity of variance was checked and transformed when
necessary. The signiicance level was p<0.05.
RESULTS
Qualitative analysis
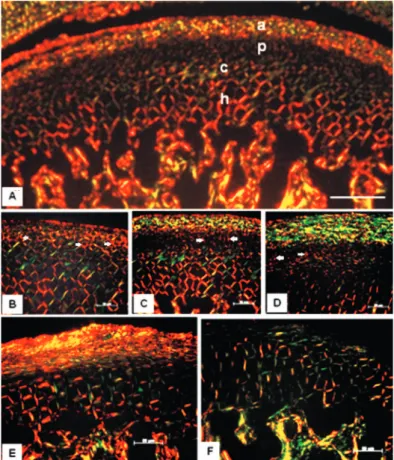
Picro-sirius red
The articular layer of the animals in N and NN
groups consisted primarily of type I collagen ibers,
while in U, R and RR groups this same layer was
predominantly of the type III ibers. There is less
collagen in the pre-chondroblastic layer of the CP cartilage, so in groups N, U and R, type I collagen was also predominant (Figure 2 arrows); however, in groups NN and R there was a balance between type
I and III ibers. The chondroblastic and hypertrophic
layers presented equal proportions of type I and III
ibers in groups N, U, R and NN; however, in the
RR group they were primarily of type III (Figure 2).
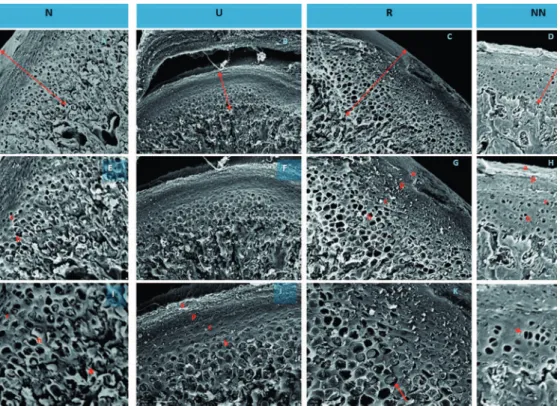
SEM
The organization of the cartilage layers of adult animals was different from that in young animals. In
the N group, the layers were well deined, making
them easily identifiable. Group U layers varied in thickness, and the R group layers recovered their thickness, especially the hypertrophic and chondroblastic layers, while the NN group had the thinnest layers (Figure 3).
Quantitative analysis
Azocarmine
The total area and the quantity of cells in the chondroblastic layer decreased in the U group. These parameters were statistically similar between
groups N and R. The RR group presented a signiicant
decrease in the area and quantity of cells when compared to NN group. The cell density decreased
in the R group and increased signiicantly in the
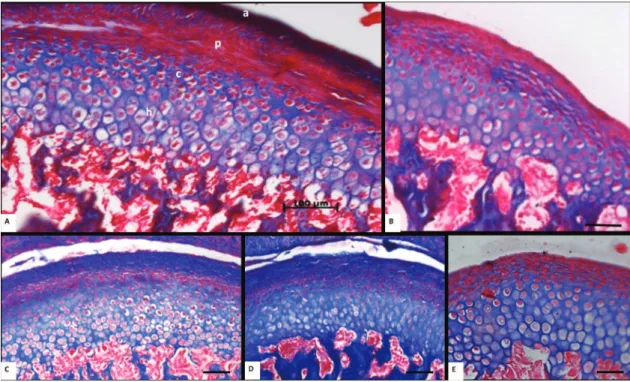
RR group in comparison to groups N and NN, respectively (Table 1). The TCPC decreased from day 60 to day 100, with the hypertrophic layer showing the smallest decrease of all the groups
studied. The TCPC decreased in the U group, in
which it was also dificult to distinguish the layers,
especially those that were pre-chondroblastic. The R group showed an articular layer TCPC that was compatible to, but less comparable with that of the control group (N). However, the pre-chondroblastic layer presented a TCPC of approximately one-third of its counterpart in the N group. The trabecular bone in the subchondral region of the U group was larger than those of the N and R groups. Except for the chondroblastic and hypertrophic layers, the animals in the NN and RR groups had a cell reduction in the
other layers when compared to their counterparts in the N and R groups, respectively. In the NN and RR groups, the trabecular bone in the subchondral region had become denser. In the U group, the TCPC had a decreasing trend in these layers; however, only the articular layer showed a statistically
signiicant decrease. In the R group there was a
54% decrease in the articular layer TCPC (Figure 4). Thus, approximately half of the thickness was not restored with re-nutrition. In turn, the RR group
presented a statistically signiicant decrease in the
thickness of the articular and hypertrophic layers,
Parameters N U R NN RR
Cell number 416.4±79.9 188.8±26.3 325.4±73.0 430.1±94.1 234.9±40.0 U≠N; U≠NN; RR≠NN *
Area (mm²) 0.7±0.1 0.3±0.05 0.7±0.09 0.6±0.1 0.2±0.04 U≠N; S≠R; RR≠N;
RR≠NN; RR≠R *
Density 531±12.3 481±15.9 430±14.3 697±22.0 925±84.3 U≠NN; U≠RR; R≠NN;
R≠RR; RR≠N; RR≠NN* ANOVA* p<0.05
N: nourished from day 21 to day 60; U: undernourished from day 21 to day 60); R: renourished from day 21 to day 60; NN: nourished until day 100; RR - renourished from day 21 to day 100
Table 1- Mean (±SD) cell numbers of chondroblastic layer, cartilage area and cell density of mandible condylar process cartilage (CP) of Wistar rats. SD=Standard Deviation
Figure 3- Scanning electron microscopy (SEM) of the mandible condylar process cartilage (CP) of Wistar rats of groups N, nourished from day 21 to day 60; U, undernourished from day 21 to day 60; R, renourished from day 21 to day 60; and NN, nourished until day 100. A - D: 500X; E - H: 700X; I - L: 1200X
while the thickness of the pre-chondroblastic and
chondroblastic layers had no statistically signiicant
differences among the groups (Figure 5).
Safranin-O
The CM decreased in the U group and was reestablished in the R group. However, in the adult phase of re-nutrition, there was no statistically
significant increase in the percentage of CM compared to the control group (NN) (Table 2).
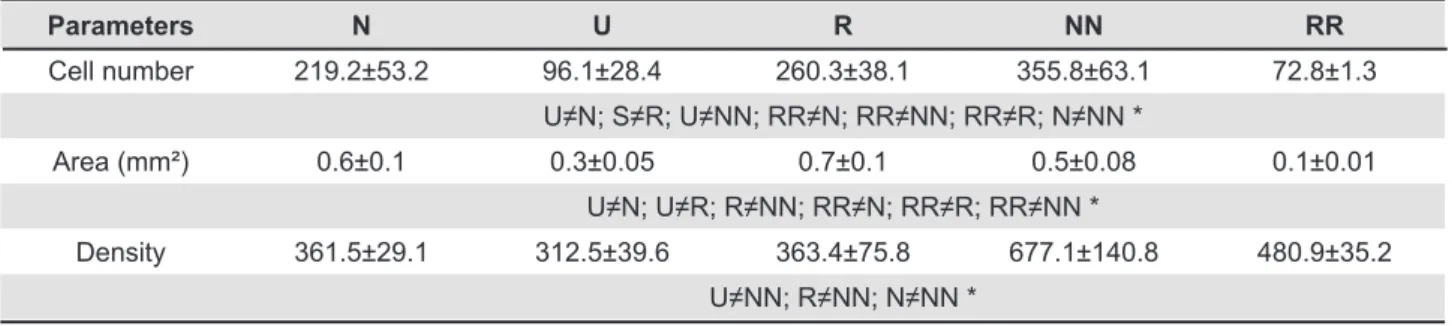
IR
There was a decreased expression of IRs in the malnourished animals. The expression pattern of the N group was restored in the R group; however, the RR group did not restore the NN pattern. The
Figure 4- Analysis of mandible condylar process cartilage layers thickness (TCPC)
N: nourished from day 21 to day 60; U: undernourished from day 21 to day 60); R: renourished from day 21 to day 60; NN: nourished until day 100; RR - renourished from day 21 to day 100
same occurred with the CP cartilage area, where the density of the IR-immunoreactive cells was equivalent among the young adult groups (N, U and R) and between NN and RR groups. However, the latter groups presented the parameter at a much
higher level than in the corresponding young adult groups (Table 3, Figure 6).
An analysis of the subchondral region revealed that there was a decrease in the number of IR-immunoreactive cells in the U group compared to
Parameters N U R NN RR
Cartilage matrix (%) 62.15±6.9 39.3±6.4 55.9±13.7 45.7±5.8 76±12.5 U≠N; U≠R; U≠RR; R≠NN; R≠RR; RR≠N; RR≠NN *
ANOVA*p<0.05
N: nourished from day 21 to day 60; U: undernourished from day 21 to day 60); R: renourished from day 21 to day 60; NN: nourished until day 100; RR - renourished from day 21 to day 100
Table 2- Mean (±SD) of percentage of the cartilage content of the CP layers assessed in Safranin-O stained sections. SD=Standard Deviation
ANOVA*p<0.05
N: nourished from day 21 to day 60; U: undernourished from day 21 to day 60); R: renourished from day 21 to day 60; NN: nourished until day 100; RR - renourished from day 21 to day 100
Parameters N U R NN RR
Cell number 219.2±53.2 96.1±28.4 260.3±38.1 355.8±63.1 72.8±1.3 U≠N; S≠R; U≠NN; RR≠N; RR≠NN; RR≠R; N≠NN *
Area (mm²) 0.6±0.1 0.3±0.05 0.7±0.1 0.5±0.08 0.1±0.01 U≠N; U≠R; R≠NN; RR≠N; RR≠R; RR≠NN *
Density 361.5±29.1 312.5±39.6 363.4±75.8 677.1±140.8 480.9±35.2 U≠NN; R≠NN; N≠NN *
Table 3- Mean (± SD) of the number of immunoreactive insulin receptor (IR) cells; area of the CP cartilage and cell density in the different groups. SD=Standard Deviation
Figure 6- Insulin Receptors (IR) of the mandible condylar process cartilage (CP) of Wistar rats. A - C: IR immunohistochemistry; D - F: IR immunoluorescence. The arrows show the sensitized cells to IR (immunostained) and arrowheads point to cells not sensitized
the N group. The re-nutrition partially restored the number of IR-immunoreactive cells, and the mature adult groups (NN and RR) presented
statistically signiicant similarities in this parameter.
Nevertheless, the smallest subchondral area investigated, which was in the U group, was restored with re-nutrition through day 60 (R); however, it did not last until day 100, with the RR group showing statistically less area than the NN group. Still, the IR cell density of animals in the RR group presented a marked increase compared to NN group. Whereas
N, U and R groups had no statistically signiicant
differences among themselves (Table 4).
DISCUSSION
In this study, the U group was of smaller size and had lower body masses than the N group. Similarly, SEM showed that the CPs of the U group were of smaller size. The smallest quantity of cells in the chondroblastic layer was also found in the U group. Such data, low weight and reduced body size, are
the irst to be noticed during any type of malnutrition
researchand demonstrate that prenatal malnutrition prolonged until the end of puberty causes growth retardation28. However, the cell density remained proportional, both in the number of cells and in the area, since both decreased in N and U groups. This indicates an adaptation of the animal to the imposed nutritional condition, since the tissue preserves its organization to maintain tissue growth16. Regarding
the TCPC, the U group had a signiicant decrease
only in the articulate and hypertrophic layers, compared to the N group. This suggests that there was a priority to preserve the pre-chondroblastic layer, in which there is a predominance of cell multiplication, and the chondroblastic layer, which is responsible for the secretion of the CM. That is, even though all of the cartilage suffered the effects of starvation, at this stage there is still an attempt to resume its growth. The organization of the layers was maintained in the U group, which suggests a preference for bone formation that occurs in healthy
animals during the pubertal phase. Recovery of the cartilage area and the number of cells of the chondroblastic layer were observed in the R group, with resumed cartilage growth during re-nutrition (in both size and cellular composition), possibly due to the restoration of the protein content while still in the pubertal phase. The organization of the layers of the R group was resumed, with the maintenance of TCPC, consistent with what was observed for the N group. In the U group, in addition to a decrease in the TCPC, a predominance of type III collagen
ibers, especially in the articular layer, demonstrates
a delayed maturation of this region when subjected to malnutrition. Thus, it appears that the articulate layer, a membranous remnant where the tissue is
ibrous and there is a smaller quantity of cells, is not
prioritized in the development of cartilage. Such changes can cause structural damage in the forces of chewing since type I collagen is required to resist multidirectional loads11. Moreover, the CP of the U group animals with their wider subchondral trabecular bone, compared to the other groups studied, may be more susceptible to fractures3. However, the R group showed the predominance of type I collagen in the pre-chondroblastic, chondroblastic and hypertrophic layers, although there was also a high deposition of type III collagen. This suggested that the cartilage of this group is still
immature for their age, indicating the dificulty in
reestablishing cartilage growth. In the NN group, the total cartilage area, the number of cells in the chondroblastic layer, and the cell density were similar to the N group. The TCPCs decreased from day 60 to day 100, with a smaller decrease of the hypertrophic layer, which represents the replacement of the cartilage tissue with bone. Thus, the tissue remained in development even during the adult phase. In the NN group, the layers thickness was similar to that of the N group, suggesting that the cartilage during the adult phase was mature and did not present any growth. This indicates there is the establishment of a pattern of tissue organization at the end of the pubertal phase, with the preservation
Parameters N U R NN RR
Cell number 250.4±21.2 121.1±6.3 171.0±22.2 108.7±7.3 122.6±7.1 U≠N; U≠R; R≠N; R≠NN; RR≠N; RR≠R; NN≠N *
Area (mm²) 1.4±0.06 0.4±0.49 1.0±0.26 1.04±0.07 0.2±0.05 U≠N; U≠NN; U≠R; U≠RR; RR≠N; RR≠NN; RR≠R *
Density 177.8±12.5 279.6±48.8 186.4±61.7 109.1±10.1 623.8±180.3 U≠NN; U≠RR; RR≠NN; RR≠R *
Table 4- Immunostaining of insulin receptor (IR) in the subchondral bone (mean±SD). SD=Standard Deviation
ANOVA*p<0.05
of the cartilage layers. However, the decrease of TCPC of the chondroblastic layer characterizes an adaptation to withstand pressures and to no longer promote growth. This assertion is corroborated by the work of Silbermann25 (1987) and Takahashi26 (1996), who reported that the CP cartilage has characteristics of both growth plates as well as articular cartilage, which functions, at the end of growth, only as articular cartilage. However, the TCPC has a tendency to decrease with advancing age of the animals26. The reduction in the total area of the RR group resulted in an increased cell density. There was a predominance of cellular components, suggesting that in this stage there is the potential for growth. The TCPC of the RR group was decreased, indicating that, contrary to what was observed in
the R group, re-nutrition was not suficient over the
long term, although the potential for growth persisted. All PC cartilage layers in this group had a predominance of type III collagen, which indicates
an insuficient attempt to restore the tissue pattern.
These features demonstrate the deleterious effects of malnutrition during the adult phase when there is a natural decrease of the osteogenic capacity of the tissue27. The structural protein content, as assessed by the CM percentage, was smaller in animals of the U group, which may be a result of the lower quantity of cells in the chondroblastic layer, since it is mainly responsible for the secretion of CM. In turn, the impairment of cell support in the CP cartilage layers can disrupt cell proliferation and migration between the layers, thus impairing the mineralization of CM partitions and the deposition of bone matrix. Furthermore, in these animals the capacity of the cartilage to withstand compressive forces may be reduced, as well as the ability to attract cations and water molecules, which provide moisture and promote tissue volume9. This would explain the decrease of the size and area of the CPs of malnourished animals observed in this study. The re-nutrition managed to restore the CM of the R group due to the increase in the quantity of cells in the chondroblastic layer compared with the malnourished animals. The matrix was able to support the maintenance of the underlying tissue, the hypertrophic layer. The NN group had a decreased CM; however, without statistically significant differences compared with the N group. This suggests that metabolism during the adult phase is reduced, which leads to a lower production of CM and its subsequent mineralization. These data
corroborate the indings of Tiilikainen, et al.27 (2011)
that reported a decrease of the CP’s CM, as indicated
b y t h e d e c r e a s e d e x p r e s s i o n o f m a t r i x metalloproteinase with advancing age. In turn, the RR group had an increase in CM, which may represent an attempt to maintain support tissue for cellular dysplasia, which occurs in the hypertrophic
layer, and thereby promotes partition mineralization20. Thus, the intent is to maintain tissue growth, which, at this stage, is still lagging. The IR expression was heterogeneous, and the articular layer had scarce immunostaining, which is consistent with its high stability. This was altered in the U group, even with
only a slight difference in the articular layer’s
thickness. The pre-chondroblastic and chondroblastic layers had the highest IR expression levels, which is also in accordance with their main feature, the abundance of potentially differentiable cells9. Moreover, the double phenotypic potential of the CP pre-chondroblastic layer, the capacity to form chondrocytes or osteocytes30, makes this a cell-rich area that, consequently, has a higher IR expression level. Thus, the metabolic action of insulin, the increased synthesis of nucleic acids and proteins in cells6, which results in cell proliferation, increases the likelihood that such layers have higher IR expression. Another possible explanation for the elevated IR immunostaining in the pre-chondroblastic and chondroblastic layers is the intense presence of IGF receptors4 and the occurrence of crosslinking between the homologous receptors IGF-I and IR, due to negative cooperative binding12. In the U group there was a decrease in the expression of IR, which can be related, again, to the decrease in the quantity of cells in the tissues of these animals. The latter was seen in the sections stained by the azocarmine method. Thus, the amount of cells in the CP cartilage determined the level of IR expression that was recovered in the R group; however, this expression decreased in the RR group. Malnutrition also affected the subchondral bone region of the CP, causing a decrease in its area and lower IR expression. Re-nutrition restored the area in quantitative terms; however, the increased expression was only partial. In the NN group, the expression was maintained, indicating that even at an advanced age the hormonal metabolism in the region is intense. This is corroborated by the high density of the trabecular bone of this area, which was qualitatively demonstrated.
CP is a major site of mandibular length and height growth5 and it is also a determinant in the morphology of the face, and in the performance of complex functions such as chewing and talking2. As reported, nutritional intake and malabsorption may be responsible for the TMJ deiciency state. An example is a patient who is suffering from a malnutrition state and is submitted to a complex TMJ operation. In this case, malnutrition can lead a poor treatment result and increase patient’s morbidity13. Another author relates malnutrition in
children as a cause of bone deformities that cause temporomandibular disorders, such as osteoarthritis or rheumatoid arthritis7.
ibrocartilage, demonstrated by thinner ibrocartilage veriied in undernourished animals. These alterations
may affect the articular response to trauma by impairing the remodeling process, allowing the occurrence of adverse sequelae. Thus, clinical analyses evidenced that undernutrition provided a delay in the callus formation and CP development, as
well as ibrous ankylosis in the temporomandibular
joint22.
CONCLUSIONS
Protein malnutrition interfered with the cellularity,
the area and in the composition of the CP’s collagen.
It also reduced subchondral immunoreactive cell density and altered IR expression in the cartilage of the CP. The present study suggests that malnutrition can interfere with the ability of the CP to resist mastication forces and cause an increased susceptibility to fractures.
ACKNOWLEDGMENTS
We regret to inform that our beloved colleague Sílvia de Campos Boldrini tragically passed away in June 2011. Her charisma, belief in the goodness of people, determination for the enhancement of science and teaching of anatomy were the biggest legacy she has left in our lives.
Funding Sources
This work was inancially supported by the São Paulo Research Foundation (FAPESP No. 06/56045-9). Partial financial support was also obtained through a CAPES/CNPq scholarship (National Council
for Scientific and Technological Development;
Coordination for the Improvement of Higher Education Personnel).
REFERENCES
1- Alippi RM, Barcelo AC, Bardi M, Friedman SM, Rio ME, Bozzini C E. Effect of protein-free diet on growth of the skeletal units of the rat mandible. Acta Odontol Latinoam. 1984;1:9-13.
2- Bae JW, Takahashi I, Sasano Y, Onodera K, Mitani H, Kagayama M, et al. Age-related changes in gene expression patterns of matrix metalloproteinases and their collagenous substrates in mandibular condylar cartilage in rats. J Annat. 2003;203:235-41.
3- Borrelli J Jr, Zaegel MA, Martinez MD, Silva, MJ. Diminished
cartilage creep properties and increased trabecular bone density following a single, sub-fracture impact of the rabbit femoral condyle. J Orthop Res. 2010;28:1307-14.
4- Delatte M, Von den Hoff JW, van Rheden RE, Kuijpers-Jagtman AM.
Primary and secondary cartilages of the neonatal rat: the femoral head and the mandibular condyle. Eur J Oral Sci. 2004;112:156-62.
5- Fuentes MA, Opperman LA, Bellinger LL, Carlson DS, Hinton RJ.
Regulation of cell proliferation in rat mandibular condylar cartilage in
explant culture by insulin-like growth factor-1 and ibroblast growth
factor-2. Arch Oral Biol. 2002;47:643-54.
6- Hinton RJ, Carlson DS. Regulation of mandibular condylar cartilage
growth. Sem Orthod. 2005;11:205-19.
7- Howard JA. Temporomandibular joint disorders in children. Dent
Clin N Am. 2013;57:99-127.
8- Hughes PC. Morphometric studies of catch-up growth in the rat. Prog Clin Biol Res. 1982;101:433-46.
9- Kenzaki K, Tsuchikawa K, Kuwahara T. An immunohistochemical study on the localization of type II collagen in the developing mouse mandibular condyle. Okajimas Folia Anat Jpn. 2011;88:49-55. 10- Laron Z. Insulin - a growth hormone. Arch Physiol Biochem. 2008;114:11-6.
11- Luder HU. Frequency and distribution of articular tissue features in adult human mandibular condyles: a semiquantitative light microscopic study. Anat Rec. 1997;248:18-28.
12- Maor G, Hochberg Z, Silbermann M. Insulin-like growth factor I accelerates proliferation and differentiation of cartilage progenitor cells in cultures of neonatal mandibular condyles. Acta Endocrinol (Copenh). 1993;128:56-64.
13- Mehra P, Wolford LM. Serum nutrient deiciencies in the patient
with complex temporomandibular joint problems. Proc (Bayl Univ Med Cent). 2008;21:243-7.
14- Mizoguchi I, Nakamura M, Takahashi I, Kagayama M, Mitani H. An immunohistochemical study of localization of type I and type II collagens in mandibular condylar cartilage compared with tibial growth plate. Histochemistry. 1990;93:593-9.
15- Molténi A, Modrowski D, Hott M, Marie PJ. Alterations of matrix
and cell-associated proteoglycans inhibit osteogenesis and growth
response to ibroblast growth factor-2 in cultured rat mandibular
condyle and calvaria. Cell Tissue Res. 1999;295:523-36.
16- Moore SE, Prentice AM, Wagatsuma Y, Fulford AJ, Collinson AC, Raqib R, et al. Early-life nutritional and environmental determinants of thymic size in infants born in rural Bangladesh. Acta Paediatr. 2009;98:1168-75.
17- Morse A. Formic acid-sodium citrate decalciication and butyl alcohol dehydration of teeth and bones for sectoring in parafin. J Dent Res. 1945;24:143-53.
18- Nakamoto T, Porter JR, Winkler MM. The effect of prenatal protein-energy malnutrition on the development of mandibles and long bones in newborn rats. Br J Nutr. 1983;50:75-80.
19- Nieto-Vazquez I, Fernández-Veleto S, Krämer DK, Vila-Bedmar R,
Garcia-Guerra L, Lorenzo M. Insulin resistance associated to obesity: the link TNF-alpha. Arch Physiol Biochem. 2008;114:183-94. 20- Ramirez-Yanez GO. The mandibular condylar cartilage: a review. Ortop Rev Int Ortop Func. 2004;1:85-94.
21- Reeves PG, Nielsen FH, Fahey GC Jr. AIN-93 puriied diets for laboratory rodents: inal report of the American Institute of Nutrition
ad hoc writing committee on the reformulation of the AIN-76A rodent
diet. J Nutr. 1993;123:1939-51.
22- Rodrigues L, Corrêa L, Luz JG. Healing of displaced condylar process fracture in rats submitted to protein undernutrition. J Craniomaxillofac Surg. 2011;39:73-8.
23- Romeis B. Mikroskopische Technick. 6th ed. München:
Oldenbourg; 1968. 564 p.
24- Schumacher GH. Regulative and adaptive factors in craniofacial growth. Ann Anat. 1999;181:9-13.
25- Silbermann M, Reddi AH, Hand AR, Leapman RD, Von der Mark
K, Franzen A. Further characterisation of the extracellular matrix in the mandibular condyle in neonatal mice. J Anat. 1987;151:169-88. 26- Takahashi I, Mizoguchi I, Sasano Y, Saitoh S, Ishida M, Kagayama M, et al. Age-related changes in the localization of glycosaminoglycans in condylar cartilage of the mandible in rats. Anat Embryol. 1996;194:489-500.
27- Tiilikainen P, Raustia A, Pirttiniemi P. Effect of diet hardness on mandibular condylar cartilage metabolism. J Orofac Pain. 2011;25:68-74.
28- Ulgen M, Baran S, Kaya H, Karadede I. The inluence of the
masticatory hypofunction on the craniofacial growth and development
in rats. Am J Orthod Dentofacial Orthop. 1997;111:189-98. 29- Watkins AJ, Sinclair KD. Paternal low protein diet affects adult