*e-mail: [email protected]
A Systematic Study on Electrolytic Production of Hydrogen
Gas by Using Graphite as Electrode
A.L. Yuvaraja, D. Santhanarajb*
aDepartment of Mechanical Engineering, Veltech high tech DR.RR and DR. SR Engineering college, Avadi, Chennai 600 062, Índia
bDepartment of Chemistry, Veltech high tech DR.RR and DR. SR Engineering college, Avadi, Chennai 600 062, Índia
Received: December 4, 2012; Revised: August 26, 2013
Alkaline water electrolysis is one of the easiest methods for hydrogen production that has the advantage of simplicity. The major challenges in the water electrolysis are the reduce energy consumption, cost and maintenance and to increase reliability, durability and safety. In this regard, the electrolytic production of hydrogen is systematically studied by commercially available graphite electrode at room temperature. The experimental results showed the rate of production of hydrogen
gas was signiicantly affected when the reaction parameters such as effect of electrolyte concentration,
temperature, applied voltage and reaction time are varied. From the experimental results, it has been found that graphite is a good choice for the production of maximum hydrogen compared to various other electrodes.
Keywords: electrochemistry, electrolyte, gas bubbles, hydrogen, renewable energy, water electrolysis
1. Introduction
Hydrogen plays an important role as an energy carrier for sustainable development1-8 and it is also expected to be used as secondary energy in near feature. Hydrogen can also be used as fuel for vehicle and rockets, as chemical, for Ni-H2 electric cell, for direct combustion for heat, and so on. Besides, hydrogen is considered as the lightest element and any leakage of hydrogen gas can be dispersed quickly. Thus, hydrogen is believed as safe as other commonly used fuels for future10. Presently, hydrogen can be economically produced from hydrocarbon reforming, which is neither renewable nor clean from the life cycle point of view9-11. Powered by solar energy, hydrogen can be produced from water via photocatalysis, thermochemical cycles, and water electrolysis10-13. These methods offer renewable and clean production of hydrogen fuel and therefore, have attracted increasing research interests in recent years. So far, the
eficiency of photocatalysis and thermochemical cycles are
still too low to be economically competitive. Electrolytic production of hydrogen from water is gradually gaining its importance among the other conventional processes of hydrogen production in the context of renewable energy source utilization and environmentally clean technology. Worldwide research is being carried out to make the process into cost effective.
An electrolyzer is usually subject to massive current values in order to break the water molecules into oxygen and hydrogen. In any electrolytic cell, electrodes are the main physical part of the system14. Out of the two types of electrodes, active electrodes get involved in the redox
reaction by accumulating or consuming materials of electrodes.
Steel and iron are the most commonly used for electrolysis of water. These electrodes are used as anode and it is sacrificed in electrolysis, as the anode rusts (get oxidized) and the cathode de-rusts (get reduced). Many works have been carried out in stainless steel, brass and aluminum as anodes, due to the familiar corrosion-resistant properties of these materials. Unfortunately, stainless steel releases toxic materials when it decays, brass deposits copper onto the cathode (which accelerates rusting of steel), and aluminum quickly deteriorates. In this connection, the carbon based electrodes such as carbon and graphite are much more interested due to low cost, good electrical and thermal conductivity, the relatively inert property in alkaline solution compared to metals and also for its porous structure with high purity. The porous structure helps graphite to adsorb hydrogen molecules15. However, the hydrogen production is not systematically studied over the graphite electrode to improve hydrogen production by simple electrolytic process. In the present paper, the effects of electrolyte concentration, temperature, applied voltage and reaction time on the amount of hydrogen gas produced
and consequently on the overall electrolysis eficiency is
experimentally investigated.
2. Experimental
electrolyzer of total capacity of 1.5 liter. They are connected by a narrow rectangular conduit of size (15 cm × 4.5 cm × 4 cm). Cylindrical rods namely 316 L stainless steel, EN8, Carbon and graphite electrodes are used with uniform dimensions (diameter = 20 mm & length = 80 mm) and alkaline KOH was used as standard electrolytes. The distance between the two electrodes is kept constant at a value of 2 cm. AC power supply is connected to a bridge
rectiier through a step down transformer (500 VA, Input: 0 - 220/ 230 V AC, Output: 0 - 24 V AC). The electrodes are then connected with bridge rectiier (AC to DC converter). The range of DC output is varied from 0 to 12 V. A variac
is used to vary the applied voltage. Ammeter (0 - 20 A DC)
and voltmeter (0 - 50 V DC) are connected respectively in
series and parallel to the electrolyzer to measure current and voltage applied to the system. The gases obtained from the anode and the cathode limbs are collected separately. The volume of hydrogen produced is twice the amount of oxygen produced and it can be measured by down displacement method.
3. Results and Discussions
3.1.
Effect of electrolyte concentration
Bases and acids are known to change the nonconductive nature of pure water. These compounds have a great reducing effect on the overvoltage value of an electrolyzer16. They improve the ionic conductivity aqueous electrolyte compounds. However, the concentration level of acidic and alkali solutions are limited in practice due to the highly corrosive behavior of electrodes. In this regard, the concentration of electrolyte was systematically varied from 0.05 to 0.4 M concentration as shown in Figure 2. The study revealed that the hydrogen production gradually increases with increase in electrolytic concentration. This may be due to the amount of current that passes depends on the conductance of the electrodes and electrolyte concentration. In another perspective, the increase in hydrogen evolution in increased electrolytic concentration is due to a greater number of effective ionic collisions per unit time.
3.2.
Effect of decomposition of graphite
electrodes (Anodic reaction)
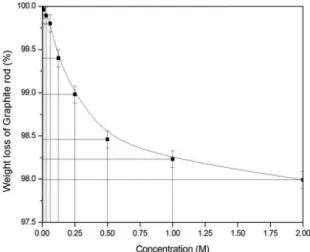
The effect of various electrolytic concentrations on graphite electrodes is studied and represented in Figure 3. The results are shown that when there is an increase in electrolytic concentration from 0.025 to 0.5 M, the gradual decomposition of anodic graphite rod is observed. The decomposition behavior of graphite rod is calculated by weight loss after the electrolytic process. The weight loss may be due to high electrolytic concentration in the presence of applied voltage. The KOH acts up to the surface carbon of graphite material and it leads to the electrolytic solution turning into black slurry. From the results, we concluded that the high electrolytic concentration (above 0.025 M) is
not beneicial for long time hydrogen production without
destruction of graphite electrode.
Figure 1. A schematic diagram represents the electrolytic production of hydrogen gas.
Figure 3. Effect of Weight Loss on Graphite Rod with respect to electrolyte concentration: Reaction conditions: Dimensional of graphite rod: 80 × 20mm; Temperature: 303 K; Pressure: 1 atm; Applied voltage: 12 V; Applied Current: 1.2 A; Medium: Distilled water; Reaction Time: 10 mts and Distance between the electrodes: 2 cm.
3.3.
Effect of temperature
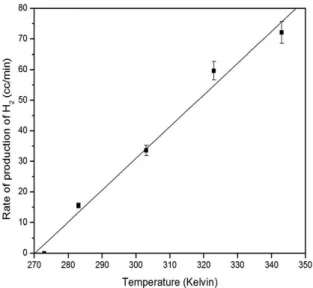
Temperature is known to be one of the most effective variables on the electric power demand of an electrolytic
cell. Electrolysis process is much more eficient at increased
temperatures17. In this part of the experiment, the electrolyte temperature has gradually increased from 270 to 353 K (Figure 4). The study clearly reveals that when there is an increase in temperature the hydrogen production increases linearly. The reasons for this behavior can be drawn from the thermodynamic characteristics of a water molecule since its splitting reaction potential is known to reduce as the temperature increases. Moreover, ionic conductivity and surface reaction of an electrolyte rise directly with temperature18. High temperature water electrolysis requires less energy to reach any given current density in analogy with a low temperature process18,19. The main outcome of the study is that a substantial part of the energy needed for the electrolysis process is added as heat, which is much cheaper than electric energy. In addition, the high temperature accelerates the reaction kinetics, reducing the energy loss due to electrode polarization, thus increasing the overall
system eficiency.
3.4.
Ohmic losses
The ohmic losses are due to the resistance of the imperfect electrodes and the nature electrolytes. The resistivity of the given electrolytic solution can be calculated by varying the current density with respect to applied voltage as shown in Figure 5. It is clearly shows that, the ohmic loss of the alkaline KOH is perfectly linear20. In most cases, the ohmic loss is considered to have the relationship of I (Current) and R, where R is constant.
So, the equation is related to the ohmic loss is V = IR.
From the linear graph, the resistivity of aqueous KOH is calculated as 19.5 ohms.
3.5.
Effect of applied voltage
The inluence of an applied voltage on the hydrogen
evolution reaction (HER) can be studied over cylindrical graphite electrode at the temperature of 593 K with a 0.025 M concentration of KOH. The applied voltage is
varied from 4.5 to 12 V and the resultant graph as shown in
Figure 6. It shows that, the rate of production of hydrogen gas gradually increases with increase in applied voltage. The plausible reason is the uniform charge density increases on the surface of cylindrical electrode.
3.6.
Effect of time on stream
In order to study the sustainability and stability of the cylindrical graphite electrode, the effect of time on the hydrogen evolution reaction is studied under the optimized reaction conditions. The obtained results were illustrated
in Figure 7. From the igure, it was observed that initially
the hydrogen production was reached to maximum of 800 cc/min and thereby decreased to attain the stable state.
The unchanged proile of hydrogen production for the period
of 90 minutes demonstrates that the graphite electrode remains stable state without any destruction on the surface of the electrode throughout the testing time. After the reaction time of 90 minutes, the graphite electrode is regenerated by
drying in low of air at 50 °C for ive hours and the experiment
is conducted under similar reaction conditions. The rate of production of hydrogen is much more similar to that of initial run. This means the graphite electrode regain its original activity of its regeneration. The overall performance of the graphite electrode has shown an acceptable level of stability under the present experimental conditions.
Figure 4. Effect of temperature on the production of hydrogen gas: Dimensional of graphite rod: 80 × 20mm; Pressure: 1 atm; Electrolyte concentration: 0.03 M; Applied voltage: 12 V; Applied Current: 1.2 A; Medium: Distilled water; Reaction Time: 10 mts and Distance between the electrodes: 2 cm.
3.7.
Effect of electrodes on the hydrogen
evolution reaction
The eficiency of graphite electrode is compared with
commercially available various electrodes like 316 L stainless steel, EN8 and carbon rods and the results are shown in Figure 8. The activity of various electrodes follows the trend Graphite > EN8 > SS 316 L > Carbon. From the experimental results, it was observed that even though, the carbon and graphite electrodes are allotropy of carbon materials, the
eficiency of hydrogen production is much higher on graphite
electrode. The plausible reasons it may be due to the either
layer of structure graphite electrode or the porous nature
of material which signiicantly enhances the diffusion of
water molecule without any blockage. On the other hand, the contact time of water molecule per unit time is much higher on graphite electrode than the carbon electrode. Therefore, from the above results it might be concluded that hydrogen evolution reaction is preferentially taking place in the internal
porous structure. Further, the signiicant corrosion behavior
can be seen on both stainless steel and EN8 electrodes by using alkaline KOH as the electrolyte and it leads to decrease in the rate of hydrogen production. The observed trend is more pronounced on EN8 electrode compared to the stainless steel electrode. Among all the cylindrical electrodes, graphite is found to be the best choice for hydrogen evolution reaction under the present experimental conditions.
3.8.
Kinetic studies on electrolysis of water
The rate data for the alkaline water electrolysis is studied
on cylindrical graphite electrode and it could be itted well to irst order rate law. The following relationship derived
between relative conversion ‘X’ and contact time has been used for evaluating the rate parameters.
kt = -ln (1-X) (1)
Where, ‘X’ is the fractional conversion of hydrogen gas,
‘k’ is the apparent irst order rate constant. From the slope of linear plot, the irst order rate constant value ‘k’ can be
calculated by using equation 1, which is used to determine the activity of electrodes through the evaluation of activation energy. The apparent activation energy is calculated as 7.5 cal/mol.
4. Conclusions
The Electrolytic production of hydrogen is systematically studied by using commercially available graphite electrode at room temperature. On increasing the electrolytic
Figure 7. Arrhenius plots for the production of hydrogen gas: Dimensional of graphite rod: 80 × 20mm; Pressure: 1 atm; Electrolyte: KOH; Electrolyte concentration: 0.03 M; Applied voltage: 12 V; Applied Current: 1.2 A; Distance between the electrodes: 2 cm.
Figure 8. Influence of various cylindrical electrodes on the production of hydrogen gas: Dimensional of graphite rod: 80 × 20mm; Temperature: 303 K; Pressure: 1 atm; Electrolyte concentration: 0.03 M; Applied voltage: 12 V; Applied Current: 1.2 A; Distance between the electrodes: 2 cm.
concentration the hydrogen production is greatly increases. However, the gradual decomposition of anodic graphite rods is observed. From the study we concluded that the high
electrolytic concentration (above 0.025 M) is not beneicial
for long time hydrogen production. The efficiency of graphite electrode is compared with commercially available
various electrodes like 316 L stainless steel, EN8 and carbon rods. Among all the cylindrical electrodes, graphite is found to be the best choice for hydrogen evolution reaction under the present experimental conditions. Further research is necessary to develop this laboratory scale study into a practical reality.
References
1. Silva LD, Bergel A, Feron D and Basseguy R. Hydrogen production by electrolysis of a phosphate solution on a stainless steel cathode. International of Journal of Hydrogen Energy. 2010; 35:8561-8568. http://dx.doi.org/10.1016/j. ijhydene.2010.05.101
2. Zeng K and Zhang D. Recent progress in alkaline water electrolysis for hydrogen production and applications. Progress in Energy and Combust Science. 2010; 36:307-326. http:// dx.doi.org/10.1016/j.pecs.2009.11.002
3. Wei G, Wang Y, Huang C, Zhitao QG and Xu L. The stability of MEA in SPE water electrolysis for hydrogen production. International Journal of Hydrogen Energy. 2010; 35:3951-3957. http://dx.doi.org/10.1016/j.ijhydene.2010.01.153
4. Ni M, Leung MKH, Sumathy K and Leung DYC. Potential of renewable hydrogen production for energy supply in Hong Kong. International Journal of Hydrogen Energy. 2006; 31:1401-1412. http://dx.doi.org/10.1016/j. ijhydene.2005.11.005
5. Rachid M and Soiane M. Electrolyte process of hydrogen production by solar energy. Desalination. 2007; 206:69-77. http://dx.doi.org/10.1016/j.desal.2006.04.050
6. Elias DC, Nair RR, Mohiuddin TMG, Morozov SV, Blake P, Halsall MP et al Control of graphene’s properties by reversible hydrogenation: Evidence for graphane. Science. 2009; 323: 610-613. PMid:19179524. http://dx.doi. org/10.1126/science.1167130
7. Politano A and Chiarello G. Alkali-induced hydrogenation of epitaxial graphene by water splitting at 100 K. Journal of Chemical Physics. 2013; 138: 044703. PMid:23387611. http:// dx.doi.org/10.1063/1.4788619
8. Politano A, Raimondo Marino A, Formoso A and Chiarello G. Hydrogen bonding at the water/quasi-freestanding graphene interface. Carbon. 2011; 49: 5180-5184. http://dx.doi. org/10.1016/j.carbon.2011.07.034
9. Chen F, Liu J, Chen H and Yan C. Study on Hydrogen Evolution Reaction at a Graphite Electrode in the All-Vanadium Redox Flow Battery. International Journal of Electrochemical Science. 2012; 7:3750-3764.
10. Schulte I, Hart D and Van der Vorst R. Issues affecting the acceptance of hydrogen fuel. International Journal of Hydrogen Energy 2004; 29:677-685. http://dx.doi.org/10.1016/j. ijhydene.2003.09.006
11. Koroneos C, Dompros A, Roumbas G and Moussiopoulos N. Life cycle assessment of hydrogen fuel production processes. International Journal of Hydrogen Energy. 2004; 29:1443-1450. http://dx.doi.org/10.1016/j.ijhydene.2004.01.016
12. Nie J, Chen Y, Boehm RF and Katukota S. A Photoelectrochemical Model of Proton Exchange Water Electrolysis for Hydrogen Production. Journal of Heat Transfer. 2008; 130:042409-042415. http://dx.doi.org/10.1115/1.2789722
13. Colella WG, Jcobson MZ and Golden DM. Switching to a U.S. hydrogen fuel cell vehicle leet: The resultant change in emissions, energy use, and greenhouse gases. Journal of Power Sources. 2005;150:150-181. http://dx.doi.org/10.1016/j. jpowsour.2005.05.092
14. Allouche A, Ferro Y, Angot T, Thomas C and Layet JM. Hydrogen adsorption on graphite (0001) surface: A combined spectroscopy–density-functional-theory study. Journal of Chemical Physics. 2005; 123:124701-6. PMid:16397948. http://dx.doi.org/10.1063/1.2043008
15. Millet P, Andolfatto F and Durand R. Design and performance of a solid polymer electrolyte water electrolyzer. International Journal of Hydrogen Energy. 1996; 21:87-93. http://dx.doi. org/10.1016/0360-3199(95)00005-4
16. Badwal SPS, Giddey S and Ciacchi FT. Hydrogen and oxygen generation with polymer electrolyte membrane (PEM)-based electrolytic technology Ionics. 2006; 12:7-14. http://dx.doi. org/10.1007/s11581-006-0002-x
17. Nikolic VM, Tasic GS, Maksic AD, Saponjic DP, Miulovic SM and Marceta Kaninski MP. Performance comparison of modified poly(vinyl alcohol) based membranes in alkaline fuel cells. International Journal of Hydrogen Energy. 1996; 36:11004-11010. http://dx.doi.org/10.1016/j. ijhydene.2011.05.164
18. Udagawa J, Aguiar P and Brandon NP. Hydrogen production through steam electrolysis: Model-based steady state performance of a cathode-supported intermediate temperature solid oxide electrolysis cell. Journal of Power Sources. 2007; 166:127-136. http://dx.doi.org/10.1016/j. jpowsour.2006.12.081
19. Stojic DL, Marceta MP, Sovilj SP and Miljanic SS. A Photoelectrochemical Model of Proton Exchange Water Electrolysis for Hydrogen Production. Journal of Power Sources. 2003; 118:315-319.