*e-mail: [email protected]
Investigations on Cementitious Composites Based on Rubber Particle Waste Additions
Glaucio Laun Nacifa, Túlio Hallak Panzeraa*, Kurt Streckera, André Luis Christoforoa, Kevin Paineb
aDepartment of Mechanical Engineering, Federal University of São João del-Rei – UFSJ, Campus Santo Antônio, Praça Frei Orlando, 170, CEP 36307-352, São João del-Rei, MG, Brazil
bDepartment of Architecture & Civil Engineering, University of Bath, Bath, BA2 7AY, UK
Received: October 20, 2011; Revised: August 3, 2012
The amount of waste rubber has gradually increased over recent years because of over-growing use of rubber products. The disposal of waste rubber has caused serious environmental problems. The incorporation of recycled materials into cementitious composites is a feasible alternative that has gained ground in civil construction. The performance of such materials is much affected not only by the rubber addition, but also the particle size which has been controversially reported in the literature. In order to investigate the single effect of rubber particles into cement based materials, rubber cementitious composites were prepared with no silica particle additions. A full factorial design has been conducted to assess the influence of the rubber particle size (0.84/0.58 mm and 0.28/0.18 mm); mass fraction used (5, 15 and 30%); and water/cement ratio (0.35 and 0.50) on the physic-mechanical properties of the composites. The materials were characterized through apparent density, porosity, compressive strength, flexural strength, modulus of elasticity and microstructural analysis. The interactions of rubber particle size, rubber fraction and water/cement ratio affected significantly the density and compressive strength of the composites. The apparent porosity was influenced mainly by the rubber particle size. The flexural strength was affected by the main factors and the modulus of elasticity was affected by the interaction factors rubber particle size and fraction, and rubber fraction and w/c ratio.
Keywords: cementitious composite, rubber waste, recycling, full factorial design
1. Introduction
On a global basis between 700 million to 1 billion of new tyres are manufactured each year and this figure is rising due to increasing world population, vehicle ownership and usage. Statistics show that in Brazil 300.000 tonnes of wastes tyres are generated every year, of which only 10% are currently recycled. In United States, with a population of approximately 30% higher than Brazil, the amount of rubber waste is ten times higher, of which only 5% are recycled. Currently, more than 300 million tyres are stored in the US1-2. In the United Kingdom, approximately 46 million tyres are disposed of each year and since European Union directives have banned the disposal of used tyres (whole and shredded) in landfills, this has created an urgent need to identify routes for reuse or for recycling the component materials for new purposes3.
With a higher calorific value than top grade coal, a typical car tyre is equivalent to ten litres of fuel oil, and may present a fire hazard. Even tyres accumulated in landfills may be ignited. Once started, such fires may be virtually impossible to extinguish; emitting atmospheric and water-borne pollutants. Unless the tyres are shredded prior to being landfilled, such accumulations are also structurally unstable - tyres tend to rise to the surface, limiting options for future land use. Public health is also affected if tyres are dumped in water courses, roadsides or public areas by
accumulating water and causing the proliferation of insects which may transmit diseases such as malaria and others4-5.
The interest of developing concrete from non conventional raw materials is indispensable for the protection of the environment and also for the economic by reducing costs6-7. Innovative solutions for recycling of tyres have been the focus of much research, such as the addition of the scrap tyre rubber in asphalt, concretes and polymers8-11; as well as incineration for vapour production and energy production8,12.
The addition of rubber to cement based materials resulted in reduced compressive strengths and densities. The particle size range of rubber granules used by various investigators varied considerably. Ali et al.13 used three gradings of rubber with a maximum size of less than 4.76 mm, and one type contained textile fibre. Topcu14 graded the rubber used in the investigations into 0 to 1 mm and 1 to 4 mm. Eldin and Senouci15 used large rubber granules and graded their rubber into three groups of 38, 25 and 19 mm maximum sizes. Jingfu and Yongqi16 used fine rubber particles with average size of 1.5 mm. Correia et al17 used rubber particles below 1.2 mm in size as replacement of silica sand in mortar.
rubber fractions. The flexural strength (MPa) of mortar was reduced by the increase of rubber fraction (%), as follows: 16% (5 MPa), 21.4% (4 MPa) and 32% (2.75 MPa). The compressive strength decreases with the addition of rubber particles as follows: 8% (24.1 MPa), 16% (21.4 MPa), 21.4% (18 MPa) at 28 days.
The rubber is hydrophobic, while the mortar is hydrophilic, the interface between the rubber and concrete is incompatible, and so the poor interfacial adhesion between these two phases is the main reason for the decrease of the strength. Segre and Joekes19 used saturated NaOH solution to treat waste tire rubber powders and resulted in an improvement in strength and toughness in waste tire powder modified cement mortar. Ligang et al.20 reported the effect of modified rubber by sol-gel method with reactive precursor TEOS and γ-glycidyloxypropyl trimethoxysilane. The toughness of rubber mortar was increased by adding 7 wt. (%) of ATRP, which reveals an increase of interface adhesion. Yue et al.21 investigated the addition of interfacial modifiers to improve the interfacial bonding strength between the crumb rubber and Mortar, revealing the silicone modified styrene-acryl ate-emulsion has a significant effect on the physical and mechanical properties22. The flexural (6.6 MPa) and compressive strength (35 MPa) of rubber mortar increases nearly 18.9% by adding the chemical agent at 28 days.
Fattuhi and Clark23 investigated the addition of fine and coarse rubber particles into mortar and concrete. The reductions in the compressive strength of concrete mixes were much larger than those for cement paste and mortar mixes. Generally concrete containing rubber crumb had a higher compressive strength than concrete containing low-grade rubber for a similar rubber/cement ratio with a maximum difference in strength of about 15%.
Correia et al.17 prepared mortar mixtures using rubber wastes from scrap tires as fine aggregate (10, 20 and 30 vol.%) with water/cement ratios of 0.52, 0.55 and 0.60. Although the use of waste vulcanized rubber scrap particles as replacement for the usual natural river sand decreases the workability of the fresh concrete and weakens the interfacial transition zone (ITZ) between aggregates and cement matrix of hardened mortars, a specified 28-day compressive strength (13-17 MPa) can still be achieved at higher water/cement ratios (from 0.52 to 0.58) and replacement contents (<20 vol.%).
Topcu14 and Eldin and Senouci15 results indicated that coarse grading of rubber granules reduced the compressive strength more than the finer grading. However, the results of tests carried out by Ali et al.13 and Fattuhi and Clark23 indicated the opposite.
Based on this brief review, the investigations on the reuse of scrap tyre rubber in cement based materials have shown that the best performance is usually achieved by using a small rubber particle size; despite some works reveal the opposite. In order to evaluate the single effect of rubber particle sizes and fractions into cement paste, cementitious composites were prepared with no silica particle additions. The work reported in this paper however studied the incorporation of even finer rubber particles, ranging from 0.84 mm to 0.18 mm. These fine rubber particles were
incorporated, into a Portland cement based composite at fractions of 5, 15 and 30% by mass of cement, and the effects on density, porosity, modulus of elasticity, compressive and flexural strength were investigated. A full factorial design of experiment (DOE) has been adopted in order to identify the effect of rubber addition on the properties of the cementitious composites.
2. Material and Methods
The particulated ceramic composites investigated in this work were two phase materials constituted of a cementitious matrix phase (Portland cement) and an elastomeric dispersive phase (rubber waste). The ordinary Portland cement (OPC) used was supplied by Holcim SA (Pedro Leopoldo - Brazil), and the scrap tyre rubber was supplied by Mantiqueira Pneus company (São João del Rei - Brazil). The rubber particles were obtained on the scrape procedure during the preparation of remould tyres. The particles were washed clean and dried at 80 °C for 24 hours and later on classified by sieving in two particle size ranges: 0.84/0.58 mm and 0.28/0.18 mm.
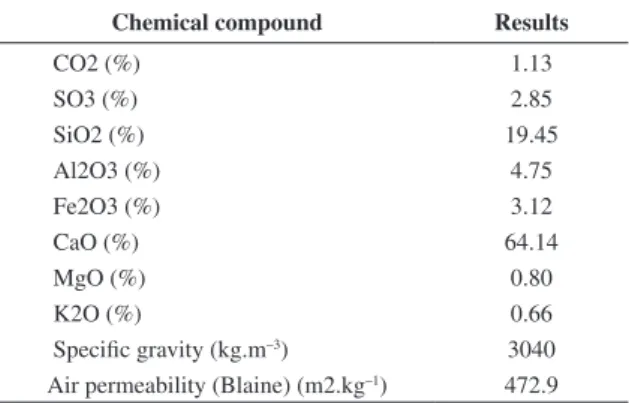
The cement-rubber composites produced were characterized by their apparent density, apparent porosity, compressive and flexural strength (modulus of elasticity). The physical and chemical analysis of the Portland cement (ASTM – Type III) is shown in Table 1.
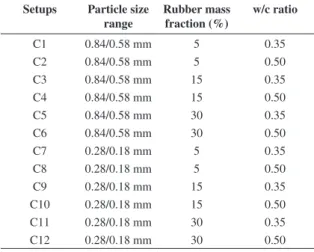
The full factorial design of the type nk consisted of investigating all possible combinations of the experimental factors (k) and its respective levels (n). The result of the factorial nk corresponds to the number of the investigated experimental conditions24. The relevant controlled factors investigated in this work were: particle size range of scrap rubber tyres (0.84/0.58 mm and 0.28/0.18 mm), rubber mass fraction (5, 15 and 30% by mass of cement) and the water/cement (w/c) ratio (0.35 and 0.50). Factors maintained constant in the experiment were the time of mixture (5 minutes), curing time (28 days), room temperature (~29 °C) and matrix material (Portland cement). The OPC, rubber particles and water were mixed for 5 minutes using a small Hobart Mixer, and being packed in plastic bags to avoid any loss of moisture during the cure. Table 2 shows the experimental factors and levels, establishing a full factorial design of type 2231, supplying 12 distinct experimental conditions.
Table 1. Physical and chemical analysis of the Portland cement.
Chemical compound Results
CO2 (%) 1.13
SO3 (%) 2.85
SiO2 (%) 19.45
Al2O3 (%) 4.75
Fe2O3 (%) 3.12
CaO (%) 64.14
MgO (%) 0.80
K2O (%) 0.66
Specific gravity (kg.m–3) 3040
Two replicates and a randomization principle were carried out to provide a basis for analyzing the experimental results. Replication enables the estimation of the magnitude of the experimental error against which the differences among treatments are judged. Additionally, the experimental treatments were also randomized in terms of its order providing protection against unknown variables which may influence the response24. The specimens for compression testing were manufactured using polymeric cylindrical moulds of 25 mm in diameter and 50 mm in height (Figure 1). The specimens for flexural testing were manufactured using prismatic moulds made of silicone of 4 mm in thickness, 20 mm in width and 70 mm in length (Figure 2). Tests for compressive strength, flexural strength and apparent porosity were conducted, with account taken for specimen size differences, in accordance with the procedures described in BS EN 12390-3[25], BS EN 658-3[26] and BS EN ISO 10545-3[27], respectively. The modulus of elasticity of the composites was determined using the flexural testing data assuming linear elastic behaviour at the early portions of loading. The apparent porosity and density were determined using both samples for compressive and flexural testing and these exhibited similar results. Therefore, only the results obtained from the cylindrical samples are presented.
Twenty specimens were produced for each of the 12 experimental conditions, to allow for sufficient replication of data for both mechanical tests. Therefore, in total, 240 specimens were manufactured. The statistical method of design of experiment (DOE) and the analysis of variance (ANOVA) provide the significance of each experimental factor on the responses. The statistical software Minitab version 14 was used for the treatment of the data and analysis of the results.
3. Results
The results of the analysis of variance (ANOVA) for the investigated responses are given in Table 3. The P-values indicate which of the effects in the system are statistically significant, based on examination of the experimental data from replicate 1 and replicate 2. If the P-value is less than or equal to 0.05 the effect is considered significant. An α-level of 0.05 is the level of significance with a 95% probability of the effect being significant. Table 4 exhibits the mechanical properties of the cementitious composites for replicate 1 and 2.
The main effect of a factor must be interpreted individually only if there is no evidence that it does not interact with other factors. When one or more interaction effects of superior order are significant, the interacting factors must only be considered jointly and not separately. All P-values less than or equal to 0.05 are underlined in Table 3, however, the P-values which will be analyzed are highlighted in bold letters. These results will be presented by ‘main effect’ and ‘interaction’ plots. These graphics are not a typical ‘scatter’ plot of data, but illustrate the statistical analysis and provide the variation on the significant effects. The value of ‘R2 adjust’ shown in the ANOVA indicates how well the model predicts responses for new observations. Larger values of adjusted R2 suggest models of greater predictive ability24. From the values presented in
Figure 1. Samples produced for compression test under different experimental conditions.
Figure 2. Samples produced for flexural test under different experimental conditions.
Table 2. Experimental conditions, full factorial design (2231).
Setups Particle size range
Rubber mass fraction (%)
w/c ratio
C1 0.84/0.58 mm 5 0.35
C2 0.84/0.58 mm 5 0.50
C3 0.84/0.58 mm 15 0.35
C4 0.84/0.58 mm 15 0.50
C5 0.84/0.58 mm 30 0.35
C6 0.84/0.58 mm 30 0.50
C7 0.28/0.18 mm 5 0.35
C8 0.28/0.18 mm 5 0.50
C9 0.28/0.18 mm 15 0.35
C10 0.28/0.18 mm 15 0.50
C11 0.28/0.18 mm 30 0.35
C12 0.28/0.18 mm 30 0.50
Table 3, a variation ranging from 81% to 99.62% can be observed, demonstrating that the adjustment of the models is satisfactory.
The ‘residual plots’ can be useful in comparing the plots in order to determine whether the model used meets the assumptions made in the analysis. The normal probability plot indicates whether the data are normally distributed, whether other variables influence the response, or whether outliers exist in the data. The residual plots for the responses investigated in this work are normally distributed following a straight line, validating the ANOVA analysis.
3.1.
Apparent density
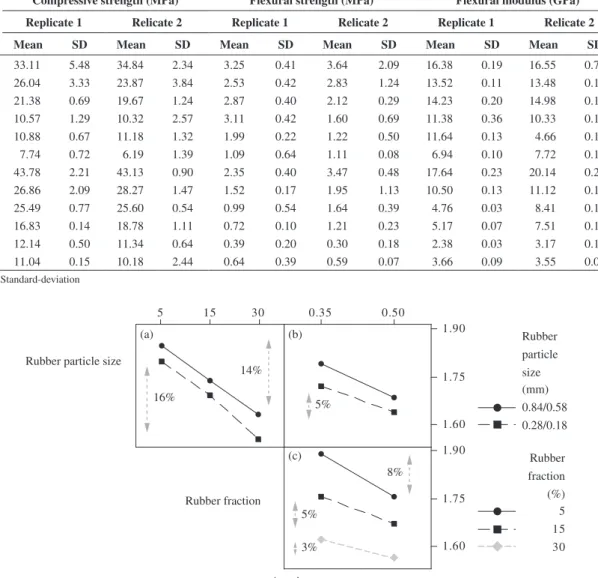
Table 4. Mechanical propeties, Replicate 1 and 2.
Compressive strength (MPa) Flexural strength (MPa) Flexural modulus (GPa)
Replicate 1 Relicate 2 Replicate 1 Relicate 2 Replicate 1 Relicate 2
Mean SD Mean SD Mean SD Mean SD Mean SD Mean SD
C1 33.11 5.48 34.84 2.34 3.25 0.41 3.64 2.09 16.38 0.19 16.55 0.74
C2 26.04 3.33 23.87 3.84 2.53 0.42 2.83 1.24 13.52 0.11 13.48 0.19
C3 21.38 0.69 19.67 1.24 2.87 0.40 2.12 0.29 14.23 0.20 14.98 0.10
C4 10.57 1.29 10.32 2.57 3.11 0.42 1.60 0.69 11.38 0.36 10.33 0.17
C5 10.88 0.67 11.18 1.32 1.99 0.22 1.22 0.50 11.64 0.13 4.66 0.10
C6 7.74 0.72 6.19 1.39 1.09 0.64 1.11 0.08 6.94 0.10 7.72 0.10
C7 43.78 2.21 43.13 0.90 2.35 0.40 3.47 0.48 17.64 0.23 20.14 0.23
C8 26.86 2.09 28.27 1.47 1.52 0.17 1.95 1.13 10.50 0.13 11.12 0.19
C9 25.49 0.77 25.60 0.54 0.99 0.54 1.64 0.39 4.76 0.03 8.41 0.13
C10 16.83 0.14 18.78 1.11 0.72 0.10 1.21 0.23 5.17 0.07 7.51 0.13
C11 12.14 0.50 11.34 0.64 0.39 0.20 0.30 0.18 2.38 0.03 3.17 0.11
C12 11.04 0.15 10.18 2.44 0.64 0.39 0.59 0.07 3.66 0.09 3.55 0.09
SD = Standard-deviation
Figure 3. Interaction effect of rubber particle size, rubber fraction and w/c ratio on the apparent density (g.cm–3) of the composites.
Table 3. Analysis of variance (ANOVA).
ANOVA P-value ≤ 0.05
Experimental factors Apparent density
Apparent porosity
Compressive strength
Flexural strength
Modulus of elasticity
Main factors
Rubber particle size 0.000 0.002 0.000 0.000 0.000
Rubber fraction 0.000 0.099 0.000 0.000 0.000
w/c ratio 0.000 0.358 0.000 0.047 0.005
Interaction factors
Rubber particle size * Rubber fraction 0.246 0.242 0.001 0.531 0.014
Rubber particle size * w/c ratio 0.161 0.495 0.497 0.903 0.994
Rubber fraction * w/c ratio 0.004 0.283 0.000 0.313 0.028
Rubber particle size * Rubber fraction * w/c ratio 0.028 0.705 0.000 0.452 0.077
R2 (adjunt) 98.56% 81.00% 99.62% 86.81% 87.83%
all three parameters interact of “rubber particle size, rubber fraction and w/c ratio” has a significant effect.
Figure 3a shows the interaction effect of the factors “rubber particle size and rubber fraction” on the apparent density. It can be observed that the rubber particle size
the more rounded shape of the particles. Similarly, when the rubber fraction was increased, the apparent density of the composites decreased, due to the lower density of rubber (~0.9 g.cm–3) in comparison to the cement matrix phase (~2.3 g.cm–3). The lower densities of rubberized cement pastes should prove to be advantageous when producing heat or sound insulation products.
Figure 3b shows the effect of the interaction factors “w/c ratio and rubber particle size”, in exhibiting an increase of 5% of the apparent density when the w/c ratio was changed from 0.35 to 0.50 through the addition of water content, for both rubber particle size ranges studied. This increase in water content in the composite provided a reduction in the composite density due to an increase in internal pores, formed by the excess of water in the system. It was verified that the addition of rubber particles of size range 0.84/0.58 mm led to a higher apparent density than the addition of particles of size 0.28/0.18 mm for both w/c ratios studied.
Figure 3c shows the interaction effect of “rubber fraction and w/c ratio”, demonstrating that an increase in the water content caused a reduction in apparent density for all rubber fractions. It was observed that the higher the rubber fraction, the lower the density variation between different water content levels. The increase of the rubber fraction
reduced the amount of the cementitious matrix phase in the composites, and consequently, reduced the effect of w/c ratio on the formation of pores in the composite. Ali et al.13 reported data for the densities of concrete containing rubber, exhibiting a reduction as the rubber particle increases, which was attributed to the considerably air content increased.
3.2.
Apparent porosity
The values of apparent porosity varied from 1% to 9%. The P-value of 0.002 (in bold letters), see Table 3, shows that this was only significantly affected by “rubber particle size” and not related in any significant sense to w/c ratio.
The effect of “rubber particle size” on the apparent porosity is shown in Figure 4. The composites manufactured with rubber particles of size range 0.84/0.58 mm had 81% higher apparent porosity than composites of size 0.28/0.18 mm. It was observed by SEM backscatter electron image in the analyses described later (see Figure 14) that the amount of pores and unhydrated cement grains formed around the larger rubber particles (0.84/0.53 mm) was greater than that around the smaller particles. This can be explained by the variation of packing factor as a function of rubber particle sizes, which affects significantly the porosity and the cement hydration products. The geometry of rubber particles is affected by the particle size range, which means that the smaller particles exhibit a spherical shape, consequently, achieving a better packing factor.
3.3.
Compressive strength
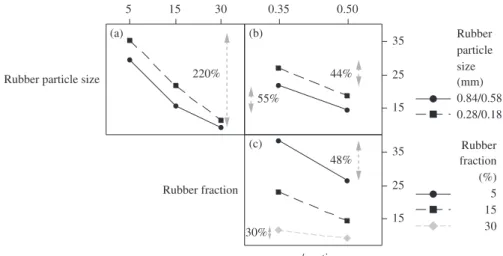
The compressive strength of the composites varied from 6 to 44 MPa. The interaction of the factors “rubber particle size, rubber fraction and w/c ratio” was significant, showing a P-value of 0.000 (in bold letters), see Table 3.
Results are consistent with general theory of cementitious-rubber composites and results in the literature in that:
• Lowerw/cratiogavehigherstrength(forequalrubber size and rubber mass fraction);
• Higherrubberfractionsledtolowerstrength;and • Useoflargerubbersizesgavelowerstrengths14,15. Figure 5a shows the interaction effect of the factors “rubber particle size and rubber fraction”. The highest Figure 4. Main effect of rubber particle size on the apparent porosity
of the composites.
(0.85/0.58 mm) to small (0.28/0.18 mm) rubber particle size was observed.
The composites fabricated with finer rubber particles (0.28/0.18 mm) exhibited a percentage reduction of 42% on the flexural strength response (Figure 7). However, this result is not in accordance with the compressive testing results, where it was shown that finer rubber particles exhibited superior strength. This behaviour may be attributed to the mechanical effect of rubber particles which are no longer able to affect positively on the strength under tensile stresses.
Figure 6. Mechanical behaviour of composites with different rubber fractions in compressive testing.
Figure 7. Main effect plot of rubber particle size for flexural strength response.
Figure 8. Main effect plot of rubber fraction for flexural strength response.
compressive strength is observed for the composites fabricated with the finer rubber particles (0.28/0.18 mm), which is also found by Topcu14 and Eldin and Senouci15. According to Panzera et al.28 the mechanical strength of cementitious composites is correlated to the pore size distribution, and it is clear that the behaviour observed in this work is in accordance with the results of the composites’ apparent porosity.
A variation of 220% in the compressive strength of the composites with 5 and 30% of rubber content can be observed (Figure 5a). A strength reduction with increasing scrap rubber content has been expected, because of the significant difference of the mechanical properties of rubber and cement. The compressive strength data are in accordance with the findings performed by Correia et al.17, Jingfu and Yongqi16, Pang et al.30. Pang et al.30 reported a compressive strength reduction nearly 60% by adding 10-11% of rubber particle size ranging from 0.4-0.2 mm.
The interaction effect of “w/c ratio and rubber particle size” is shown in Figure 5b. As can be seen, the finer rubber particle fraction resulted in a higher compressive strength for both water content levels. This behaviour may also explain the effect of water content on cement pore formation, and consequently affecting strength. This increase of the w/c ratio from 0.35 to 0.50 decreases the compressive strengths of the composites by 55% for larger rubber particle fraction and by 44% for the finer rubber particle fraction.
Figure 5c shows the interaction effect of the factors “rubber fraction and w/c ratio”. It has been verified that the increase of the water content causes a reduction of the compressive strength for all rubber fractions levels. As can be observed in Figure 3c, increasing rubber contents leads to a reduction of the effect of water content on pore formation in cementitious matrices, because of the overall water content. Correia et al.17 reported a significant interaction of rubber fraction and w/c ratio factors on the compressive strength, showing a similar behaviour. The compressive strength of the composites obtained by Correia et al.17 using 0.52 w/c ratio are equivalent to those reported in this work made of 0.35 w/c ratio.
The stress-strain behaviour of three composites containing 5, 15, 30% of rubber particles of size 0.84/0.58 mm and a water content of 35%, during the compressive strength tests are shown in Figure 6. It was observed a reduction of composite’s stiffness as a function of rubber fraction increasing. Rubber composites with more than 20 MPa 28-day compressive strength can be produced using 15% of rubber particle size of 0.84/0.58 with 0.35 w/c ratio, which demonstrates that total replacement of the usual natural fine aggregate is a viable and economical reusing alternative for construction applications.
3.4.
Flexural strength
voltage of 15 kV. Differences in backscatter coefficients primarily reflect differences in chemical composition among the different features present. Chemical components of high electron density have high backscatter coefficients, and appear bright in the backscattered images. Conversely, components of lower electron density, such as most cement hydration products, have lower backscatter coefficients
Figure 10. Interaction effect of rubber particle size and rubber fraction on the modulus of elasticity in flexure of the composites.
Figure 11. Interaction effect of rubber fraction and w/c ratio on the modulus of elasticity of the composites.
However, this result implies that the Interfacial Transition Zone (ITZ) condition under tensile stresses is more effective when the composites are fabricated with larger rubber sizes, for example 0.84/0.58 mm. Alternatively, Paine and Dhir11 have reported evidence that coarser rubber particles provide crack-arresting properties akin to fibre reinforced concrete that may increase ultimate flexural strength.
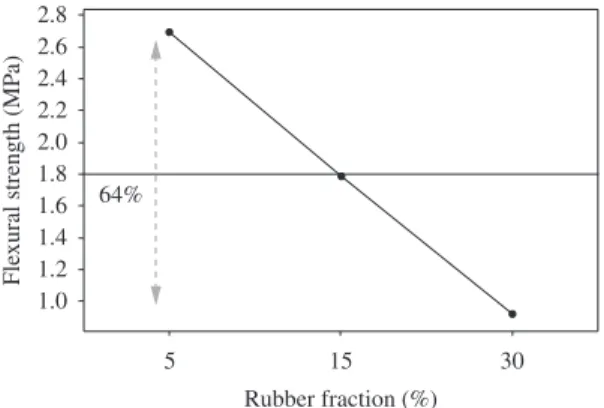
Figure 8 exhibits the main effect plot of rubber fraction factor on flexural strength. A large reduction in flexural strength was found, this is consistent with the literatures16,21, however the values reported in this work are lower. It is verified a strength decreasing of 64% as the rubber fraction is increased. As expected, the addition of rubber particles not only affected the apparent porosity but also the packing factor, and therefore the strength of the composites. The ITZ condition is the main responsible for the mechanical strength of particulated composites. The elastic properties of the particulate and matrix phases are quite different. For this reason, the addition of rubber particles increases the amount of interfacial transition zone in the cementitious matrix phase, which hinders the mechanical strength of the composites.
The effect of w/c ratio on the flexural strength response can be observed in Figure 9. A significant percentage variation of 40% was identified between w/c ratio levels. As it verified for compressive strength (Figure 5), the presence of water decreases the mechanical strength of the composites due to the increase of pores on the cementitious matrix.
3.5.
Flexural modulus
The flexural modulus varied from 0.32GPa to 2.01GPa. The two interactions between “rubber particle size and fraction” and “w/c ratio and rubber fraction” affected significantly the response, exhibiting P values of 0.014 and 0.028, respectively (see Table 3).
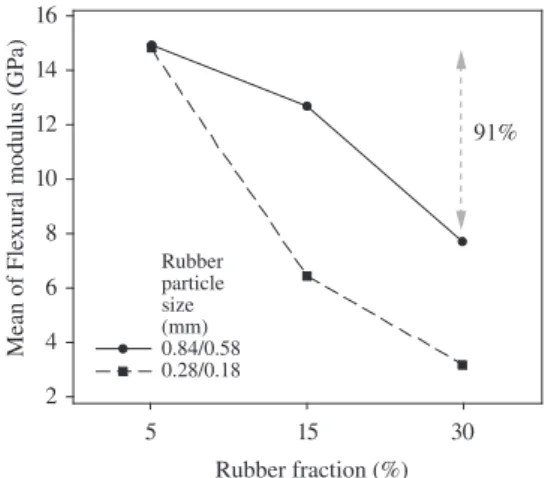
Figure 10 exhibits the interaction effect plot between rubber particle size and fraction. Despite the modulus of elasticity decreases with the rubber particle additions, this behaviour was more evident for the rubber particle size of 0.28/0.18 mm. The finer particles of rubber (0.28/0.18 mm) provided not only the largest reductions in flexural strength, with increasing rubber fraction, but also the largest reductions in flexural modulus.
It is shown in Figure 11 that the reduction of the modulus of elasticity as a function of the rubber particle additions and w/c ratio increasing. The addition of the rubber particles into cementitious composites provides the decrease of mechanical strength and stiffness due to their elastic characteristics. The w/c ratio effect on the mechanical strength is decreased as the increasing of rubber fraction, which can be explained by the reduction amount of cement in the composites. The w/c ratio affects the cement pore formation and, consequently, the strength of the composites, however a small variation is observed from the low (0.35) to high (0.50) level of w/c ratio when the rubber fraction of 30% is set.
3.6.
Microstructural analysis
A scanning electron microscopic (SEM) Hitachi T-3000 was used to observe the microstructure of the cementitious in backscattered electron mode detector with an accelerating
for the water consumption. Thus the rubber particle addition into cementitious matrix leads to an increase in w/c ratio, consequently leading to the formation of a large amount of hydrated products.
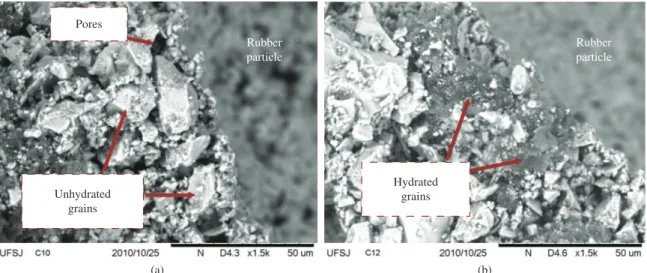
In contrast, Figure 12a exhibits a larger amount of unhydrated cement products around the rubber particle due to the reduction of water provided by the increase of cementitious matrix phase. Comparing the Figure 12a, b, it is possible to observe that the composite C10 exhibits larger amount of pores than composite C12, which confirms the reduction of the hydration process and strength of the composites as a function of rubber particle additions. The SEM images (Figure 12a, b) demonstrate a better interface condition for composite C12, however, there was no macro pore formation in the interface zone (ITZ), which indicates a suitable contact between the rubber particle and the cementitious matrix.
Figure 14 illustrates the surface of fracture of composite C6, fabricated with rubber particle size range 0.84/0.58 mm, in backscatter mode SEM with 1500× of magnification. A Figure 13. Backscatter electron imaging at 2000× of magnification,
rubber particle.
Figure 14. Backscatter electron imaging at 1500× of magnification, composite C6.
and appear less bright29. The hydration products found in most hardened Portland cement pastes primarily consist of C-S-H gel and calcium hydroxide, accompanied by smaller amounts of ettringite and monosulfate29. These hydration products are intermingled with pore spaces.
Figure 12 illustrates the surface of fracture of composites C10 and C12 in backscatter mode SEM with 1500× of magnification from room temperature cured 180 day old. The composites C10 and C12 were manufactured with 15% and 30% of rubber mass fraction, respectively. Correia et al.17 showed that the rubber particles have a spongy morphology with abundant internal porosity, which might be responsible for extra water consumption. Although the presence of pores in the rubber particle surface has been observed (see Figure 13), the effect of water consumption was not of such significance in this research. The formation of unhydrated cement grains was more evident when a small amount of rubber particles were added into cementitious matrix, which means that the cement was largely responsible
brighter area around the rubber particle is shown which suggests the presence of unhydrated cement products. The addition of this large rubber particle size (0.84/0.58 mm) into cementitious composites provided not only high density (Figure 3) and apparent porosity (Figure 4).
4. Conclusions
The addition of rubber particles in a cementitious matrix may lead to new composite materials with interesting properties. The main conclusions and effects will be now described:
• TheDOEwasabletoidentifyinteractionsoffactors which affect the evaluated responses;
• The smaller rubber particle size of 0.28/0.18 mm resulted in a lower density and apparent porosity, as well as the highest mechanical compressive strength of the composites;
• Therubberadditionandw/cratiofactorsdidnotaffect the porosity of the composites;
• Theinerrubberparticlesexhibitedabetterpacking due to their more rounded shape;
• The addition of rubber particles into the matrix phase decreases the amount of cement per volume, consequently increasing the water cement ratio which leaded to the formation of hydrated cement products;
• Thechangefromlow(5%)tohigh(30%)levelof rubber addition provided the reduction of density and compressive strength of the composites;
• The composites manufactured with rubber particle size of 0.84/0.58 mm and 0.35 w/c ratio exhibited larger flexural strength and modulus of elasticity; • The change from high (0.50) to low (0.35) level
of water/cement ratio affected significantly the mechanical strength of the composites providing a percentage variation nearly of 40%;
• Theadditionof30%ofrubberparticlesreducedthe water/cement ratio effect on the mechanical strength of the composites; and
• A compressive strength superior to 20MPa can be achieved by adding 15% of rubber particle size of 0.84/0.58 mm with 0.35 water/cement ratio being a viable and economical recycling alternative for construction applications.
Acknowledgements
The authors would like to thank FAPEMIG for financial support, Holcim for the supply of the Portland cement and Mantiqueira Recauchutadora de Pneus Company for the supply of rubber particles from scrap tyres.
References
1. Frozza AA and Casarotto Filho N. Uma Proposta de Rede Relacional de Empresas: Cooperativa de Abastecimento para uma Usina de Reciclagem de Borracha. In: Anais do Encontro Nacional de Engenharia de Produção - ENEGEP; 1999, Rio de Janeiro, Brazil. ABEPRO; 1999.
2. Batayneh MK, Marie I and Asi I. Promoting the use of crumb rubber concrete in developing countries. Waste Management. 2008; 28:2171-2176. PMid:18956487. http:// dx.doi.org/10.1016/j.wasman.2007.09.035
3. Waste and Resources Action Programme - WRAP. Tyres: Reuse and recycling. Banbury: WRAP; 2007.
4. Singh SS. Innovative applications of scrap-tires. Wisconsin Professional Engineer; 1993.
5. Naik TR, Singh SS and Wendorf RB. Applications of scrap tire rubber in asphaltic materials: state of the art assessment. In: University of Wisconsin-Milwaukee. UWM Center for By-products Utilization. Milwaukee; 1995. Report No. CBU-1995-02.
6. Khaloo AR. Crushed tile coarse aggregate concrete. Cement, Concrete and Aggregates Journal. 1995; 17:119-125. http:// dx.doi.org/10.1520/CCA10137J
7. Bignozzi MC and Sandrolini F. Tyre rubber waste recycling in self-compacting concrete. Cement and Concrete Research. 2006; 36:735-739. http://dx.doi.org/10.1016/j. cemconres.2005.12.011
8. Benazzouk A, Douzane O, Mezreb K and Que’Neudec M. Physico-mechanical properties of aerated cement composites containing shredded rubber waste. Cement and Concrete Composites. 2006; 28:650-657. http://dx.doi.org/10.1016/j. cemconcomp.2006.05.006
9. Benazzouk A, Douzane O, Mezreb K, Laidoud B and Que’Neudec M. Thermal conductivity of cement composites containing rubber waste particles: Experimental study and modelling.
Construction and Building Materials. 2008; 22:573-579. http:// dx.doi.org/10.1016/j.conbuildmat.2006.11.011
10. Chou LH, Lu CK, Chang JR and Lee MT. Use of waste rubber as concrete additive. Waste Management & Research. 2007; 25:68-76. http://dx.doi.org/10.1177/0734242X07067448
11. Paine KA and Dhir RK. Research on new applications for granulated rubber in concrete. Proceedings of the Institution of Civil Engineers: Construction Materials. 2010; 163:7-17.
12. Siddique R and Naik TR. Properties of concrete containing scrap-tire rubber - an overview. Waste Management. 2004; 24:563-569. P M i d : 1 5 2 1 9 9 1 4 . h t t p : / / d x . d o i . o r g / 1 0 . 1 0 1 6 / j . wasman.2004.01.006
13. Ali NA, Amos AD and Roberts M. Use of ground rubber tires in portland cement concrete. In: Proceedings of the International Conference in Concrete 2000; 1993; Dundee. University of Dundee; 1993. p. 379-390.
14. Topcu IB. The properties of rubberized concretes. Cement and Concrete Research. 1995; 25:304-313. http://dx.doi. org/10.1016/0008-8846(95)00014-3
15. Eldin NN and Senouci AB. Rubber-tire particles as concrete aggregate. Journal of Materials in Civil Engineering - ASCE. 1993; 5:478-496. http://dx.doi. org/10.1061/(ASCE)0899-1561(1993)5:4(478)
16. Jingfu K and Yongqi J. Improvement of Cracking-resistance and Flexural Behavior of Cement-based Materials by Addition of Rubber Particles. Journal of Wuhan University of Technology - Materials Science Edition. 2008; 23:579-583.
18. Khatib ZK and Bayomy FM. Rubberized Portland C e m e n t C o n c r e t e . Jo u r n a l o f M a t e r i a l s i n C i v i l Engineering - ASCE. 1999; 11:206-208. http://dx.doi. org/10.1061/(ASCE)0899-1561(1999)11:3(206)
19. Segre N and Joekes I. Use of Tire Rubber Particles as Addition to Cement Paste. Cement and Concrete Research. 2000; 30:1421-1425. http://dx.doi.org/10.1016/ S0008-8846(00)00373-2
20. Ligang Y, Qijun Y and Lan L. Hybrid modified rubber powder and its application in cement mortar. Journal of Wuhan University of Technology - Materials Science Edition. 2010; 35:1033-1037. http://dx.doi.org/10.1007/s11595-010-0144-6
21. Yue L, Min W and Zhanguo L. Physical and mechanical properties of Crumb Rubber Mortar (CRM) with interfacial modifiers. Journal of Wuhan University of Technology - Materials Science Edition. 2010; 25:845-847. http://dx.doi.org/10.1007/s11595-010-0105-0
22. Siddique R. Review: Utilization of waste materials and by-products in producing controlled low-strength materials. Resources, Conservation and Recycling. 2009; 54:1-8. http:// dx.doi.org/10.1016/j.resconrec.2009.06.001
23. Fattuhi NI and Clark NA. Cement-based materials containing shredded scrap truck tyre rubber. Construction and Building Materials. 1996; 10: 229-264. http://dx.doi.org/10.1016/0950-0618(96)00004-9
24. Montgomery DC. Introduction to statistical quality control. John Wiley & Sons; 1997.
25. British Standards. BS12390-3: Testing hardened concrete. Compressive strength of test specimens. BS; 2002.
26. British Standards. BS EN 658-3: Advanced technical ceramics - Mechanical properties of ceramic composites at room temperature - Part 3: Determination of flexural strength. BS; 2002.
27. British Standards. BS EN ISO 10545-3: Ceramic titles Determination of water absorption, apparent porosity, apparent relative density and bulk density. BS; 1997.
28. Panzera TH, Rubio JCC, Bowen C and Walker P. Microstructural design of materials for aerostatic bearings. Cement and Concrete Composites. 2008; 30:649-660. http://dx.doi. org/10.1016/j.cemconcomp.2007.08.013
29. Diamond S. The microstructure of cement paste and concrete - a visual primer. Cement and Concrete Composites. 2004; 26:919-933. http://dx.doi.org/10.1016/j. cemconcomp.2004.02.028