This paper is the irst part of an extensive work focusing the technological development of steel iber reinforced concrete pipes (FRCP). Here is presented and discussed the experimental campaign focusing the test procedure and the mechanical behavior obtained for each of the dosages of iber used. In the second part (“Steel iber reinforced concrete pipes. Part 2: Numerical model to simulate the crushing test”), the aspects of FRCP numerical modeling are presented and analyzed using the same experimental results in order to be validated. This study was carried out trying to reduce some uncertainties related to FRCP performance and provide a better condition to the use of these components. In this respect, an experimental study was carried out us -ing sewage concrete pipes in full scale as specimens. The diameter of the specimens was 600 mm, and they had a length of 2500 mm. The pipes were reinforced with traditional bars and different contents of steel ibers in order to compare their performance through the crushing test. Two test procedures were used in that sense. In the 1st Series, the diameter displacement was monitored by the use of two LVDTs positioned at both extremities of the pipes. In the 2nd Series, just one LVDT is positioned at the spigot. The results shown a more rigidity response of the pipe during tests when the displacements were
measured at the enlarged section of the socket. The iber reinforcement was very effective, especially when low level of displacement was imposed to the FRCP. At this condition, the steel ibers showed an equivalent performance to superior class pipes made with traditional reinforced. The iber content of 40 kg/m3 provided a hardening behavior for the FRCP, and could be considered as equivalent to the critical volume in this condition.
Keywords: concrete pipes, steel ibers, crushing test, mechanical behavior, standards.
A primeira parte deste trabalho se concentra no desenvolvimento tecnológico de tubos de concreto reforçado com ibras (TCRF). São apresenta -dos e discuti-dos os resulta-dos obti-dos em um estudo experimental focado no procedimento de ensaio e na resposta mecânica obtida para cada um dos teores de ibras utilizados nos tubos. Na segunda parte do trabalho (“Tubos de concreto reforçado com ibra de aço. Parte 2: Modelo numérico para simular o ensaio de compressão diametral”), se apresentam os aspectos associados à simulação numérica da resposta mecânica destes tubos. Este estudo foi levado a cabo com a inalidade de tentar reduzir algumas das incertezas relacionadas com o desempenho dos TCRF e proporcionar melhores condições para viabilizar o uso das ibras como elemento de reforço em tubos. Neste sentido, se realizou um trabalho experimental utilizando corpos-de-prova em escala real. O diâmetro destes tubos foi de 600 mm e seu comprimento de 2500 mm. Alguns dos tubos foram reforçados com armaduras convencionais e outros apenas com ibras metálicas com a inalidade de comparar as diferentes res -postas mecânicas no ensaio de três cutelos. Empregaram-se dois procedimentos: numa 1ª série, o deslocamento diametral foi medido por meio de LVDTs posicionados em ambas as extremidades dos tubos, enquanto que, na 2ª série se mediu o deslocamento apenas na ponta dos tubos. Neste sentido, os resultados obtidos demonstraram que a avaliação da rigidez do sistema depende da forma de medida dos deslocamentos. Além disso, foi comprovado que o reforço de ibras metálicas era eiciente, especialmente para níveis de carga próximos às cargas de serviço. Para baixas deformações, os TCRF apresentaram um melhor desempenho em termos de resistência em comparação com os tubos de concreto armado convencional. Por último, se concluiu que o consumo de 40 kg/m3 pode ser considerado o volume crítico de ibras, pois pode obter um encruamento para a resposta estrutural do tubo.
Palavras-chave: tubos de concreto, ibras de aço, ensaio de compressão diametral, normas.
Steel iber reinforced concrete pipes. Part 1:
technological analysis of the mechanical behavior
Tubos de concreto reforçado com ibras de aço. Parte 1:
análise tecnológica do comportamento mecânico
Abstract
Resumo
A. D. De FigueiReDo a
[email protected] A. De lA Fuente b
[email protected] A. AguADo c
[email protected] C. MolinS d
[email protected] P. J. ChAMA neto e
a Department of Construction Engineering, Barcelona Tech (UPC), [email protected], C/Jordi Girona Salgado, 1-3, 08034, Barcelona (Spain) b Department of Civil Construction Engineering, University of São Paulo (USP), [email protected]. Caixa Postal 61548, CEP 05508-900.
São Paulo (Brazil)
c Department of Construction Engineering, Barcelona Tech (UPC), [email protected], C/Jordi Girona Salgado, 1-3, 08034, Barcelona (Spain) d Department of Construction Engineering, Barcelona Tech (UPC), [email protected], C/Jordi Girona Salgado, 1-3, 08034, Barcelona (Spain) e Companhia de Saneamento Básico do Estado de São Paulo (SABESP), [email protected], São Paulo (Brasil).
1. introduction
There is a huge necessity for sewage collecting and treatment sys -tems in underdevelopment countries. The concrete pipes can be con -sidered as a very competitive and sustainable alternative in relation to competitors in the market (Viñolas et al. [1]). Brazil has an instrument
to reduce the deiciency in this segment since publication of the stan -dard ABNT NBR 8890 [2] that allow the use of steel ibers for concrete pipes reinforcement [3]. This standard is equivalent to the European norm NBN-EM 1916 [4]. Both standards allow the use of conventional reinforcement with steel bars also. The pipes must to be veriied in terms of mechanical performance through the crushing test or three-edge bearing test, despite the type of reinforcement used (bars of ibers). However, the steel ibers reinforced concrete pipes (FRCP) are not regularly used in Brazil nowadays, although the Brazilian stan -dard had been published in 2007. One of the main reasons for this situation is related to the doubts concerning the FRCP mechanical performance that still remain in the market segment. These dificul -ties are also associated with the lack of numerical models capable of predicting the behavior of the component accurately. In order to resolve these problems, an experimental study focusing on the be -havioral assessment of concrete sewage pipes was carried out. This study compared the performance between the pipes reinforced with steel ibers (FRCP) and the pipes reinforced with cold drown steel bars. The results turn possible the comparative performance evalua -tion of FRCP and the steel bars reinforced concrete pipes (SBRCP), and also the validation of a proposed numerical model for prediction of the pipe behavior during the crushing strength (de la Fuente et al. [5]). In this study, the inluence of changes in testing methodology in the response of the components was also evaluated.
2. Methodology
The mechanical performance of concrete pipes is regularly mea -sured with the crushing test method as speciied by the standards
ABNT NBR 8890 [2] and EN 1916 [4] (Figure [1]). These standards prescribe two different procedures for the qualiication of pipes, one for SBRCP, and the other for FRCP.
In the case of SBRCP, the pipe is subjected to a continuous loading up to rupture in order to determine the proof and ulti -mate loads. The proof load (Fc) is deined as 0.67 Fn, and Fn is
the minimum crushing load. The strength class is deined by the Fc, and is acceptable to be equal to the crack load (Fcr), corre -sponding to a crack with an opening of 0.25 mm [2] or less than 0.3 mm [4] and length of 300 mm or more according to Brazilian [2] and European [4] standards, respectively. The ultimate load (Fu) is the maximum achieved during testing and shall be equal
or greater than Fn.
In the standard crushing test method for FRCP there is a cyclic loading [2 and 4]. The first cycle consists of loading the pipe until an equivalent level of the proof load of the SBRCP. At this moment, the load is maintained for one minute and the pipe is checked for evidence of any damage. The pipe is rejected if any crack or other damage is observed. Thus, it is required that F
cr shall be greater Fc. Once approved at this stage, the
loading of the pipe is continued until the maximum load (Fu). When the load start to decrease and reach the value of 95% of Fu it shall be release, finishing the first cycle of the test. On the second cycle of the test, the pipe is reloaded up to Fc and held
for one minute. The pipe has to withstand this post-peak proof load in order to be approved. The test procedure established by the European standard [4] is finished at this point. In the specific case of the Brazilian standard [2], the second cycle is continued increasing the loading up to the moment that the pipe reach the maximum measured post-peak load (Fmax,pos).
The F
max,posshall be greater than 1.05Fc, named minimum re
-quired post-peak load (Fmin,pos).
Although there are different test procedures prescribed by the standards to verify pipes with varied types of reinforcement, the continuous test was used in this experimental program in order to evaluate all specimens under uniform conditions of
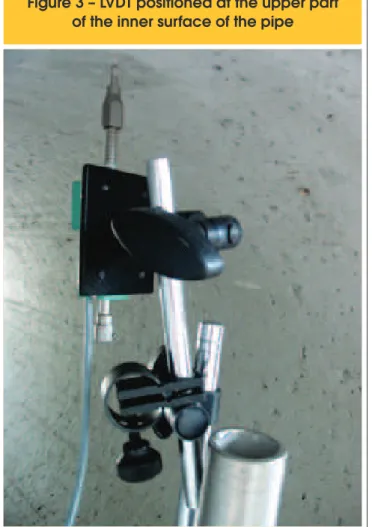
assessment. This solution was chosen because it was prov -en that there is no influ-ence of number of cycles used in the test on the response of FRCP [6 and 7]. Devices were fixed to specimens providing a continuous acquisition of diametral displacement in order to improve the verification of pipes me -chanical behavior during the tests. A similar test set up was used in previous studies [8 and 9]. This system consists of using LVDTs positioned against the upper part of the inner surface of the pipe and attached at supports fixed at the bot -tom part of the pipe as shown in Figures [2] and [3]. The set up used for LVDTs positioning allows the measurement of di -ametral displacements of the pipes without any interference of external strains or dislocations in the results.
This paper presents an experimental program broader than previ -ously published by the same authors [10]. Two test conigurations were used to measure the diametrical displacement of the pipes. At irst one, the measurement of displacement occurred simulta -neously at the spigot and the socket, corresponding to positions A and B (Figures [1] and [2a]). So, that situation turns possible to obtain the curve of load by average diametrical displacement of the pipes. In the second test coniguration, only one LVDT was placed at position A, corresponding to the spigot of the pipe (Fig -ures [1] and [2b]). Thus, two series of pipes were produced with iber and conventional reinforcement to be tested with each of those test conigurations.
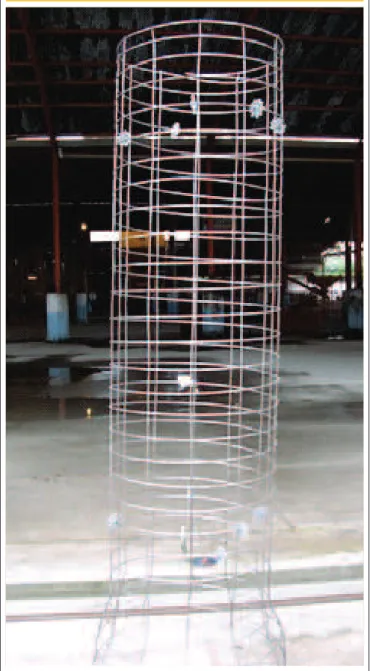
Each series was produced in a single day in order to diminish the inluence of intervening variables in the pipes production. In that sense, the same features and basic materials that were being regularly used by the company were applied for the pipes fabri -cation. The demanded amount of iber was added directly on the aggregates conveyor belt. The rebars set up used is the same that had been routinely used by the factory (Figure [4]). Three levels of steel ibers consumptions (10 kg/m3, 20 kg/m3 and 40 kg/m3) were
produced in each series together with three other SBRCP, totaling 24 pipes per series.
Figure 2 – Configurations adopted for the measurement of displacements
st nd
(A) at both extremities in the 1 Series and (B) at the spigot for the 2 Series
A
B
The main steel reinforcement (transverse reinforcement) was made with cold drawn steel bars (yield strength of 600 MPa) with a di -ameter of 6 mm, and spaced each 85mm. The main reinforcement was positioned at the center of the pipe wall with equal distance for both inner and outer surface. A support reinforcement (longitudinal) made with 6 wires of the same type of steel was also used. The main reinforcement was positioned at the center of the pipe wall. The con -sumption of steel for this family of pipes was approximately 40 kg/ m3. It was observed that the pipes produced with ibers presented a
very good inal inishing of the surface (Figure [5]), which reinforces the idea of the feasibility of its implementation.
After the production, the pipes remained in the storage yard of the factory until the moment of the crushing tests. All pipes were tested over the age of 28 days and at the same time. Other studies [11] found that there was no signiicant change in the behavior of re -inforced concrete pipe in the hardened state when tested at ages ranging from 10 to 96 days. So, it was assured that there was no inluence of age of the pipes in the results. The pipes were pro -duced using the vibro-compression method with high speed (5000 rpm) to compact the concrete. The geometric characteristics of the pipes are presented in Figure [6]. A summary of the differences between the two series is shown in Table [2].
3. Results and Analysis
The characteristic compressive strength of the concrete was 50 MPa, obtained directly from the regular quality control results obtained by the factory. For each pipe, it was recorded the load versus displacement curve during the crushing test. The results obtained with the 1st Series, where the average displacement was measured at the spigot and the socket simultaneously, are pre -sented in Figures [7] to [10]. The results obtained with the mea -surement made only at the spigot, corresponding to the 2nd Series,
are presented in Figures [11] to [14]. In order to facilitate the com -parison between the results, they are also presented in Figures [15] and [16] in terms of average curves obtained for the irst and 2nd Series, respectively. Only two results of the 1st Series were lost Figure 4. Rebars set up used in SBRCP production that served as
a parameter for comparative performance evaluation with FRCP. Some problems were observed molding the 1st Series of pipes due to increased cohesion provided by the steel ibers. These problems were corrected in the 2nd Series by adjusting the moisture of the mixture to
maintain the ixed level of cohesion of the material. There was also changing the cement brand from irst to 2nd Series due to problems with
suppliers. The materials used in this study and its consumption per cubic meter of concrete are presented in Table [1]. The steel iber type used in the experiment was a glued hooked end drawn wire, 60 mm in length and diameter of 0.75mm. So, the aspect ratio of the iber was 80.
Figure 4 – Rebars set up used in SBRCP
production that served as a parameter for
comparative performance evaluation with FRCP
Table 1 – Material and its consumption
per cubic meter of concrete used
in the production of pipes used in
this experimental study
Material
Consumption
(kg/m )
3Fine aggregate I (Natural river sand)
629
Fine aggregate II (crushed sand)
315
Coarse aggregate (crushed stone)
988
Cement (CP III 40 RS)*
329
Water**
141
* A different brand of cement was used for each series of pipes. nd
due to failures in the test system, where the reading of the strain was impaired. Because of that, only two curves are shown in Fig -ures [7] and [8].
The fact that pipes have been tested in real scale caused a re -duction of the results variability. In ordinary tests to determine the toughness of iber reinforced concretes, the coeficient of variation can exceed 20% [12]. This occurs because the crack area (where the ibers act as a stress transfer bridge) is much larger in a tube than in a prismatic specimen. This reduction in variability has been observed in previous studies [7 and 13].
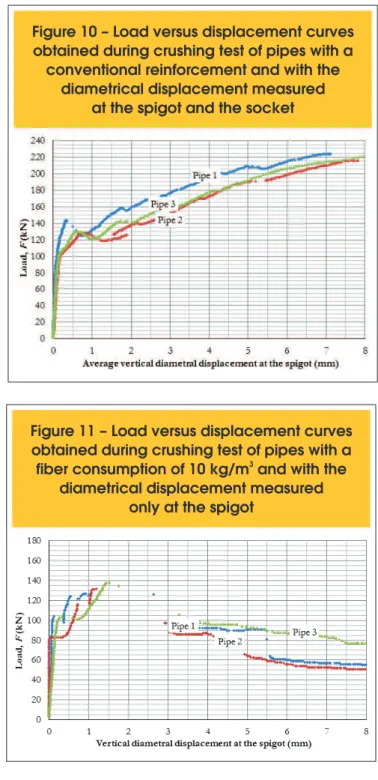
The irst perceptible aspect was the behavior with a well deined pattern for pipes reinforced with smaller amounts of iber. This softening pattern was characterized by a reduction of the strength of the pipe with increasing vertical displacement. The pipes re -inforced with steel bars or 40 kg/m3 of ibers had presented a
Table 2 – Differences between the two series of pipes used in the experimental study
Series
LVDT position
Cement
Water content
First
At the spigot and socket
Brand 1
Fixed on 141 liters/m
3Second
Only at the spigot
Brand 2
Adjusted for each mix (constant consistency)
Figure 5 – General appearance of a
new fiber reinforced concrete pipe
Figure 6 – Geometric characterization
of the pipe used in the experiment
Figure 7 – Load versus displacement curves
obtained during crushing test of pipes with a
3
fiber consumption of 10 kg/m and with the
diametrical displacement measured
hardening pattern, which consists of increasing resisted load with increasing vertical displacement of the pipe. Thus, the resistance displayed by pipes with regular reinforcement was largest than the presented by FRCP at higher displacements. However, for lower strain, the residual strength capacity was greater for FRCP. This occurs because the bars are positioned at the innermost part of the pipe wall and they are mobilized more intensely when there is greater displacement and hence higher level of cracking. On the other hand, the ibers are distributed throughout the thickness of the pipe wall. Thus, the ibers reinforcement is mobilized with small levels of displacement and cracking, which provides better performance in this situation.
In order to facilitate the analysis of the inluence of the setups for measuring displacements in the pipes during the crushing test the results of the average curves obtained with the greater iber content are presented in Figure [17]. The results obtained in the 1st Series, where the displacement measurements were made at the spigot and at the socket simultaneously, had presented higher stiffness in the beginning of the curve. The end of the initial elastic line was prolonged by the inluence of the socket region where the concrete matrix contributes more intensely [14]. For the 2nd Series,
where the displacements were measured only at the spigot, they were more intense for smaller loads, due to lower rigidity of this part
Figure 8 – Load versus displacement curves
obtained during crushing test of pipes with a
3
fiber consumption of 20 kg/m and with the
diametrical displacement measured
at the spigot and the socket
Figure 9 – Load versus displacement curves
obtained during crushing test of pipes with a
3
fiber consumption of 40 kg/m and with the
diametrical displacement measured
at the spigot and the socket
Figure 10 – Load versus displacement curves
obtained during crushing test of pipes with a
conventional reinforcement and with the
diametrical displacement measured
at the spigot and the socket
Figure 11 – Load versus displacement curves
obtained during crushing test of pipes with a
3
fiber consumption of 10 kg/m and with the
diametrical displacement measured
of the pipe. The difference observed in the pattern of the curves obtained in the two series of test is only attributed to geometric factors, and the characteristics of matrix and type of reinforcement have no inluence on the results. So, the displacement measured at the socket will always be smaller than the one measured at the spigot. In that sense, the enlargement of the socket is the main factor inluencing the pattern of the curves at the elastic region. Due to the fact that the spigot will present a higher level of dis -placement, this region will present the higher level of strain and, consequently, will reach the elastic limit sooner. So, is possible to conclude that the cracking of the pipes always begins at the spigot,
because the concrete reaches its elastic strain limit in this region before it occurs in the socket. In the particular case of this study it occurs around 80 kN of loading, when the stiffness of the compo -nent was greatly reduced. As the displacements measured in the 2nd Series were much superior to the 1st Series due to the previ -ously discussed loss of stiffness, it is also possible to conclude for the equivalence of the two behaviors, because both series reached close levels to residual strength. It should be emphasized that this pattern of behavior is totally consistent with the model proposed by de la Fuente et al. [5] for numerical modeling of pipes behavior
during the crushing test.
An important aspect to have attention is the fact that it is impos -sible to carry out the standard cyclic test with pipes reinforced with 40 kg/m3 of steel ibers. The dificulty occurs because of the hard
-Figure 12 – Load versus displacement curves
obtained during crushing test of pipes with a
3
fiber consumption of 20 kg/m and with the
diametrical displacement measured
only at the spigot
Figure 13 – Load versus displacement curves
obtained during crushing test of pipes with
3
a fiber consumption of 40 kg/m and with the
diametrical displacement measured
only at the spigot
Figure 14 – Load versus displacement curves
obtained during crushing test of pipes with
conventional reinforcement and with the
diametrical displacement measured
only at the spigot
Figure 15 – Average load versus diametrical
displacement curves of pipes tested
ening behavior of these pipes. In this particular case, the drop in post-peak strength at low displacements could not possible be ob -served. Thus there will be a high level of displacement and crack -ing when the unload-ing was done dur-ing the regular cyclical test. So, the standard procedure had the implicit concept that the FRCP should always show a softening behavior to turn possible to per -form the cyclical test. Thus, the continuous measurement system using LVDTs provides greater reliability to the test in these situa -tions. Especially when the serviceability conditions associated to the level of crack opening is considered.
There were also regions of post-peak instability in the crushing test response, similar to those observed by Figueiredo [7] when low amounts of iber were used. This instability is provoked by the pro -cess of slipping and loss of adhesion of the ibers, in addition to possible rupture of some of them, occurring during the stress trans -fer from the matrix to the ibers. Furthermore, the increase in iber content enhanced the cracking load of the matrix, corresponding to the end of the initial linear part of the curve. This, however, became clear only for the 1st Series of pipes. In this series there was an in -crease of the material cohesion due to the iber addition in to the ma -trix. So, there was the correction of water content in the concrete for the 2nd Series in order to maintain the level of mobility of the matrix.
In that situation, the increase in water/cement ratio gives a reduction of the matrix strength, which reduced the contribution of iber to the elastic behavior of the component. Although this, a reduction in the load at the end of the elastic part of the curves was not observed. It occurs due to the increase in the iber content that had improved the tensile strength capacity of concrete pipe.
It was observed that the pipes also met the requirements of the standards [2 and 4] for Class AE2. In the case of pipes with 600 mm nominal diameter the Brazilian [2] and European [4] standards require that the pipes have to present a load control of 36 kN/m and an ultimate load of 54 kN/m. As the pipe length was 2.5 m, it accomplish that a total load control is 90 kN per pipe, and a ulti -mate load is 135 kN per pipe.
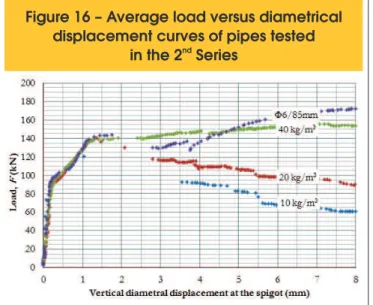
Checking the average results presented in Figures [15] and [16], it is possible to igure out that all SBRCP exceeded both the control and ultimate load by a wide margin, especially in the 1st Series. In this
particular case, the limit of the elastic behavior reached about 130 kN (less than the proof load where the pipe may have a certain level of cracking). The average ultimate load was 230 kN, obtained direct -ly from the test machine record system because it occurs when the displacement was larger than the measurement limit of the LVDTs. With these results, these pipes were about to it the requirement of the superior class (EA3 for the Brazilian standard), which requires control and ultimate loads of 135 kN and 202.5 kN, respectively. In the 2nd Series, the results were slightly lower than the irst one for
the ultimate strength, which reached the averaged load of 174.7 kN. Since the end of the initial elastic segment was close to 90 kN, it is possible to afirm that the pipes reached the standards requirement narrowly. Anyway, it is possible to consider them as appropriate to the requirements of the standards for class EA2.
Observing the curves presented in Figures [15] and [16], it is possible to afirm that there is proximity between the behavior of SBRCP and FRCP in the irst half of the load versus displace -ment curves. This behavior occurs in more intense way until a vertical displacement of about 0.4 mm and 2 mm for the irst and 2nd Series respectively. The FRCP with 40 kg/m3 exceeded the
strength loads of SBRCP until displacements of about 2.5 mm and 4.5 mm for the irst and 2nd Series respectively. It is possible to
afirm that the FRCP presented a similar behavior to a superior class of SBRCP in those circumstances. The initial region of the curves could be associated to the serviceability limit state or, in other words, corresponding to the elastic or low level of cracking behavior. So, the iber contribution will be more effective for the pipes service life than the contribution presented by the steel bars. Note that all the pipes of the 1st Series showed the initial elastic part of the curve slightly exceeding 100 kN. With respect to this aspect, it was observed that cracking began, in all cases, at the top of the section A with values of Fcr around 90 kN. On the other
hand, in the pipes from the 2nd Series, it was observed that the ap -pearance of the irst cracks coincided with the change in the slope of the load-displacement curve. This change was not detected in the pipes from the 1st Series until the springline had also cracked,
Figure 16 – Average load versus diametrical
displacement curves of pipes tested
ndin the 2 Series
Figure 17 – Comparison between the average
curves measured at the socket and
st
spigot (1 Series) and only at the spigot
nd 3
a situation which took place when load F reached average values of 126 kN, 114 kN and 138 kN for the pipes with 10 kg/m3, 20 kg/
m3 and 40 kg/m3, respectively. So, the loadF
cr can be deduced
from the load-displacement curve at the point where the irst slope change takes place. On the other hand, if the measurement is per -formed as in the 1st Series, this procedure would lead to values of Fcr on the side of insecurity, requiring a visual inspection in order to detect Fcr., which could indicate if the control load its the standard requirements. Since the load displacement curves obtained to the 2nd Series of tests showed that linear region inishing when the load
was about 90 kN. Thus, these pipes would be probably approved because is possible to associate this level of loading to the Fcr.. The Brazilian standard requirements [2] for FRCP are a little broad -er than the European [4]. This is because, besides the load control (Fc) of 90 kN and ultimate load (Fu) of 135 kN, common to both, the
Brazilian standard requires a minimum post-peak load (Fmin,pos) of 94, 5 kN. This fact increases the importance of the post-peak resid -ual strength of the pipes. As the tests performed for this study have not the cycle of loading, this parameter could not be determinate
in order to evaluate if the pipes comply with the requirements. Nev -ertheless, a displacement level was ixed in order to determining a residual strength in the post-peak region to assess the inluence of the iber in this speciic behavior of the pipe. The results presented in Table [3] and also in Figures [15] and [16] were used for the evaluation of this condition. As tests were performed continuously without re-loading cycle, it was adopted a reference displacement a little beyond post-peak instability limit for each series. Conse -quently, the displacements of 1.2 mm and 3 mm were adopted for determining the post-cracking load for the irst and 2nd Series,
respectively. The different level of displacement was chosen due to the disparity in geometric rigidity of pipes observed when the displacement was measured only at the spigot or at the spigot and socket. That condition provides different level of displacement for the same level of cracking and post-peak residual strength. In Figures [18] and [19] are presented the correlations between the iber content and ultimate load (Fu) and the post-cracking load at
Table 3 – Maximum load and maximum post-peak load obtained in the two series of tests
Series
C
f3
(kg/m )
F (kN)
uF
1.2mmy F (kN)
3mmIndividual values Average
Individual
values
Average
st
1
10
149
120
n/a
135
107
94
n/a
101
20
140
124
n/a
132
118
102
n/a
110
40
156
163
149
156
-
-
-
-
nd
2
10
127
132
138
132
97
88
98
94
20
151
145
129
142
121
120
108
116
40
152
140
193
162
-
-
-
-
Figure 18 – Correlations between ultimate
load and fiber content for both series of tests
Figure 19 – Correlations between fiber
content and the post-peak load at the
displacements of 1.2 mm and 3 mm for
nd
the displacements of 1.2 mm and 3 mm, for the irst and 2nd Series
respectively. It is possible to observe clearly that the ibers content interferes in both parameters. The linear regression between iber content and ultimate load or post-cracking load provide good level of correlations, as shown by the coeficients of correlation. Thus, this type of curves can be used in a mix-design procedure, if the variability of the test is well known. However, the iber mix-design in order to accomplish a required post-peak residual strength has a greater relevance when the Brazilian standard [2] is used for pipes control.
4. Final remarks
The performance demonstrated by the FRCP was higher than the presented by the SBRCP when they were submitted to low -er levels of displacement and cracking. A similar behavior has been observed in previous studies [9]. This fact occurs because the ibers are mobilized early in the process of cracking due to their position along the wall surface of the component. Since the steel bars are eventually being placed along the neutral line, by the requirement of minimum coverage, it will demand a high level of displacement and cracking in order to mobilize their resistance. So, the behavior of FRCP with low contents of iber is typically softening, while the pipes with rebars present a typical hardening behavior. Thus, even for low iber consump -tions, the performance of FRCP is comparable or even superior to SBRCP at low cracking and displacement level. This is par -ticularly interesting since this is the stage of primary interest to the component application because the pipes are still in good conditions to meet the durability requirements. Moreover, in the particular case of this experimental study, the SBRCP had much better performance than the prescribed class. It also indicates that the iber reinforcement is so eficient that approximates the behavior of FRCP to the one presented by a higher class SBRCP at the serviceability conditions.
It has been shown that the iber content affects equally the ultimate load as the post-peak maximum load presented by the pipe in the crushing strength test. For this reason, it is important to take into account the contribution of the iber in mix design analysis of the FRCP concerning to meeting the requirements of the ultimate and maximum post-peak load.
The results also conirmed the critical condition related to the spigot displacement in relation to the socket area. This fact shows that the component displacement measured at this po -sition could be associated to the more demanding pipe condi -tion in terms of displacement and crack initia-tion. However, this is a conservative approach concerning only to the test method, since the spigot will be protected by the follow pipe socket during use. This effect, however, is not applicable to pipes where the socket has no enlargement [2] [4]. Thus, the crushing test carried out in pipes which diametrical displacement is measured only at the spigot is very much in favor of security. Furthermore, this ar -rangement test proved to be much more suitable to evaluate the pipes performance. This occurs because, for pipes with higher iber consumptions, it would not be possible to verify when the load drops to 95% of its value at low level of displacement. In that situation, the technician in charged to run the test could not observe the right moment to impose the end of the irst cycle and start up the second one.
5. Acknowledgements
The authors of this paper wish to express their appreciation for the support received from Fermix Indústria e Comércio Ltda. and Belgo Bekaert Arames that turns possible the entire experimental work.
Likewise, Professor Antonio D. de Figueiredo wishes to thank the support provided by CAPES -Coordenação de Aperfeiçoamento de Pessoal de Nível Superior– for having awarded him the post -doctoral grant that allowed him to participate in this work.
6. References
[01] VIÑOLAS, V., AGUADO, A., JOSA, A. Evaluación de la sostenibilidad en tuberías de saneamiento. II Congreso UPC Sostenible 2015, Barcelona, Spain, 2009.
[02] ASSOCIAÇÃO BRASILEIRA DE NORMAS TÉCNICAS. Tubo de concreto, de seção circular, para águas pluviais e esgotos sanitários. NBR 8890, ABNT, Rio de Janeiro. 2007.
[03] FIGUEIREDO, A. D., CHAMA NETO, P. J. A nova especiicação brasileira para tubos de concreto para águas pluviais e esgoto In: 49º Congresso Brasileiro do Concreto CBC 2007, Instituto Brasileiro do Concreto (IBRACON), Bento Gonçalves. 2007. [04] NBN EN1916 Concrete pipes and ittings,
unreinforced, steel ibre and reinforced. Belgisch Instituut voor normalisatie (BIN), Brussel, December 2002. [05] de la Fuente, et al. Steel iber reinforced concrete
pipes. Part 2: Numerical model to simulate the crushing test. Revista RIEM. In press.
[06] FIGUEIREDO, A.D.; CHAMA NETO, P. J.; QUINTA, M. T.; GIMENEZ, A. B. Avaliação de metodologia de ensaio de tubos de concreto reforçado com ibras para esgoto. Concreto (São Paulo). Instituto Brasileiro do Concreto (IBRACON). Vol.XXXIV, p.44 - 51, 2007. [07] FIGUEIREDO, A.D. de. Evaluation of the test method
for crushing strength of steel iber reinforced concrete pipes. 7th International RILEM Symposium on Fibre Reinforced Concrete, Chennai, India, 2008. [08] RAMOS, M. F. Análise experimental de tubos de
concreto reforçado com ibras de aço. Campinas, UNICAMP. Universidade Estadual de Campinas. Faculdade de Engenharia Civil. Dissertação (Mestrado em Engenharia Civil). Campinas, 2002. [09] CHAMA NETO, P.J.; FIGUEIREDO, A.D. de.
Avaliação de desempenho mecânico de tubos. Revista DAE, 2008, Vol. 178, p. 34-39.
[10] de la FUENTE, A., FIGUEIREDO, A. D., AGUADO, A., MOLINS, C. CHAMA NETO, P. J. Experimentación y simulación numérica de tubos de hormigón com ibras. Materiales de Construcción, 2011, Vol. 61, n° 302, p. 275-288.
[11] de la FUENTE, A., AGUADO, A., MOLINS, C. Modelo numérico para el análisis no lineal de secciones prefabricadas construidas evolutivamente. Hormigón y Acero, 2008, Vol. 57, n° 247, p. 69-87.
shop on Fiber Reinforced Concrete and Other Advanced Materials. Toronto, Canada, 1995. Proceedings. p.29-50.
[13] LAMBRETCHS, A. Performance clases for steel ibre reinforced concrete: Be critical, 7th International RILEM Symposium on Fibre Reinforced Concrete, Chennai, India, 2008.