ISSN 0104-6632 Printed in Brazil
www.abeq.org.br/bjche
Vol. 22, No. 03, pp. 453 - 462, July - September, 2005
Brazilian Journal
of Chemical
Engineering
EXPERIMENTAL VAPOR-LIQUID EQUILIBRIA
DATA FOR BINARY MIXTURES OF XYLENE
ISOMERS
W.L. Rodrigues
1, S. Mattedi
1*and J. C. N. Abreu
21PPEQ-EP/BA Universidade Federal da Bahia-UFBA
Rua Aristides Novis nº 02, Federação, CEP: 40210-630, Salvador - BA, Brazil E-mail: [email protected]; [email protected]
2 BRASKEM Unidade de Insumos Básicos S.A
Rua Eteno nº. 1361, Pólo Petroquímico, CEP: 42810-000, Camaçari - BA, Brazil E-mail: [email protected]
(Received: November 20, 2003 ; Accepted: October 28, 2004 )
Abstract - Separation of aromatic C8 compounds by distillation is a difficult task due to the low relative
volatilities of the compounds and to the high degree of purity required of the final commercial products. For rigorous simulation and optimization of this separation, the use of a model capable of describing vapor-liquid equilibria accurately is necessary. Nevertheless, experimental data are not available for all binaries at atmospheric pressure. Vapor-liquid equilibria data for binary mixtures were isobarically obtained with a modified Fischer cell at 100.65 kPa. The vapor and liquid phase compositions were analyzed with a gas chromatograph. The methodology was initially tested for cyclo-hexane+n-heptane data; results obtained are similar to other data in the literature. Data for xylene binary mixtures were then obtained, and after testing, were considered to be thermodynamically consistent. Experimental data were regressed with Aspen Plus 10.1 and binary interaction parameters were reported for the most frequently used activity coefficient models and for the classic mixing rules of two cubic equations of state.
Keywords: Xylenes; Liquid-vapor equilibrium; Experimental data.
INTRODUCTION
Xylene isomers are of great importance to petrochemical industries, since these substances are bases for the synthesis of many organic compounds. For example, p-xylene is oxidized to teraphtalic or dimethylteraphtalic acid as the first stage in polyester production. Xylenes are normally produced as a mixed stream which contains mainly p-xylene, m-xylene, o-xylene and ethylbenzene. Separation of C8 aromatic compounds by distillation is a difficult task and the columns, in general, have more than 200 stages and a high reflux ratio due to the low relative volatilities of the compounds and to the high degree of purity required of the final commercial products.
(GC). Experimental data were regressed with Aspen
Plus 10.1 and binary interaction parameters were
reported for the most frequently used activity coefficient models and for classic mixing rules of two cubic equations of state (Peng and Robinson (1976) and Soave-Redlich-Kwong (Soave, 1972) modified by Mathias et al. (1984)).
EXPERIMENTAL SECTION
Material
The xylenes used in this work were supplied by BRASKEM Unidade de Insumos Básicos. Cyclohexane was supplied by Nitrocarbono S/A and n-heptane was obtained from Merck. All compounds were used without any additional purification. The m-xylene and the o-xylene used were purified with equipment refered to as the Spinning Band Distillation System from BR Instrument Corporation (Figure 1). This equipment is used for purification of solvents and preparation of chromatographic
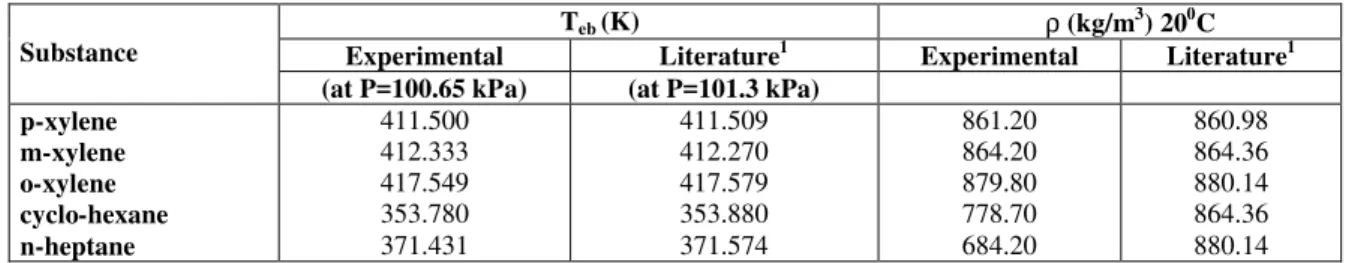
patterns; the process basically consists of distillation with a high reflux ratio (> 200). P-xylene was purified in many crystallization stages: the solution was initially refrigerated at 283.15 K and after crystals formed, it was maintained at room temperature for 30 minutes and then filtered; after refiltering the solid was then remelted and the process was repeated until the required purity was achieved. All the compounds used were passed through a molecular sieve with a 0.3 nm pore diameter, manufactured by UNION CARBIDE, in order to remove any free water. The normal boiling point (at 100.65 kPa) was determined with the equilibrium cell and relative density was measured in a digital Anton Paar DMA45 by German Weber S.A. Table 1 shows that the normal boiling point and relative density for the compounds used are quite close to the values found in the literature, although local atmospheric pressure is slightly lower than 101.3 kPa. The chromatographic analyses showed a minimum purity of 99.93% for p-xylene, of 99.75% for m-xylene, of 99.85% for o-xylene, of 99.82% for cyclohexane and of 99.37% for n-heptane.
Figure 1: Spinning band distilllation System
Table 1: Normal boiling points (Teb) and relative densities (ρ) of pure compounds
Teb (K) ρ (kg/m3) 200C
Substance Experimental Literature1 Experimental Literature1
(at P=100.65 kPa) (at P=101.3 kPa)
p-xylene m-xylene o-xylene cyclo-hexane n-heptane
411.500 412.333 417.549 353.780 371.431
411.509 412.270 417.579 353.880 371.574
861.20 864.20 879.80 778.70 684.20
860.98 864.36 880.14 864.36 880.14
Apparatus and Procedure
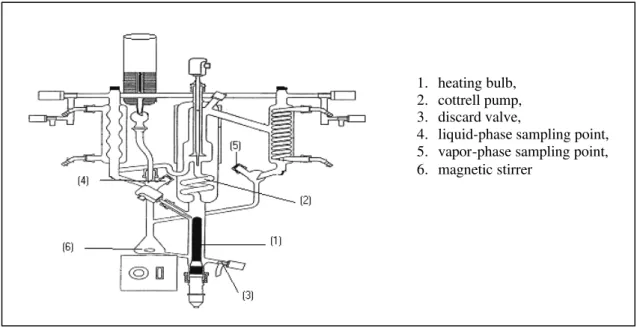
In this work, isobaric data on vapor-liquid equilibria were obtained in a modified Fischer ebuliometer (Figure 2) with recirculation of both liquid and vapor phases. Equilibrium was normally reached after 15 minutes. Heating of the mixture was regulated in order to achieve a mean speed of 30
drops per minute. Samples of 0.02 µl were taken
from the condensed vapor and liquid and analyzed with a Shimadzu gas chromatograph equipped with a
flame ionization detector (FID). A 60 m × 0.32 mm
× 0.5 µm capillary column (type LM100) of
polyethylene glycol was used and the area of the
peaks was integrated by a Hewlett-Packard 3390A. Data points were the average of three injections of each phase; the standard deviation of the mole fraction was less than 0.001.
The equilibrium temperature was measured with a digital thermometer from Systemteknik with a 0.001 K resolution using a Pt 100 sensor positioned at the Cottrell pump (2), shown in Figure 2. Pressure was measured with a 0.01 kPa resolution. The equipment operates at pressures ranging from 0.25 to 300 kPa (absolute) and temperatures up to 523.15 K. Pressure and temperature sensors were calibrated using the same method described by Castro (1996).
Figure 2: Modified Fischer cell.
RESULTS
Experimental Data
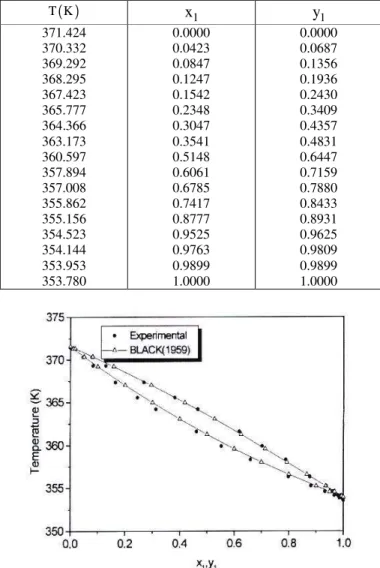
In order to test the method, data for cyclohexane(1)+n-heptane(2) were obtained and are shown in Table 2. This system, on which a great deal of consistent thermodynamic data have been published in the literature, is used as reference. Data were compared to those presented by Black (1959) [published in Gmehling et al. (1980)]; the results obtained in this work are similar to data in the literature as can be seen in Figure 3, and the experimental procedure was considered satisfactory.
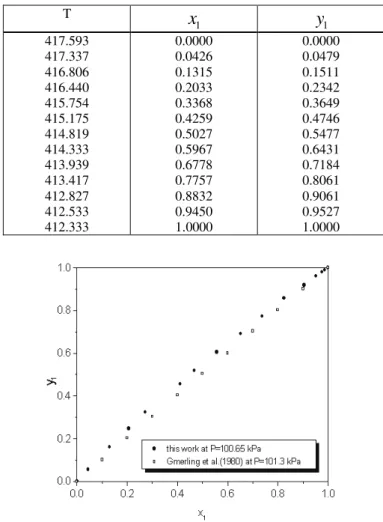
In Tables 3 to 5 VLE experimental data obtained for the xylene(1) + m-xylene(2), p-xylene(1) + xylene(2) and m-p-xylene(1) + o-xylene(2) systems are presented. All experimental data were obtained twice as both sets of results were always very close, the mean values were reported. Gas chromatographic analysis of each phase was repeated three times, and again as the three results are very close, the mean results were reported.
Figure 4 shows that the p-xylene + m-xylene experimental data obtained in this work are similar to data published by Gmehling et al. (1980), although they were obtained at a slightly different pressure (in this work P=100.65 kPa and in Gmehling et al. (1980) P= 101.3 kPa).
1. heating bulb, 2. cottrell pump, 3. discard valve,
Table 2: Experimental VLE data for the cyclohexane(1) + n-heptane(2) system at pressure 100.65 kPa
( )
T K x1 y1
371.424 370.332 369.292 368.295 367.423 365.777 364.366 363.173 360.597 357.894 357.008 355.862 355.156 354.523 354.144 353.953 353.780
0.0000 0.0423 0.0847 0.1247 0.1542 0.2348 0.3047 0.3541 0.5148 0.6061 0.6785 0.7417 0.8777 0.9525 0.9763 0.9899 1.0000
0.0000 0.0687 0.1356 0.1936 0.2430 0.3409 0.4357 0.4831 0.6447 0.7159 0.7880 0.8433 0.8931 0.9625 0.9809 0.9899 1.0000
Figure 3: Comparison between data obtained in this work and data from Black (1959)
[published by Gmehling et al. (1980)] for the cyclohexane (1) + n-heptane(2) system.
Table 3: Experimental VLE data for the p-xylene(1) + m-xylene(2) system at pressure 100.65 kPa
T
1
x
y
1412.333 412.273 412.155 412.112 411.952 411.909 411.806 411.744 411.695 411.630 411.550 411.527 411.500
0.0000 0.0435 0.1276 0.2149 0.4277 0.5352 0.6266 0.7151 0.7944 0.8469 0.9130 0.9989 1.0000
Table 4: Experimental VLE data for the p-xylene(1) + o-xylene(2) systems at pressure 100.65 kPa
T x1 y1
417.593 417.175 416.627 416.139 415.762 414.920 414.544 414.041 413.636 413.091 412.427 412.053 411.729 411.667 411.623 411.500
0.0000 0.0438 0.1298 0.2063 0.2719 0.4116 0.4666 0.5578 0.6518 0.7368 0.8243 0.9053 0.9519 0.9751 0.9874 1.0000
0.0000 0.0557 0.1611 0.2469 0.3235 0.4567 0.5176 0.6047 0.6914 0.7724 0.8568 0.9186 0.9606 0.9793 0.9899 1.0000
Table 5: Experimental VLE data for the m-xylene(1) + o-xylene(2) systems at pressure 100.65 kPa
T
1
x
y
1417.593 417.337 416.806 416.440 415.754 415.175 414.819 414.333 413.939 413.417 412.827 412.533 412.333
0.0000 0.0426 0.1315 0.2033 0.3368 0.4259 0.5027 0.5967 0.6778 0.7757 0.8832 0.9450 1.0000
0.0000 0.0479 0.1511 0.2342 0.3649 0.4746 0.5477 0.6431 0.7184 0.8061 0.9061 0.9527 1.0000
Figure 4:Comparison between data obtained in this work and data from
Thermodynamic Consistency Test
In order to verify the quality of the data obtained, it is necessary to verify whether they are thermodynamically consistent. In this work, the test proposed by Van Ness et al. (1973) and modified by Fredenslund et al. (1977) was used. This method consists of generating values for a variable, usually pressure or composition of the vapor phase, based on the measures of other variables; the dependence on temperature was modeled with a fourth-order Legendre polynomial. Thus, there is an objective function to be minimized, which was the quadratic sum of the difference between experimental and calculated pressures. The data are considered to be consistent if the absolute mean deviation between composition of the experimental and the calculated vapor phases is lower than 0.01.
Table 6 reports the calculated values for vapor composition pressure in the thermodynamic consistency test. As all calculated deviations in composition were less than 0.01, all systems were
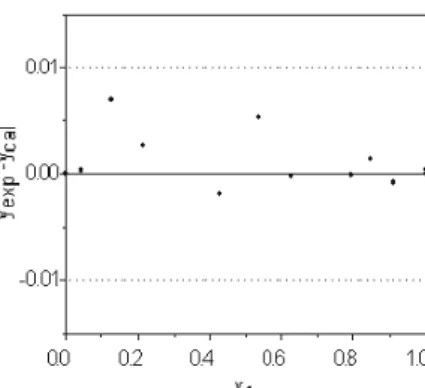
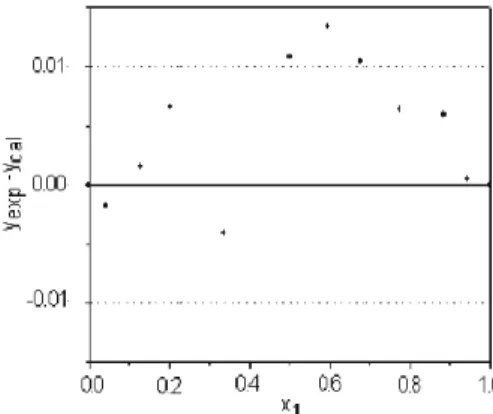
considered thermodynamically consistent. As a further consistency test, the residuals obtained at each point for the entire composition range were analyzed, as suggested by Wisniak (1999). The residuals should be well distributed within both limits (±0.01, marked as a dotted line in the figures). Figures 5 to 8 show the residuals calculated for the four systems studied. For the cyclo-hexane+n-heptane (Figure 5), p-xylene+m-xylene (Figure 6) and m-xylene-o-xylene (Figure 8) systems the residuals were always well distributed within the limits and only a few points fell slightly outside of the range. However, for the p-xylene + o-xylene system (Figure 7), the majority of the points obtained had positive errors and four of them were outside of the range. This indicates that there is probably a systematic error, and thus this system fails the consistency test proposed by Wisniak (1999), although the absolute mean deviation for vapor-phase composition was less than 0.01 and the system was considered consistent by the test proposed by Fredenslund et al. (1977).
Table 6: Results of the thermodynamic consistency test of experimental data
System
1σ(y) 1σ
(P)
cyclohexane+n-heptane 0.0069 0.0085
p-xylene + m-xylene 0.0019 0.0008
p-xylene + o-xylene 0.0084 0.0024
m-xylene + o-xylene 0.0073 0.0031
1 exp cal i
i 1
(M) M M ,
N
where M y or P and N number of experimental point s
σ = −
= =
∑
Figure 5: Deviation from experimental data obtained
for the cyclohexane(1) + n-hexane(2) system.
Figure 6:Deviation from experimental data obtained
Figure 7: Deviation from experimental data obtained
for the system p-xylene(1) + o-xylene(2).
Figure 8:Deviation from experimental data obtained
for the m-xylene(1) + o-xylene(2) system.
Data Regression
Data were regressed to obtain binary interaction parameters for the most frequently used activity coefficient models (NRTL (Renon and Prausnitz, 1968), UNIQUAC (Abrams and Prausnitz, 1975) and Wilson (1964)). In this case, the vapor phase was modeled by using the virial equation with the second virial coefficients calculated by Hayden and O'Connell (1975).
However, as the systems studied are nonpolar,
isomers should only have small deviations of ideality. Both phases of the system should be well represented by a cubic equation of state, and then the Peng-Robinson EOS (Peng and Robinson, 1976)
binary interaction parameters (kij) were also
generated for the classic mixing rules. Parameter fitting were performed by the data regression system
(DRS) included in the Aspen Plus10.1 simulator
that uses Britt and Luecke's (1973) method, which is based on the maximum-likelihood principle. The objective function, which was minimized, is given by
(
) (
2) (
2) (
2)
2 N,cal ,exp ,cal ,exp ,cal ,exp ,cal ,exp
2 2 2 2
P T x y
1
P P T T x x y y
F
=
− − − −
= + + +
υ υ υ υ
∑
i i i i i i i ii
(1)
where υ are all variances, pressure and temperature
variances were estimated from the equipment resolutions (0.001K and 0.01kPa, respectively) and the variances of liquid- and vapor-phase compositions were calculated from the experimental data, since each point was analyzed three times (the deviation was usually less than 0.001 in mole fraction). Bubble pressure and composition are calculated, but deviation in all properties is included in the objective function, as proposed in the maximum-likelihood principle, in order to include experimental uncertainties (for further details see Britt and Luecke (1973)).
Table 7 contains the values of the interaction parameters for the activity coefficient models and mean deviations between experimental and calculated pressure and vapor-phase composition. In Table 8 binary interaction parameters and the absolute mean deviation between experimental and predicted values for each variable for the Peng-Robinson EOS are presented. All deviations are quite small and suggest that these systems could be well represented by any of these models.
(Figure 10), the Txy plot is not quite well represented, since a small deviation in pure boiling temperatures could be noted.
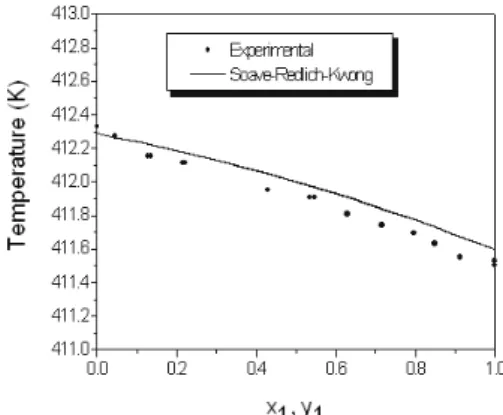
In order to improve these predictions, another cubic equation of state was used; the Soave-Redlich-Kwong EOS (Soave, 1972) modified by Mathias et al. (1984) was chosen, since this EOS normally represents pure vapor pressures very accurately and
is available in the Aspen Plus10.1 software.
Classic mixing rule interaction parameters were also fitted to experimental data and results are also reported in Table 8. Figures 11 and 12 show Txy plots for p-xylene+m-xylene and p-xylene-o-xylene, and it could be observed that although there is a difference in the pure boiling points for the p-xylene+m-xylene system, an unusual plot is no longer obtained and the p-xylene+o-xylene system is well represented.
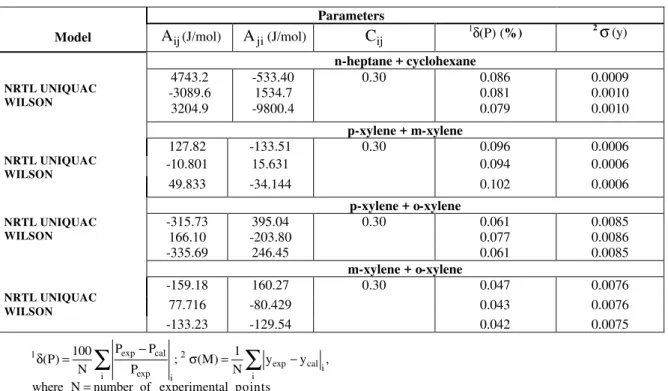
Table 7: Binary interaction parameters of the activity coefficients models, relative mean deviation in the pressure and absolute mean deviation in the vapor-phase composition
Parameters
Model Aij(J/mol) Aji(J/mol) Cij 1δ(P) (%) 2σ(y)
n-heptane + cyclohexane
4743.2 -533.40 0.30 0.086 0.0009
-3089.6 1534.7 0.081 0.0010
NRTL UNIQUAC
WILSON 3204.9 -9800.4 0.079 0.0010
p-xylene + m-xylene
127.82 -133.51 0.30 0.096 0.0006
-10.801 15.631 0.094 0.0006
NRTL UNIQUAC WILSON
49.833 -34.144 0.102 0.0006
p-xylene + o-xylene
-315.73 395.04 0.30 0.061 0.0085
166.10 -203.80 0.077 0.0086
NRTL UNIQUAC WILSON
-335.69 246.45 0.061 0.0085
m-xylene + o-xylene
-159.18 160.27 0.30 0.047 0.0076
77.716 -80.429 0.043 0.0076
NRTL UNIQUAC WILSON
-133.23 -129.54 0.042 0.0075
1 exp cal 2
exp cal i exp
i i i
P P
100 1
(P) ; (M) y y ,
N P N
where N number of experimental points
−
δ = σ = −
=
∑
∑
Table 8: Binary interaction parameters of the classic mixing rules of cubic EOS (Peng-Robinson and Soave-Redlich-Kwong modified by Boston-Mathias) and absolute mean
deviation in the systems
System kij 1σ (y) 1σ (x) 1σ (P) 1σ (T)
Results with Peng and Robinson (1976) cyclo-hexane+n-heptane
p-xylene + m-xylene p-xylene + o-xylene m-xylene + o-xylene
0.00851 -0.0024 -0.0019 -0.0030 0.0004 0.0017 0.0083 0.0073
3.5 x 10⁻⁶ 1.7 x 10⁻⁵ 0.0061 6.7 x 10⁻⁵
0.0035 0.0005 0.0017 0.0006 0.0047 0.0005 0.0014 0.0006
Results with SRK modified by Mathias et al. (1984) cyclo-hexane+n-heptane
p-xylene + m-xylene p-xylene + o-xylene m-xylene + o-xylene
0.00851 -0.00053 -0.00016 -0.00095 0.0004 0.0012 0.0078 0.0071
2.0 x 10⁻⁶ 1.4 x 10⁻⁵ 8.1 x 10⁻⁵ 0.0001 0.0042 0.0005 0.0017 0.0006 0.0038 0.0048 0.0017 8.1 x 10⁻⁵
1
exp cal i i
1
(M) M M ,
N
where M y, x, P or T and N number of experimental point s
σ = −
= =
Figure 9:Txy curve for the p-xylene(1) +
m-xylene(2) system at P=100.65 kPa for the Peng-Robinson correlation results.
Figure 10: Txy curve for the p-xylene(1) +
o-xylene(2) system at P=100.65 kPa for the Peng-Robinson correlation results.
Figure 11: Txy curve for the p-xylene(1) +
m-xylene(2) system at P=100.65 kPa for the SRK modified by Mathias et al. (1984) correlation
results.
Figure 12: Txy curve for the p-xylene(1) +
o-xylene(2) system at P=100.65 kPa for the SRK modified by Mathias et al. (1984) correlation
results.
CONCLUSIONS
In this work, VLE experimental isobaric data on three binary systems of xylene isomers were obtained at 100.65 kPa. The systems have low relative volatility and there is a maximum difference of 6 K in the normal boiling point of the pure compounds for all three systems studied. Data were obtained in a modified Fischer cell, where equilibrium was normally reached after 15 minutes, and samples for vapor and liquid phases were analyzed by gas chromatography. The method was initially tested using the cyclo-hexane+n-pentane system as reference and the data obtained is similar to those in the literature.
The data were considered thermodynamically consistent in agreement with the point test of Van Ness et al. (1973), modified by Fredenslund et al. (1977). As a further consistency test, the residuals obtained at each point for the entire composition
range were also analyzed as suggested by Wisniak (1999); residuals presented for the majority of the systems were always well distributed within the limits and only a few points were slightly out of range.
EOS (modified by Mathias et al. (1984)), since pure normal boiling points are better predicted.
NOMENCLATURE
A,C Binary interaction parameters of
activity coefficients models
F Objective function
k Binary interaction parameters of cubic
equations of state
P Pressure (kPa)
T Temperature (K)
N Number of points
x Liquid-phase mole fraction
y Vapor-phase mole fraction
Subscripts
cal Calculated
Eb Normal boiling point
exp Experimental
1 More volatile component
i , j Chemical species
Greek Letters
δ Relative mean deviation
ρ Relative density
σ Absolute mean deviation
ACKNOWLEDGMENTS
The authors acknowledge the finantial support received from BRASKEM Insumos Básicos. W.L.R also thanks CAPES and S.M. thanks PRODOC/FAPESB-SEPLANTEC.
REFERENCES
Abrams, D.S. and Prausnitz, J.M., Statistical Thermodynamics of Liquid Mistures: A New Expression for the Excess Energy of Partially or
Completely Miscible Systems, AIChE.J, 21, 116
(1975).
Britt, H.I. and Luecke, R.H., The Estimation of Parameters in Nonlinear Implicit Models,
Technometrics, 5, No. 2, 233 (1973).
Castro, L.A.F., Determinação de Dados de Equilíbrio Líquido-Vapor e Modelagem Termodinâmica de Sistemas Contendo Álcool Alílico. MSc Thesis. University of Campinas, Faculdade de Engenharia Química, Brazil (1996).
Fredenslund, A., Gmehling, J. and Rasmussen, P., Vapor–Liquid Equilibria Using UNIFAC. Elsevier. Amsterdam (1977).
Gmehling, J., Onken, U. and Arlt, W., Vapor-Liquid Equilibrium, Data Collection Aromatic Hydrocarbon, DECHEMA, 1, No. 7, Frankfurt (1980).
Hayden, J.G. and O’Connell, J.P.A., Generalized Method for Predicting Second Virial Coefficients, Ind. Eng. Chem. Res., 14, 209 (1975).
Llopis, F.J. and Montón, J.B., Isobaric Vapor-Liquid Equilibria of p-Xylene + o-Xylene and m-Xylene + o- Xylene Systems at 6.66 and 26.66 kPa, J. Chem. Eng. Data, 39, No. 1, 53-55 (1994). Mathias, P.M., Boston, J.F. and Watanasiri, S.,
Effective Utilization of Equations of State for Thermodynamics Properties in Process Simulation, AICHE J., 30, 182-186 (1984). Peng, D.-Y. and Robinson, D.B., A New
Two-Constant Equation-State, Ind. Eng. Chem. Fundam., 15, 59-64 (1976).
Renon, H. and Prausnitz, J.M., Local Composition in Thermodynamics Excess Function for Liquid Mixtures, AIChE J, 14, No. 1, 135-144 (1968). Riddick, J.A., Bunger, W.B. and Sakano, T.K.,
Organic Solvents. 4th ed, Wiley Interscience, New York (1986).
Soave, G., Equilibrium Constants from a Modified Redlich-Kwong Equation of State, Chem. Eng. Sci., 27, 1197 (1972).
Stryjek, H. and Vera, J.H., An Improved Peng-Robinson Equation of State for Accurate Vapor-Liquid Equilibrium Calculations, Can. J. Chem. Eng., 64, 334-340 (1986).
Van Ness, H.C., Byer, S.M. and GIBBS, R.E., Vapor-Liquid Equilibrium. Part I. An Appraisal for Data Reduction Methods, AIChE J, 19, No. 2, 238 (1973).
Wilson, G.M. Vapor-Liquid Equilibrium XI. A New Expression for the Excess Free Energy of Mixing, J. Am. Chem. Soc., 86, 127 (1964).