Abstract— A three-dimensional PIC simulation of a 35 GHz, 200 kW two cavity gyroklystron amplifier has been performed to study the electron beam and RF wave interaction behavior using a commercial PIC code ‘MAGIC’. The electromagnetic field analysis of the RF structure in the absence of the electron beam and beam-wave interaction study in the presence of the electron beam have been carried out for the performance evaluation of the device. Electromagnetic field analysis has been done using the eigenmode solver, which ensures the structure operation in the desired TE01 operating mode at 35 GHz frequency. Electron beam and RF wave interaction simulation confirm that the present gyroklystron meet the required specification in terms of output power and gain. Moreover, the particles phase space behavior along the interaction length has been also demonstrated to realize the energy transfer phenomena. An output power around 200 kW at 34.95 GHz with ~35% efficiency and a bandwidth of 0.29% have been obtained considering no spread in electrons velocity. Our simulated result matches with the experimental values within 8%.
Index Terms— Fast-wave device, Microwave tube, Millimeter-wave high
power amplifier, PIC simulation.
I. INTRODUCTION
Conventional microwave tubes, like, klystron, TWT, etc., are not capable of radiating high power in
the millimeter and sub millimeter waves range. The RF power level reduces at the higher frequencies
due to the limiting factors, like, DC power dissipation, RF losses, electron current density, heat
transfer capability, material breakdown, etc. Efforts to narrow down this technological gap led to
research and development of fast-wave microwave tubes operating in the millimeter-wave and
sub-millimeter-wave frequency bands, for instance, gyrotron-devices based on CRM and Weibel
instabilities. In gyro-devices, an electron beam moving in helical trajectories interacts with the
transverse component of RF electric field supported by a waveguiding structure in the fast-wave
regime. Gyroklystron is a fast-wave electron-beam device which combines the multi-cavity klystron
configuration with the cyclotron resonance maser (CRM) instability energy extraction mechanism of
the gyrotron. Its operation is similar to a conventional klystron except that electron bunching occurs in
the transverse direction rather than in the axial direction and the overmoded cavities are used [1-2].
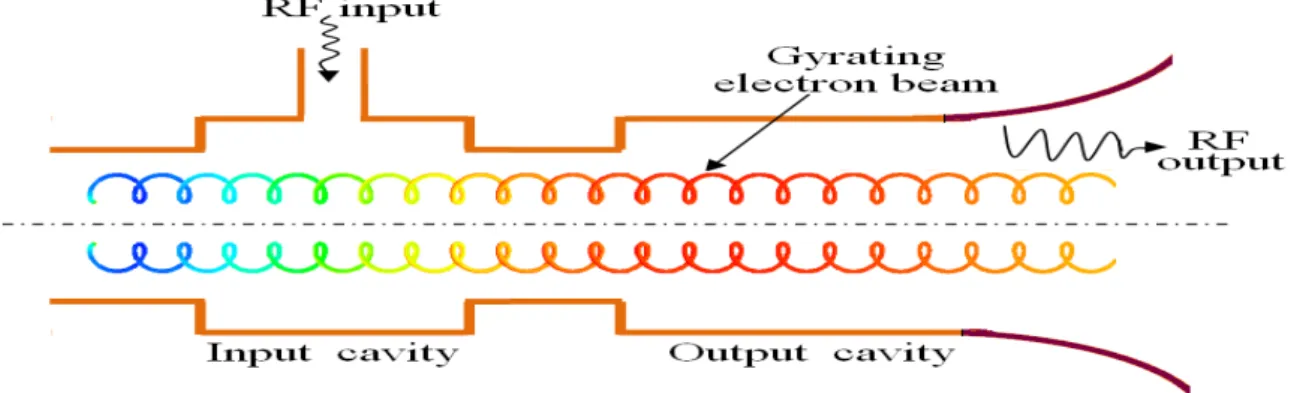
This scheme makes them useful at the higher frequencies with larger cavity dimensions. The
Fig. 1. Schematic of a two-cavity gyroklystron.
Presently, considerable research interests have grown up for the gyroklystrons due to their
capabilities to provide high gain with moderate bandwidth in the mm-wave regime. Gyroklystron’s
applications include plasma heating, industrial heating, material processing, active plasma
diagnostics, radar communications, particle accelerators, spectroscopy, etc. [2-3]. In the Ka-band
regime, a two cavity gyroklystron had been successfully developed at IAP, Russia, which is capable
of delivering an output power of 750 kW at center frequency 35 GHz in the TE021 mode with 24%
efficiency and 20 dB gain [4]. Later on, a detailed study of 200 kW two-cavity, three cavity and four
cavity Ka band gyroklystrons for millimeter wave radars was carried out at the Naval Research
Laboratory of United States [5-7]. In the W band regime, a four-cavity gyroklystron amplifier
producing 100 kW peak power and 10 kW average power at center frequency around 94 GHz with a
bandwidth 700 MHz has been developed at the Naval Research Laboratory, USA for new high power
radar named WARLOC [8]. Recently, Zasypkin et al. at the Institute of Applied Physics, Russia
reported the experimental results of a 93.2 GHz gyroklystron amplifier operating in TE021 mode [9]. In
this experiment, a peak output power of 340 kW with 27% efficiency, 23 dB saturated gain, and
0.41% (380 MHz) bandwidth was obtained using a 75 kV, 17 A electron beam [9].
To demonstrate the mathematical models for the design and analysis of gyroklystron using
self-consistent as well as linear and nonlinear approaches; a number of literature have been published
[10-14]. These approaches have also been adopted for the optimization of device efficiency and RF
output power. With the advent of fast computers, particle-in-cell (PIC) simulation offers a lot of
insight in understanding as well as supporting the established theories. Presently, PIC codes are
widely used by the researchers to investigate the RF behavior of the gyro-devices and also helpful in
optimizing the device performance. There are two-dimensional as well as three-dimensional codes.
Some of these codes are CHICPIC, MAFIA, Particle Studio, MAGY and ARGUS. The simulation
code MAGY developed at the University of Maryland and Naval Research Laboratory, is a large
signal time-dependent multimode code used for simulation of slow and fast wave microwave tubes
[15-16].
analysis (cold, in the absence of the electron beam) and the electron beam RF wave interaction
analysis (hot, in the presence of the electron beam) have been carried out in detail for this purpose.
The eigenmode and field analysis is performed in the absence of electron beam using eigenmode
solver to ensure the device operation in the desired mode and frequency. The exact operating mode is
confirmed by observing electric and magnetic field patterns and their variations along radial as well as
in axial directions. Further, the electron beam and RF wave interaction simulation is carried out for
the performance evaluation of the gyroklystron amplifier in all respects. The results obtained from the
present study are validated with the experimental results reported in the literature [5].
II. PICSIMULATION
The process of designing a gyroklystron includes the choice of the RF operating mode
corresponding to the RF interaction structure, electron beam parameter, and magnetic field. The
finalization of the RF interaction structure consists of several steps. First, the resonance frequency and
quality factor with a desired field profile for each of the cavities are chosen. Based on this
information, cavities shape, size and connecting drift tube radii are selected. To ascertain this,
electromagnetic analysis of gyroklystron structure is carried out in the absence of the electron beam,
also known as the cold analysis. The results obtained from the cold analysis are used to predict the
electron beam and RF wave interaction behavior of the gyroklystron device in the presence of the
electron beam which is also known as the hot analysis. At this point, the various device input
parameters, such as, beam current, voltage, transverse to axial beam velocity ratio (pitch factor),
guiding center radius and magnetic field values are judiciously chosen with the help of its parametric
analysis. The operating current and the magnetic field are mainly decided by the start oscillation
current criteria study, necessary for the stable operation of the device. The coupling coefficient curve
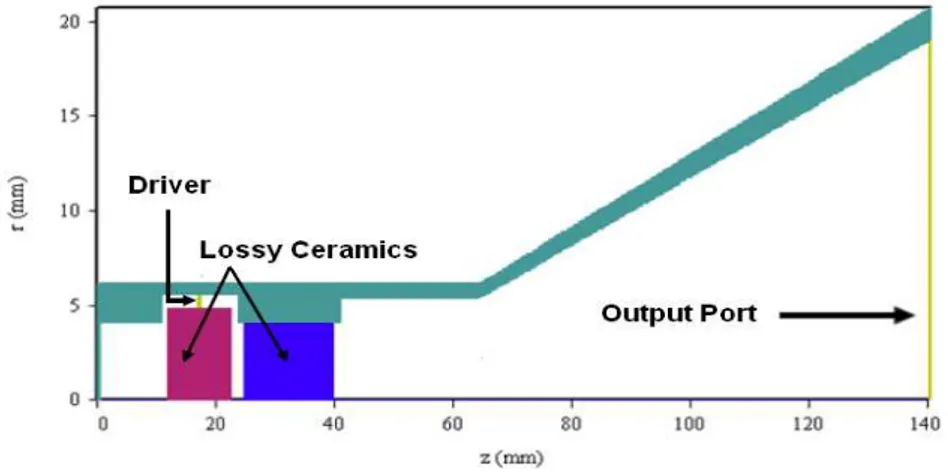
Fig. 2. Cross-section of a two cavity gyroklystron interaction structure.
A three-dimensional structure consisting of all-metal cylindrical cavities, is modelled using the
cylindrical coordinate system (z, r, θ) for PIC simulation using ‘MAGIC’ code. Material properties of
the cavities wall are typically assigned as metal (copper) to reduce the ohmic losses. The conductivity
of the copper used in the simulation is taken as 5.8 × 10⁷ S/m. A port has been assigned at the output
taper end to observe the output signal. The cross-sectional view of the model used in the PIC
simulation is shown in Fig. 2. Proper meshing is made for the discretization of the structure to get
fast converging results. External loading in the RF input cavity is done to achieve the desired quality
factor by observing the EM energy decay inside the cavity. Drift tube is externally loaded to avoid
any cross-talk between the two cavities by absorbing the field leaked from the cavities. In ‘MAGIC’
software CONDUCTANCE command is used to define the lossy material. The CONDUCTANCE
command specifies a finite conductivity (mhos/m) within an object. It must be a volume in a 3D
simulation. The conductance may be entered by specifying the conductivity of the material.
Conductivity will be applied only within the specified object and will result in an additional current
as specified by Ohm’ Law, J = σ E, which is applied to Ampere’s Law as an additional current
source. The ohmic power dissipated due to this conductance material allows us to achieve the desired
quality factor [17]. In our simulation, we have used the conductance of material = 0.01 mhos/m for
loading the input cavity. The conductance of material = 0.04 mhos/m has been taken for loading the
drift tube.
The gyrating electron beam of desired guiding center radius is introduced at the input end of the
interaction structure with the help of gyro beam emission command of this PIC code. The gyro
emission produces a beam center axis parallel to the externally applied magnetic field. The external
static magnetic field of strength 1.31 T is applied axially along the interaction structure. The typically
selected design parameters for the present work are taken from the reported experimental results of J.
J. Choi [5]. The RF input and output cavities lengths for the present gyroklystron are taken as 1.5λ
and 2.75λ, respectively, for the operating TE01 mode resonating at 35 GHz [5]. The length of the RF output cavity is taken larger than that of the input cavity to enhance the electron beam and RF wave
gyroklystron, firstly, the desired mode of operation at the desired operating frequency is selected by
simulating the structure in the absence of the electron beam. Secondly, RF output power and the gain
of the two-cavity gyroklystron are obtained by simulating the structure in the presence of the electron
beam.
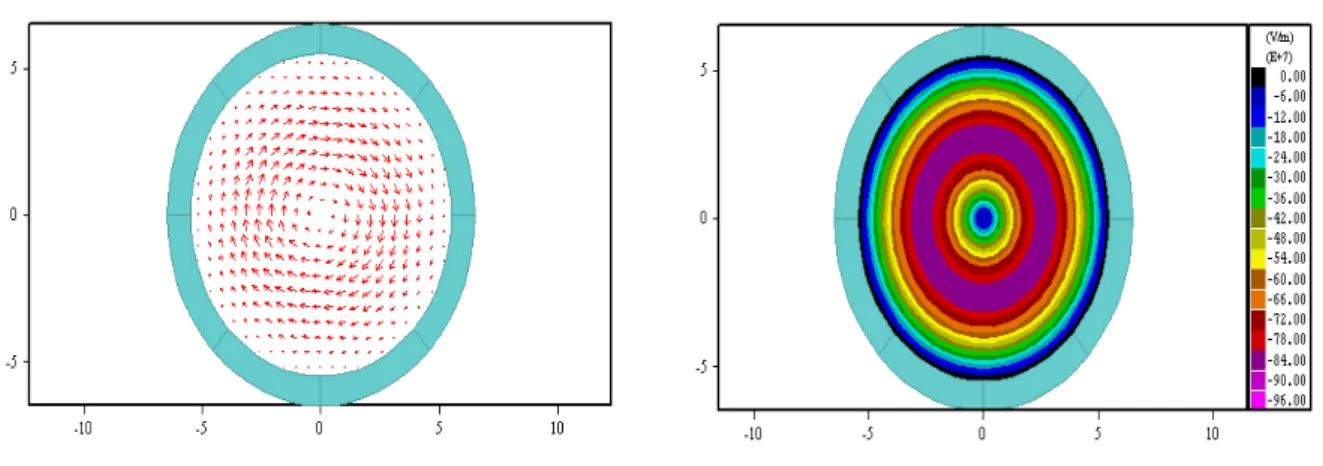
Fig. 3. Electric field distribution for input cavity of gyroklystron.
Fig. 4. Contour plot of electric field for input cavity of gyroklystron.
A. Eigenmode and Electromagnetic Fields
Electromagnetic simulation of the gyroklystron cavities has been carried out before the PIC
simulation to observe the desired operating mode and resonant frequency in the absence of the beam
using eigenmode analysis. Using this technique, the presence of the desired mode inside the cavities is
confirmed by observing the electric field pattern. Figs. 3 and 4 show the vector and contour plots of
electric field, respectively, of the input cavity of the gyroklystron which indicates that the desired TE01
mode is present inside the cavity. The overall quality factor of a cavity can be obtained using well
known relation,
Qtotal
1
1Qohmic
1
1Qdiffractive
1. The diffractive quality factor for a closed cavity is usually very high. Therefore, the total quality factor of the cavity is approximately equal to theohmic quality factor. The gyroklystron cavity is loaded with lossy ceramics to achieve the desired
quality factor. The total quality factor of gyroklystron cavity is decided by making use of start
oscillation criteria study. The quality factor is chosen in such a way that the device can operate in the
stable region without going into the oscillation regime. In the present work, the loaded quality factor
of the cavity is optimized to the desired value through external loading. For the estimation of the
excitation frequency 35 GHz. The decay of EM energy inside the cavity is observed for the estimation
of the loaded quality factor. The EM energy decays slowly inside this cavity, which demonstrates the
resonant behavior of the interaction structure. For our present simulation, loaded quality factor is
obtained ~200. In Fig. 4, the required quality factor for the input cavity has been obtained.
B. Electron Beam and RF Wave Interaction
The hot analysis of gyroklystron is demonstrated by introducing the gyrating electron beam with a
beam current of 8.2 A and beam voltage of 70 kV at the left end of the interaction structure. The
guiding center radius used here is 2.65 mm. The velocity spread effects are assumed to be zero for
carrying out the present simulation. Since, provision for the inclusion of velocity spread effects is not
present with PIC code ‘MAGIC’. In experimental devices, 5% to 10% velocity spread is always
present, which deteriorates the electron bunching due to degradation in the quality of the electron
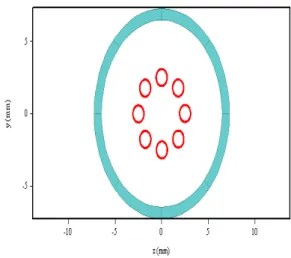
beam as a result of which both output power and efficiency of the device decreases [10]. Here, eight
beamlets are considered to perform the present simulation. Fig. 6 shows the cross sections of electron
beamlets before interaction and Fig. 7 shows the cross sections of electron beamlets at the RF output
port after the interaction time of 200 ns. The phase of all particles observed in each beamlets, confirm
that all beamlets have a constant phase relationship with each other. Fig. 8 shows the time variation of
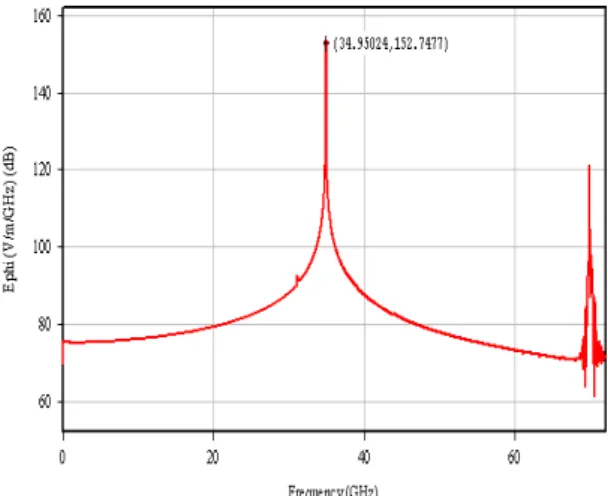
electric field amplitude developed at the RF output cavity. The frequency of operation is validated by
observing the Fourier transform of the azimuthal electric field component of the time growing signal
at the RF input and output cavity. Fig. 9 shows the obtained frequency spectrum at the output cavity,
characterized by single frequency component, peaked at 34.95 GHz, which validates the frequency
and mode of operation in our case. The other noticeable peak of the electric field amplitude is found
to be at 70 GHz, which is corresponding to TE02 mode of operation. It is clear from figure 9 the
amplitude difference between TE01 and TE02 modes is good enough (~32 dB) to ensure that there will
be no mode competition.
Figs.10 and 11 show the evolution of electronic energy and power along axes, respectively. It can
be seen that at the output end, the net electron energy and power are decreasing, indicating an energy
transfer from the electrons to the RF wave. The RF input signal is applied to the input cavity with the
help of an input driver. The DRIVER command specifies a prescribed current-density source to drive
electromagnetic fields in a local region of space. The desired mode corresponding to desired
frequency and power can be excited with the help of this command. The power developed across this
driver serves as the RF input power for our device. In our simulation, the RF input power is ~ 922 W.
The hot beam results predict an output power corresponding to this input power is ~ 200 kW at 34.95
GHz. The growth rate of RF output power with time is shown in Fig. 12. The variation of RF output
power and gain achieved as a function of input power using MAGIC code has been shown in Fig. 13.
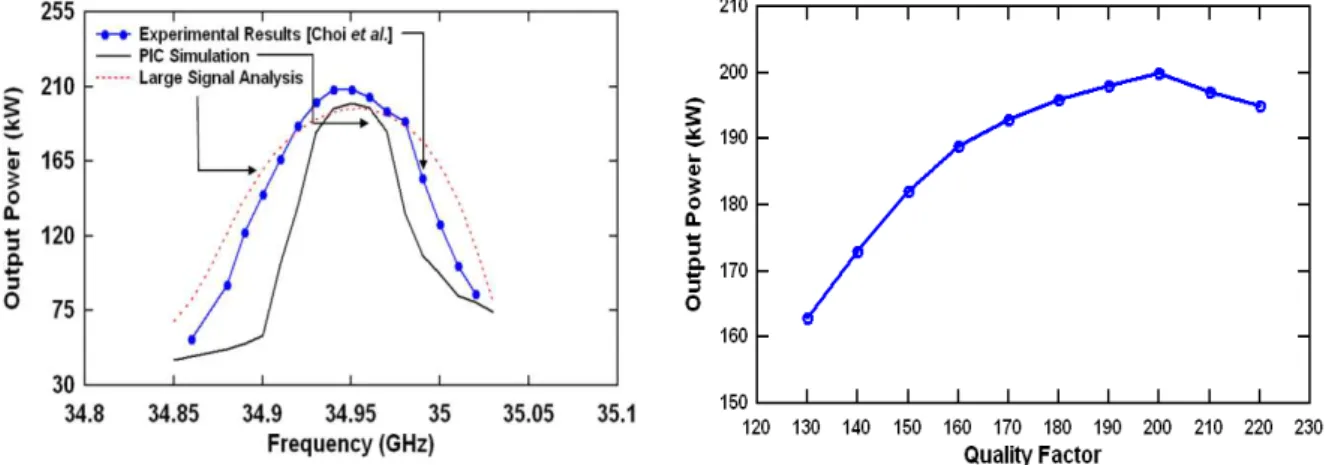
The bandwidth calculation of the device is done by plotting the output power and efficiency as a
maximum output power is obtained ~ 200 kW at Q = 200.
Fig. 5. Quality factor for input cavity of gyroklystron. Fig. 6. Cross section of electron beamlets before interaction.
Fig. 8. Time domain variation of the field magnitude recorded
using probe at the output cavity.
Fig. 9. Observed frequency spectrum of electric field at the output cavity.
Fig. 10.Evolution of particles energy along axes. Fig. 11.Axial variation of electron positive power.
Fig. 14. Dependence of output power on frequency. Fig. 15. Output power as a function of the quality factor of output cavity.
IV. CONCLUSION
PIC simulation studies of electron beam and RF wave interaction behavior for a cylindrical two
cavity gyroklystron have been done using a three-dimensional commercial PIC code ‘MAGIC’.
Simulations have been performed in both the electron beam absent and present cases. In order to
ensure the device operation at the desired mode, frequency and quality factor, the electron beam
absent simulation is performed. The simulation is further extended to the electron beam present case
to study the beam wave interaction behavior of the device under investigation. Bunching phenomena
in phase space is explicitly observed along the interaction length.The Fourier transform of the time
varying field developed across the output cavity confirms the exact frequency of operation in the
beam present case. Our simulation demonstrates that the present gyroklystron produces an output
power ~ 200 kW with 35% efficiency. The gain of the gyroklystron is ~ 23.4 dB and the bandwidth is
0.29%. The results obtained here matches within 8% with the reported experimental values.
ACKNOWLEDGMENT
One of the authors (Madan Singh Chauhan) is thankful to Centre of Advanced Study (University Grant Commission), Department of Electronics Engineering, IIT (BHU), for financial support.
REFERENCES
[1] Steven H. Gold and Gregory S. Nusinovich, “Review of high-power microwave source research, Review ofScientific Instruments,” Vol. 68, pp. 3945-3974, 1997.
[2] V. L. Granatstein and W. Lawson, “Gyro-amplifiers as candidate RF drivers for TeV linear colliders,” IEEE Trans. Plasma Sci., Vol. 24, pp. 648–665, 1996.
[3] Manfred Thumm, State-of-the-art of high power gyro-devices and free electron masers, KIT Scientific Reports 7606, 2011.
[4] I. I. Antokov, E. V. Zasypkin, and E. V. Sokolov, in Proceedings of the 18th International Conference On IR and MM Waves, ColchesterUK, Vol. 2104, pp.338–339, 1993.
[5] J. J. Choi, A. H. McCurdy, F. N. Wood, R. H. Kyser, J. P. Calame, K. T. Nguyen, B. G. Danly, T. M. Antonsen, B. Levush, and R. K. Parker, “Experimental investigation of a high power, two-cavity, 35 GHz gyroklystron amplifier,”
[6] J. P. Calame, M. Garve, J. J. Choi, K. Nguyen, F. Wood, M. Blank, B. G. Danly, and B. Levush, “Experimental studies of bandwidth and power production in a three-cavity, 35 GHz gyroklystron amplifier,” Physics of Plasmas, Vol. 6, pp. 285-297, 1999.
[7] M. Garven, J. P. Calame, K.T. Nguyen, B. G. Danly,B. Levush, and F. N. Wood, “Experimental studies of a four -cavity, 35 GHz gyroklystron amplifier,” IEEETrans. Plasma Sci., Vol. 28, No. 3, pp. 672-680, 2000.
[8] M. Blank, B. G. Danly, B. Levush, J. P. Calame, K. Nguyen, D. Pershing, J. Petillo, T. A. Hargreaves, R. B. True, A. J. Theiss, G. R. Good, K. Felch, B. G. James, P. Borchard, P. Cahalan, T. S. Chu, H. Jory, W. G. Lawson, and T. M. Antonsen, “Demonstration of a 10 kW average power 94 GHz gyroklystron amplifier,”Physics of Plasmas, Vol. 6, pp. 4405-4409, 1999.
[9] E. V. Zasypkin, I. G. Gachev, and I. I.Antakov, “Experimental Study Of A W-Band Gyroklystron Amplifier Operated in the High-Order TE021Cavity Mode,” Journal of Radiophysics and Quantum Electronics, Vol. 55, pp. 309-317, 2012.
[10] T. M. Tran, B. G. Danly, K. E. Kreischer, J. B. Schutkeker, and R. J. Temkin “Optimization of gyroklystron efficiency,” Physics of Fluids, Vol. 29, pp. 1274-1281, 1986.
[11] I. I. Antakov, M. A. Moiseev, E. V. Sokolov, and E. V. Zasypkin, “ Theoretical and experimental investigation of X -band two-cavity gyroklystron,” International Journal of Infrared and Millimeter Waves, Vol. 15, pp. 873-887, 1994. [12]Jianxun Wang, Yong Luo, Yong Xu, and HongFu Li, “Theoretical and numerical investigation of a four-cavity TE021
-mode gyroklystron,” Int. Journal of Infrared Millimeter Waves, Vol. 29, no.12, pp. 1113-1122, Dec. 2008.
[13] Guo Jianhua, Yu Sheng, Li Xiang, and Li Hongfu, “Study on nonlinear theory and code of beam-wave interaction for gyroklystron,” Journal of Infrared, Millimeter, and THz. Waves, Vol. 32, no. 11, pp. 936-944, Dec. 2011.
[14] M. S. Chauhan, M. V. Swati, and P. K. Jain, “ Estimation of the electronic efficiency of a gyroklystron amplifier,” Int. Journal of Microwaves Applications, Vol. 2, no. 1, pp. 23-27, Feb. 2013.
[15]Jun Zhou, Dagang Liu, Chen Liao, and Zhenghao Li, “CHICPIC: A highly efficient code for electromagnetic PIC modeling and simulation,” in Proc. high power particle beams (BEAMS), Xi'an, China,pp. 1-5, 2008,.
[16]K. T. Nguyen, B. Levush, T. M. Antonsen, Moti Botton, Monica Blank, J. P. Calame and B. G. Danly,“Modeling of gyroklystrons with MAGY,” IEEE Trans. Plasma Sci., Vol. 28, no. 3, pp. 867-886, Jun. 2000.