*e-mail: [email protected]
Electro-Thermomechanical Characterization of
Ti-Ni Shape Memory Alloy Thin Wires
Maria Marony Sousa Farias Nascimentoa, Carlos José de Araújob*, José Sérgio da Rocha Netoa, Antonio Marcus Nogueira de Limaa
a
Department of Electrical Engineering, Universidade Federal de Campina Grande,
Av. Aprígio Veloso, 882, Bodocongó, Campina Grande - PB, Brazil
b
Department of Mechanical Engineering, Universidade Federal de Campina Grande,
Av. Aprígio Veloso, 882, Bodocongó, Campina Grande - PB, Brazil
Aprígio Veloso, 882, Bodocongó, Campina Grande - PB, Brazil
Received: December 2, 2004; Revised: July 13, 2005
The use of shape memory alloys (SMA) as smart structures and other modern applications require a previous evaluation of its performance under load as well as a training procedure. In general, these requirements lead to the design and assembly of a specific test bench. In this work, an experimental set-up was specially designed to perform the electro-thermomechanical characterization of SMA wires. This apparatus was used to determine the strain-temperature (ε - T) and electrical resistance-temperature (R - T) hysteretic characteristics curves of a Ti-Ni shape memory wire (90 mm in length and 150 µm in diameter) under mechanical load. The SMA wire is loaded by means of constant weights and a controlled system for injection of electrical power allows performing the heating-cooling cycles. The obtained hysteretic ε - T and R - T characteristics curves for some levels of applied loads are used to determine important shape memory parameters, like martensitic transformation temperatures, temperature hysteresis, temperature slopes and shape memory effect under load. These parameters were in accord with the ones found in literature for the studied SMA wires.
Keywords: shape memory alloys, Ti-Ni alloys, thermomechanical behavior, smart materials
1. Introduction
Shape memory alloys (SMA) are active metallic materials clas-sified nowadays as “smart” or “intelligent” materials along with piezoelectric ceramic and polymers, eletroactive plastics, elec-tro-rheological and magneto-rheological fluids and others. These materials are naturally considered as sensor-actuator elements demonstrating large possibilities for applications in high technol-ogy smart systems1. For any application, the selected SMA must be previously characterized concerning mainly its transformation temperatures and strain variation. Under stress free condition, this characterization is generally performed using differential scanning calorimetry (DSC) analysis and electrical resistivity (ER) measure-ments. In theses cases, only transformation temperatures and other physical parameters, like enthalpy and absolute electrical resistance, can be determined. For tests involving heating-cooling cycles under external load, commercial thermomecanical analyzers (TMA)2-4 and adaptation of the ER technique5,6 have been used to determine both transformation temperatures and strains. In all cases, heating of the sample is carried out by an electrical furnace, as in commercial DSC and TMA apparatus, or by circulation oil baths as in some ER test benches, and temperature is a parameter directly measured and controlled. However, the heating and cooling of SMA by direct passage of electrical current through the wire sample accompanied of electrical resistance and strain measurements, is a challenge that was not yet fully explored. In this case, when the SMA wire sample is very thin, direct measurement of SMA temperature becomes dif-ficult. In this work, an experimental set-up was specially designed to perform electro-thermal cycles under constant load in thin SMA wires measuring simultaneously its absolute electrical resistance and strain. The apparatus was employed to determine the strain-temperature
(ε- T) and electrical resistance-temperature (R - T) hysteresis loops of an equiatomic SMA Ti-Ni wire having 150 µm in diameter being uniaxially loaded in the range of 140 to 225 MPa.
2. Experimental Procedure
2.1. Description of the test apparatus
wire. The multimeters illustrated in Figure 1 measure voltage and electrical current through the SMA wire and LVDT voltage signal. Data acquisition is carried out using an IBM PC 486DX4 – S100 computer having a GPIB card.
The voltage/current converter illustrated in Figure 1 is com-posed of an operational amplifier (TL084), a transistor (BD136), a resistor (Ri = 8.9 Ω) and a reference resistor (RREF = 1 kΩ), as schematized in Figure 2. This voltage/current converter transform an input voltage Vi (t) in electrical current i(t) passing through the SMA wire for electrical heating. For a positive input voltage Vi (t), the output voltage VO (t) in the operational amplifier is negative so that the transistor T1 allow the passage of electrical current through the SMA.
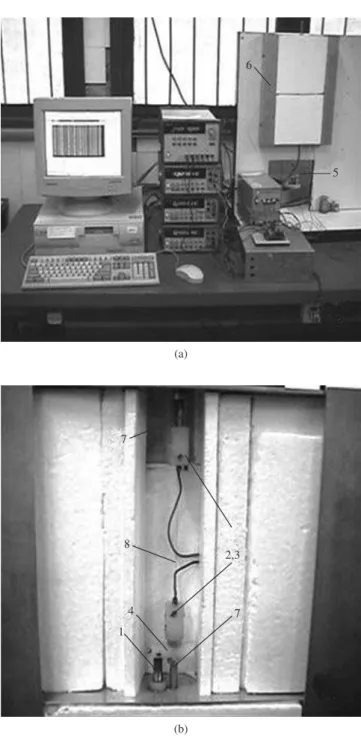
Figure 3 shows a picture of the experimental test bench described in Figure 1.
2.2. Studied SMA wire
The equiatomic Ti-Ni SMA wire with 150 µm in diameter, used in this study, was supplied by Mondo-Tronics Inc.7. The samples have 90 mm in length and martensitic transformation temperatures, according to supplier, are Mf = 42 °C, Ms = 52 °C, As = 68 °C and Af = 78 °C.
2.3. The electrical current - temperature model
The experimental set-up illustrated in Figure 1 allows to meas-ure at the same time the strain (ε) and electrical resistance (R) of the SMA wire as a function of electrical current i(t). However, the characterization of these materials is undertaken regarding trans-formation temperatures, and not electrical current. Some authors8, even using electrical heating by Joule effect, have mentioned the installation of a thermocouple on the surface of the SMA wire aiming a direct measurement of the temperature change during passage of electrical current. However, considering the extremely reduced diameter of the SMA wire used in this study, installation of thermocouples directly on its surface was not possible. The use of
Power supply HP-GPIB Multimeter HP-GPIB
Multimeter HP-GPIB
GPIB
888888
888888
888888
888888
+ 6 - 25 + 25
Vi (t)
i (t)
Voltage/Current Converter
1
6
7
2, 3 4
5 8 Voltage SMA
wire
Current SMA wire
Voltage LVDT
Figure 1. Mechanical structure of the testing bench and data acquisition
system: 1) LVDT displacement sensor; 2, 3) mechanical grips; 4) guiding LVDT; 5) load (weight); 6) frame; 7) guiding rod; and 8) SMA wire.
-+ Vi (t)
Ri
T1 i (t)
RREF
- Vcc SMA wire
Figure 2. Electrical scheme of the voltage/current convert used to heat the
SMA wire.
6
5
(a)
7 2,3 8
4
1 7
(b)
Figure 3. Picture of the test apparatus, a) Entire view; and b) Zoom view of
an infrared sensor based on pyroelectric detector was also rejected by the same reasons.
In the absence of an accurate and reliable technique for direct measurement of the SMA wire temperature it was estimated from the heat-transfer thermal equilibrium equation given by
(1)
where V, A and R are the volume, the surface area and the electrical resistance of the SMA wire, respectively. The specific mass ρ and the specific heat Cp are intrinsic properties of the material and h is the convective heat transfer coefficient between the wire and its sur-roundings at temperature T∞.
Although frequently assumed, some physical parameters in Equa-tion 1 are not constant during temperature variaEqua-tions, mostly in the transformation region. The volume change during transformation is negligible (of the order of 0.16%), however meaningful changes can be verified in Cp and R.
In this study, the parameters R and ε are measured for the heated SMA wire in steady-state condition. From Equation 1, the steady-state value of the wire temperature, for a step current i when dT/dt = 0 is
(2)
Application of Equation 2 involves necessarily the estimation of the convective heat transfer coefficient between the wire and its surroundings (h). This estimation process was done by means of two experiments. The first one was carried out using an electrical furnace where the SMA wire was thermal cycled between 25 °C and 90 °C for measurement of its electrical resistance as a function of temperature (R - T). The second experiment was performed using the experimental set-up described in Figure 1 with no external loads on the SMA wire. During these tests, the electrical resistance vs. current (R - i) was determined.
Then, using Equation 1 and considering that current and electrical resistance for the second experiment were measured in the steady-state condition, it is possible to use Equation 2 and the following identification problem can be established
Rnin2 = hA(T
n – T∞); n = 1,..., N (3) where N is the number of points. With the Rn, in and Tn obtained from the two described experiments, an identification problem to determine the convective heat transfer coefficient between the wire and its surround-ings (h) can be calculated. Using the identification method proposed by Ljung9, which involves a group of candidate models and a general rule to evaluate the models from the data, identification of h and T∞ becomes easy and the problem is solved according to equation:
y(x) = aT (x) – b (4)
where a= hA, b= hAT∞ and y(x) = Rnin2.
By applying the least squares method for the Equation 4, the fol-lowing values were identified: h = 88.2 W/m2.°C and T
∞ = 25.1 °C.
With these values, electrical current can be directly converted to temperature of the SMA wire using Equation 2.
3. Results and Discussions
3.1. Thermal cycling of the SMA wire
Figures 4 and 5 show, respectively, the electrical current waveform used to perform the heating-cooling cycles of SMA wire samples and the corresponding estimated temperatures from Equation 2. The heat-ing – coolheat-ing current rate was 4.78 mA/min. Absolute temperatures can be obtained adding the T∞ value to data from Figure 5.
3.2. Electro-thermomechanical characterization
of the SMA wire
3.2.1. Characterization of the
ε
- T hysteresis
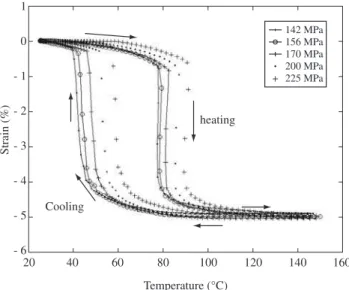
Figure 6 shows the strain vs. temperature hysteresis loops for applied loads in the range of 142 MPa (255 g) to 225 MPa (405 g). For all applied loads, contraction of the SMA wire was practically constant between 4,5% and 5%, indicating that between 142 and 225 MPa a complete orientation of martensite variants occurs. Be-sides, it is clearly observed from Figure 6 a displacement of ε - T hysteresis loops towards the higher temperatures with increasing the applied load. This behavior is typical of the SMA’s and corresponds to an increase of transformation temperatures as a function of the me-chanical loading, being described by a modified Clausius-Clayperon type law10. The ε - T hysteresis loops shown in Figure 6 were recently simulated by Nascimento11 using a new model adapted from the limit-ing loop proximity hysteresis model developed by Almeida et al12.
Electrical current (A)
Time (s) 0.35
0.3
0.25
0.2
0.15
0.1
0.05
0
0 1000 2000 3000 4000 5000 6000 7000 8000 9000 10000
Figure 4. Electrical current waveform used to perform thermal cycles in the
SMA wire samples.
T
emperature (°C)
160
140
120
100
80
60
40
20
0 1000 2000 3000 4000 5000 6000 7000 8000 9000 10000
Time (s)
The martensitic transformation temperatures plotted in Figure 7 were directly measured from Figure 6 using the tangent method13. The C
A and CM slopes define the linear relationship respectively between the austenitic (As and Af) and martensitic (Ms and Mf) transforma-tion temperatures and applied stress. These slopes were CA = 6.8 and CM = 4.3 MPa/°C, and they are in accord with the large range presented in the literature (between 3 and 20 MPa/°C)10.
Figure 6 also indicates a reduction of the hysteresis width as a function of the applied stress, as confirmed in Figure 8. This hysteresis width drops of about 10 C in the range of 80 MPa to 225 MPa. These results are compatible with the ones presented by De Araujo et al.13 for a Ti-Ni-Cu SMA wire.
3.2.2. Characterization of the R - T hysteresis
For each current value composing the waveform shown in Fig-ure 4, it was measFig-ured, beyond the contraction of the SMA wire, its absolute electrical resistance. Thus, the hysteretic resistance vs.
temperature behavior was determined as shown in Figure 9 for the same stress range of Figure 6.
Figure 6.ε - T hysteresis loops for some applied loads on the SMA wire.
Mf Ms
CM CA
As Af
240
220
200
180
160
140
120
100
80
20 30 40 50 60 70 80 90 100
Applied stress (MP
a)
Temperature (°C)
Figure 7. Transformation temperatures as a function of applied load on the
SMA wire.
42
40
38
36
34
32
30
Hysteresis width (°C)
80 100 120 140 160 180 200 220 240
Stress (MPa)
Figure 8. Hysteresis width as a function of applied load on the SMA wire.
From Figure 9, it is observed that, for all stresses in the studied range, the electrical resistance reaches maximum values between 2 to 3% higher than the ones measured at 25 °C. In addition, for all applied loads, the electrical resistance decreases of about 17 to 18% in the transformation region comparing with maximum resistance.
By combining results of Figures 6 and 9, the ε - R behavior can be obtained as shown in Figure 10 for an applied load correspond-ing to 200 MPa. Figure 10 confirm that it is not possible to obtain a linear relationship without hysteresis between ε and R for the studied SMA wire, contrarily to the results verified by De Araújo et al.13 for Ti-Ni-Cu SMA wires.
This absence of linearity without hysteresis in the ε − R charac-teristic curve occurs because the ε - T and R - T loops do not have exactly the same form, as can be verified comparing Figures 6 and 9. Considering the R - T characteristic curve in Figure 9 during cooling, it can be observed that transformation occurs slowly between 5 and 5.5 Ω, while transformation in the ε - T behavior develop rapidly in a narrow temperature range. This irregularity in the R - T loops can indicate the presence of an intermediary austenite to R-phase
Figure 9. R - T hysteresis loops for some applied loads on the SMA wire.
1
0
- 1
- 2
- 3
- 4
- 5
- 6
Strain (%)
Cooling
20 40 60 80 100 120 140 160
heating
Temperature (°C)
142 MPa 156 MPa 170 MPa 200 MPa + 225 MPa
6.5
6
5.5
5
Electrical resistance (
7
)
20 40 60 80 100 120 140 160
Temperature (°C)
142 MPa 156 MPa 170 MPa 200 MPa + 225 MPa
Cooling
transformation, susceptible to appear in the Ti-Ni binary SMA and responsible by the absence of linearity in the ε - R behavior6.
4. Conclusions
In this work the electro-thermomechanical characterization of a Ti-Ni SMA wire with 150 µm in diameter was carried out using an experimental test bench specially designed to perform direct electrical heating and cooling of the sample by Joule effect. This apparatus has allowed simultaneous measurements of displacement and electrical resistance as a function of the estimated temperature of samples loaded by constant weights.
For uniaxial applied tensile stresses between 142 and 225 MPa, contraction and elongation by shape memory effect under load was practically constant, of the order of 5% in relation to its initial length.
By raising applied stress, a linear increase of austenitic and mar-tensitic transformation temperatures were also verified with slopes of 6.8 and 4.3 MPa/°C, respectively. In opposition, thermal hysteresis drops about 10 °C for the same applied stress range.
Combining ε - T and R - T loops lead to obtaining the ε - R characteristic of the SMA wire. However, due to an anomaly in the R - T loop during cooling, this ε - R behavior was not linear without hysteresis, as it can be eventually expected.
Acknowledgments
Research supported by the Brazilian agencies: Conselho Nacional de Desenvolvimento Científico e Tecnológico (CNPq), Fundo Seto-rial de Energia (CT-Energ, CNPq grant number: 400724/2003-0) and Coordenação de Aperfeiçoamento de Pessoal de Nível Superior (CAPES).
References
1. Srinivasan AV, McFarland DM. Smart Structures: Analysis and Design. Cambridge, UK: Cambridge University Press; 2001.
2. Zheng Y, Schrooten J, Cui L, Van Humbeeck J. Constrained thermoelastic martensitic transformation studied by modulated DSC. Acta Materialia.
2003; 51(18):5467-5475.
3. Xu Y, Otsuka K, Toyama N, Yoshida H, Nagai H, Kishi T. Additive nature of recovery strains in heavily cold-worked shape memory alloys. Scripta Materialia. 2003; 48(6):803-808.
4. Liu Y. Mechanical and thermomechanical properties of a Ti50Ni25Cu25
melt spun ribbon. Materials Science and Engineering A. 2003; A354:286-291.
5. De Araújo CJ. Comportement cyclique de fils en alliage à mémoire de forme Ti-Ni-Cu: analyse electro-thermomécanique, dégradation et fatigue par cyclage thermique sous contrainte. [Thèse de Doctorat]. Villeurbanne: INSA-Lyon; 1999.
6. De Araújo CJ, Lopez-Cuellar E, Morin M, Guénin G. Sobre a pos-sibilidade de controlar atuadores à memória de forma via medidas de variação de resistência elétrica: uma análise experimental. Anais do V Congreso Iberoamericano de Ingenieria Mecânica (CIDIM); 2001 Mérida, Venezuela. 2001. p. 345-350.
7. Gilbertson RB. Muscle Wires Projet Book. San Rafael, CA (USA): Mondo-Tronics Inc.; 2000.
8. Brailovski V, Trochu F, Daigneault G. Temporal characteristics of shape memory linear actuators and their application to circuit breakers. Materi-als & Design. 1996; 17(3):151-158.
9. Ljung L. System Identification: Theory for the User. Linkoping University, Sweden: Prentice Hall; 1999.
10. Otsuka K, Wayman CM. Shape Memory Materials. Cambridge, UK: Cambridge University Press; 1998.
11. Nascimento MMSF. Contribuição ao estudo da histerese em ligas com memória de forma. [Dissertação de Mestrado]. Campina Grande, PB: Universidade Federal de Campina Grande; 2003.
12. Almeida LAL, Deep GS, Lima AMN, Neff H. The limiting loop prox-imity (L2P) hysteresis model. IEEE Transaction on Magnetics. 2002;
39(1):523-528.
13. De Araújo CJ, Gonzalez CH, Morin M, Guénin G. Influence of the me-chanical loading history on the stress assisted two way memory effect in a Ti-Ni-Cu alloy. Materials Research. 2001; 4(3):181-188.
Figure 10.ε - R behavior for SMA wire loaded under 200 MPa.
Electrical resistance (7) 0
- 1
- 2
- 3
- 4
- 5
Strain (%)
5 5.5 6 6.5
heating