Robert Antonio RamiarinaI,II
Beatriz Luiza RamiarinaIII
Renan Moritz V R AlmeidaII
Wagner Coelho de Albuquerque PereiraII
I Ministério da Saúde. Rio de Janeiro, RJ,
Brasil
II Programa de Engenharia Biomédica. Coppe/
Universidade Federal do Rio de Janeiro. Rio de Janeiro, RJ, Brasil
III Faculdade de Medicina. Universidade
Federal Fluminense. Rio de Janeiro, RJ, Brasil
Correspondence: Renan M V R Almeida
Programa de Engenharia Biomédica Coppe Universidade Federal do Rio de Janeiro Caixa Postal 68510 Cidade Universitária 21941-972 Rio de Janeiro, RJ, Brasil E-mail: [email protected] Received: 8/9/2007 Reviewed: 2/14/2008 Approved: 3/19/2008
Comorbidity adjustment
index for the International
Classifi cation of Diseases, 10
th
revision
Índice de ajuste de comorbidade
para a 10ª revisão da Classifi cação
Internacional de Doenças
ABSTRACT
OBJECTIVE: To develop a Charlson-like comorbidity index based on clinical conditions and weights of the original Charlson comorbidity index.
METHODS: Clinical conditions and weights were adapted from the International Classifi cation of Diseases, 10th revision and applied to a single hospital admission diagnosis. The study included 3,733 patients over 18 years of age who were admitted to a public general hospital in the city of Rio de Janeiro, southeast Brazil, between Jan 2001 and Jan 2003. The index distribution was analyzed by gender, type of admission, blood transfusion, intensive care unit admission, age and length of hospital stay. Two logistic regression models were developed to predict in-hospital mortality including: a) the aforementioned variables and the risk-adjustment index (full model); and b) the risk-adjustment index and patient’s age (reduced model).
RESULTS: Of all patients analyzed, 22.3% had risk scores ≥1, and their mortality rate was 4.5% (66.0% of them had scores ≥1). Except for gender and type of admission, all variables were retained in the logistic regression. The models including the developed risk index had an area under the receiver operating characteristic curve of 0.86 (full model), and 0.76 (reduced model). Each unit increase in the risk score was associated with nearly 50% increase in the odds of in-hospital death.
CONCLUSIONS: The risk index developed was able to effectively discriminate the odds of in-hospital death which can be useful when limited information is available from hospital databases.
Hospital administrative databases are frequently used for estimating clinical or epidemiological empirical models and these models should consider, as much as possible, the inclusion of variables controlling for pa-tients’ health status. These variables, known as risk-ad-justment indexes,21 are also useful for predicting patient
outcome (e.g., mortality) in a variety of settings.4
One of these indexes is the Charlson Comorbidity In-dex,3 which essentially classifi es patients by weighting
the severity of their clinical conditions. The Charlson index was originally proposed for longitudinal mortality studies, but there is evidence of its validity in a large number of clinical situations.7,8 Although the most
re-cent (10th) revision of the International Classifi cation
of Diseases (ICD) has been available for more than ten years,a applications of the Charlson index are frequently
based on standardized coding of co-morbidities ac-cording to the ICD, 9th revision (ICD-9).13 In addition,
the number of conditions to be weighed for a sensitive
RESUMO
OBJETIVO: Desenvolver um índice de co-morbidade a partir das condições clínicas e dos pesos do índice de co-morbidade de Charlson.
MÉTODOS: As condições clínicas e pesos do índice de Charlson foram adaptados segundo a Classifi cação Internacional de Doenças – 10a Revisão, e
aplicados ao diagnóstico principal de internação hospitalar. Foram estudados 3.733 pacientes acima de 18 anos hospitalizados em hospital geral público do município do Rio de Janeiro, RJ, 2001-2003. A distribuição do índice foi de acordo com o gênero, tipo da admissão, presença de transfusão de sangue, admissão à unidade de terapia intensiva, idade e tempo de internação. Dois modelos de regressão logística foram desenvolvidos com o objetivo de prever a mortalidade hospitalar desses pacientes: a) com as variáveis acima e o índice de co-morbidade (modelo completo); e b) contendo apenas o índice e a idade dos pacientes (modelo reduzido).
RESULTADOS: Dentre o total de pacientes analisados, 22,3% possuíam escores ≥1 para o índice e sua taxa de mortalidade foi 4,5% (66,0% dos quais com escores ≥1). Exceto gênero e do tipo de admissão, todas as variáveis foram retidas na regressão. Os modelos tiveram uma área sob a curva característica ROC igual a 0,86 (modelo completo) e 0,76 (modelo reduzido). Cada aumento de uma unidade nos escores do índice foi associado com um aumento de quase 50% na probabilidade de mortalidade hospitalar.
CONCLUSÕES: O índice desenvolvido pôde discriminar probabilidades de mortalidade com uma efi cácia aceitável, o que pode ser útil ao lidar-se com bancos de dados hospitalares com informação limitada.
DESCRITORES: Comorbidade. Classifi cação Internacional de Doenças. Mortalidade Hospitalar. Registros Médicos. Modelos Estatísticos. Tábuas de Vida. Modelos Epidemiológicos. Modelos Matemáticos.
INTRODUCTION
a World Health Organization. International Statistical Classifi cation of Diseases and Related Health Problems – 10th Revision. [cited 2007 Jan
11]. Available from: http://www.who.int/classifi cations/icd/en/,
index is not clear, and, in some countries, detailed and reliable records of patient co-morbidities are not even available from administrative hospital databases.
The objective of the present study was to assess an adapted version of the Charlson index updated for the ICD-10 coding scheme.
METHODS
Data were obtained from an information system devel-oped by the Brazilian Ministry of Health for administra-tive/reimbursement purposes (Sistema de Informações
Ambulatoriais do Sistema Único de Saúde – National Health System Information System Database, SIA-SUS). Besides patient data such as age and home address, this system includes information concerning patients’ admissions in public hospitals, and their main admission diagnosis.2 All patients over 18 years of age
admitted in the hospitals during the period between January 2001 and January 2003 were included in the analysis (N=3,733).
For the computation of the original Charlson index, weights (0, 1, 2, 3 and 6) had to be applied to the pa-tients’ selected clinical conditions. These weights were defi ned according to the relative mortality risks of the conditions studied, and were estimated from a cohort admitted to two hospitals in the United States.3 The
clinical conditions of the Charlson index were adapted from the ICD-10 codes.23 This adaptation was based on
the list of clinical conditions and their descriptions,3
which were translated into the ICD-10 with the help of existing Charlson index based on ICD-9 mappings and standard medical references.1,5,6,11,17 The codes and
their respective weights were applied to the patient’s main admission diagnosis, yielding a Charlson index-like risk adjustment index that consisted of a clinical condition and its weight.
The index distribution among patients admitted to the hospital was analyzed (for each one of the departments previously mentioned) by gender, type of admission, blood transfusion, intensive care unit admission, age and length of hospital stay. These variables, together with the developed risk index, were then included in two logistic models to predict in-hospital mortality for the patients studied. For the fi rst (full) model, all aforementioned independent variables were included in the regression, and the non-statistically signifi cant ones were excluded, yielding a fi nal model with all p-values below 0.05. In this fi nal model, variable interactions were tested in the usual manner.10 For the second model
(the reduced one), only patient’s age and the risk-adjust-ment index were included as predictors. In addition, both basic models were replicated with an existing alternative ICD-10 Charlson index mapping.22
Gender, type of admission, blood transfusion and intensive care unit admissionwere defi ned as binary (male/female or yes/no),age was measured in years and length of hospital stay in days. Model goodness-of-fi t was assessed using the omnibus test for model coeffi cients and the c (area under the receiver operating characteristic (ROC) curve) statistic.10 The R Software
was used for data manipulation and analysis.a
RESULTS
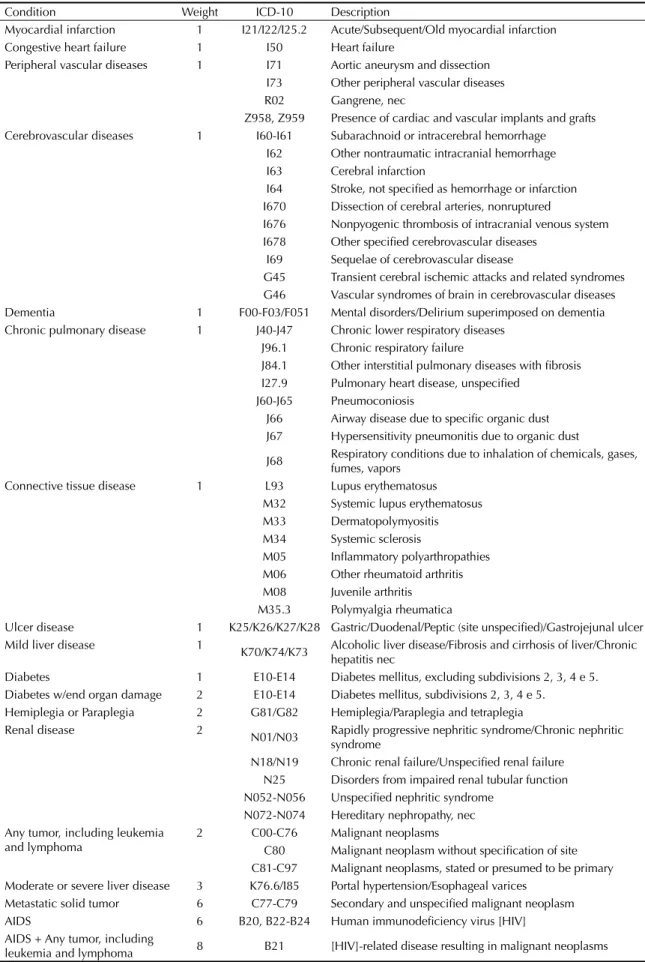
Table 1 shows a summary of the clinical conditions studied and their coding according to the ICD-10 mapping developed. In the period studied, 22.3% of the patients had their risk-adjustment index equal or above 1. Their mortality rate was 4.5% (168 cases), and 66% of them had risk-adjustment index scores equal or above 1. In 29.2% of the deaths, the main diagnosis was malignant neoplasm (score 2); 19.0% were primarily diagnosed with congestive heart failure and acute myocardial infarction (score 1); 9.5% with HIV-related disease (score 6) and 5.4% with chronic respiratory diseases (score 1).
Table 2 shows the index scores distribution according to hospital departments and selected variables (values not presented for cells with less than fi ve patients). In general, higher scores were associated with urgent admissions, blood transfusions and intensive care unit admission. Similarly, score increase was associated with an increase in the variables age and length of hospital stay. Notably, in the internal medicine depart-ment, score increases (scores above 2) were associated with decreasing age.
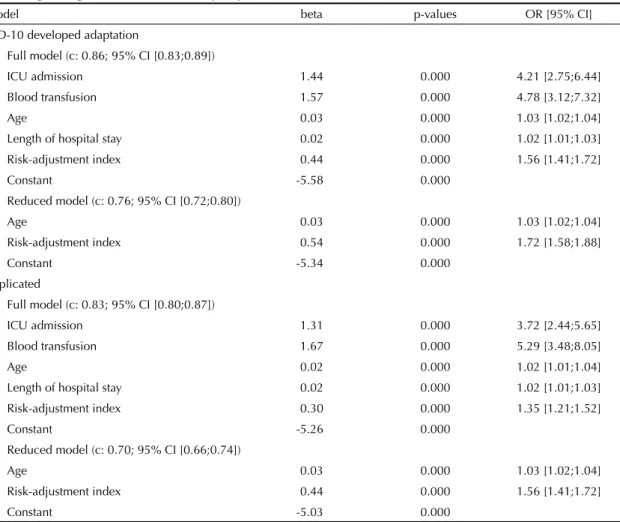
For all models, the omnibus test of model coeffi cients had a p-value below 0.001. Except for gender and type of admission, all independent variables could be retained in the full logistic model (Table 3). In this model, the c parameter was 0.86 (95% CI: 0.83;0.89), intensive care unit admission and blood transfusion were the strongest odds predictors and each unit in-crease in the risk-adjustment score was associated with nearly 50% increase in the odds of in-hospital death. In the reduced model, both predictors (age and risk-adjustment index) were statistically signifi cant, and the c statistic decreased to 0.76 (95% CI: 0.72;0.80). The replicated models with the alternative ICD-10 coding had a somewhat poorer performance, with c parameters of 0.83 and 0.70, respectively.
DISCUSSION
Table 2 shows that, in general, score increases were associated to increased odds of urgent admission, blood transfusion, intensive care unit admission and death, and increased average age and length of hospital stay. The exception to thatwas the internal medicine depart-ment where care was provided to AIDS patients, who accounted for 95% of all cases with risk score ≥3. This bias can explain the inconsistency between age and risk score found in this department since it is well-known that HIV-related diseases usually occur at relatively younger ages.
a Vienna University of Economics and Business Administration. The R Project for Statistical Computing. [cited 2007 Jan 11]. Available from:
Table 1. Clinical conditions, CCI-adapted ICD, 10th Revision. Rio de Janeiro, Southeastern Brazil, 2001–2003.
Condition Weight ICD-10 Description
Myocardial infarction 1 I21/I22/I25.2 Acute/Subsequent/Old myocardial infarction Congestive heart failure 1 I50 Heart failure
Peripheral vascular diseases 1 I71 Aortic aneurysm and dissection I73 Other peripheral vascular diseases R02 Gangrene, nec
Z958, Z959 Presence of cardiac and vascular implants and grafts Cerebrovascular diseases 1 I60-I61 Subarachnoid or intracerebral hemorrhage
I62 Other nontraumatic intracranial hemorrhage I63 Cerebral infarction
I64 Stroke, not specifi ed as hemorrhage or infarction I670 Dissection of cerebral arteries, nonruptured
I676 Nonpyogenic thrombosis of intracranial venous system I678 Other specifi ed cerebrovascular diseases
I69 Sequelae of cerebrovascular disease
G45 Transient cerebral ischemic attacks and related syndromes G46 Vascular syndromes of brain in cerebrovascular diseases Dementia 1 F00-F03/F051 Mental disorders/Delirium superimposed on dementia Chronic pulmonary disease 1 J40-J47 Chronic lower respiratory diseases
J96.1 Chronic respiratory failure
J84.1 Other interstitial pulmonary diseases with fi brosis I27.9 Pulmonary heart disease, unspecifi ed
J60-J65 Pneumoconiosis
J66 Airway disease due to specifi c organic dust J67 Hypersensitivity pneumonitis due to organic dust
J68 Respiratory conditions due to inhalation of chemicals, gases, fumes, vapors
Connective tissue disease 1 L93 Lupus erythematosus M32 Systemic lupus erythematosus M33 Dermatopolymyositis M34 Systemic sclerosis
M05 Infl ammatory polyarthropathies M06 Other rheumatoid arthritis M08 Juvenile arthritis
M35.3 Polymyalgia rheumatica
Ulcer disease 1 K25/K26/K27/K28 Gastric/Duodenal/Peptic (site unspecifi ed)/Gastrojejunal ulcer Mild liver disease 1
K70/K74/K73 Alcoholic liver disease/Fibrosis and cirrhosis of liver/Chronic hepatitis nec
Diabetes 1 E10-E14 Diabetes mellitus, excluding subdivisions 2, 3, 4 e 5. Diabetes w/end organ damage 2 E10-E14 Diabetes mellitus, subdivisions 2, 3, 4 e 5.
Hemiplegia or Paraplegia 2 G81/G82 Hemiplegia/Paraplegia and tetraplegia
Renal disease 2
N01/N03 Rapidly progressive nephritic syndrome/Chronic nephritic syndrome
N18/N19 Chronic renal failure/Unspecifi ed renal failure N25 Disorders from impaired renal tubular function N052-N056 Unspecifi ed nephritic syndrome
N072-N074 Hereditary nephropathy, nec Any tumor, including leukemia
and lymphoma
2 C00-C76 Malignant neoplasms
C80 Malignant neoplasm without specifi cation of site C81-C97 Malignant neoplasms, stated or presumed to be primary Moderate or severe liver disease 3 K76.6/I85 Portal hypertension/Esophageal varices
Metastatic solid tumor 6 C77-C79 Secondary and unspecifi ed malignant neoplasm AIDS 6 B20, B22-B24 Human immunodefi ciency virus [HIV]
AIDS + Any tumor, including
Two sets of models were developed for validating the newly developed index. Besides a model including clas-sical predictors of in-hospital mortality, readily avail-able from administrative databases, a “reduced” model was developed allowing better comparability of similar studies that sought to predict in-hospital mortality. This reduced model included patient’s age, since a variation of the Charlson index consists in adding the value “1” for every 10 years of life beyond the age of 50.
The widely used area under the ROC curve and its derived c parameter were applied to assess model performance. In logistic regression (binary classifi er), the ROC curve is a plot of false-positive rates (x axis) versus true-positive rates (y axis) for many prediction thresholds of the model. The c statistic, in turn, is simply the area under the curve obtained, so that when c=1 indicates a perfect classifi er (100% true-positive and 0% false-positive rates).10 In the present analysis, however,
the discriminatory power was lost when a single patient diagnosis was used. Thus, the c parameter was 0.86 for the full model, decreasing to 0.76 when only age and risk index were included as mortality predictors. A classifi er is usually deemed acceptable with c is above 0.70 and excellent when c is above 0.80.10
Administrative data are relatively easily available for large numbers of patients and thus have been frequently used in clinical and epidemiological studies. In this sense, having available an index for the evaluation and control of patient’s condition severity is a key approach, and the Charlson index is one of the most studied in-dexes.13,14,19,20 Its correlation with costs or odds of death
has been investigated in both in-hospital and follow-up settings. An extensive literature review of 13 comorbid-ity classifi cation indexes concluded the Charlson index was one of the four “(…) valid and reliable methods to measure comorbidity that can be used in clinical re-search”.4 A recent review of studies on Charlson index
applications can be found in Needham et al 2005.13
However, most applications of this index have been described in countries with well-established patient recording systems, and in some cases these admin-istrative databases may contain up to 40 patient ICD codes.a But there is little research on the sensitivity of
risk-adjustment indexes to the number of comorbidities used in their construction. In addition, it is well-known the quality of comorbidity recording varies widely even in countries with well-established hospital data collection,12 and, therefore, the extent to which these
factors actually affect the discriminatory power of the index is not clear. In the present study, the database also included a secondary admission diagnosis but this
(non-mandatory) record is usually considered unreli-able, and this information was missing in about 90% of the patients.
As for the translation of clinical conditions into stan-dardized codes, one of the fi rst attempts to convert the clinical conditions described by Charlson3 into ICD
codes (9th revision) was made in 1992 with Medicare
claims data (Deyo et al adaptation).5,6 Another adaptation
was made by the Dartmouth-Manitoba group, resulting in an ICD-9 coding scheme that the authors considered as“slightly”17 different from the former, and the main
differences were due to a less rigid interpretation of the Charlson index basic clinical conditions.5,6,17,18 Another
option is the mapping developed by D’Hoore et al,7,8
which main difference from the previous translations3,5,6
was the use of three-digit ICD codes. In the present study, the Charlson index was adapted from the ICD-10 disease classifi cation scheme. The ICD-9 has 6,969 diagnosis codes while the ICD-10 has 12,420 (14,199 when including Chapter XX – External causes of death). The most important changes in the ICD-10 classifi cation are the use of alphanumeric codes, the inclusion of B20-B24 HIV-related codes and more detailed description of some conditions, e.g. myocardial infarction codes (six codes versus one in the ICD-9).
In the newly developed coding scheme for the ICD-10 Charlson index representation (Table 1), it should be noted that: 1) two-digit codes in this table include all corresponding coding subdivisions; 2) HIV-related malignant neoplasm (ICD-10 B21) was assigned the weight “8” as it includes a condition with weight “2” (malignant neoplasm) and another one with weight “6”; 3) the weight “2” was assigned to both diabetes with end-organ damage – retinopathy, neuropathy, or nephropathy – and diabetes mellitus with peripheral circulatory complications (E10-14 subdivisions 2, 3, 4 and 5); and the weight “1” was assigned to the remain-ing E10-14 codes); 4) followremain-ing the originally proposed Charlson index, i) the ICD-10 code Z-95 presence of cardiac and vascular implants and grafts includes patients who had bypass for arterial insuffi ciency, ii) any tumor, including leukemia and lymphoma includes patients with metastatic solid tumors (breast, lung, colon, and other tumors), iii) rheumatologic diseases includes L93 (lupus erythematosus) and M08 (juvenile arthritis), iv) pulmonary disease includes patients with or without treatment who are dyspneic with or without attacks, represented by the codes J96.1 (chronic respira-tory failure), J84.1 (other interstitial pulmonary diseases with fi brosis), I27.9 (pulmonary heart disease, unspeci-fi ed) and J68 (respiratory conditions due to inhalation of chemicals, gases, fumes, vapors) and v) cerebrovascular disease does not include the codes I671, I672, I674,
a Department of Human Services, Victorian Government. The Victorian Admitted Episodes Dataset, 17th Edition Users Manual. March 18
595
Cardiology 0 316 (49.0) 177 (56.0) 147 (46.5) 7 (2.2) 42 (13.3) 14 (4.4) 64 9 (n = 540) 1 224 (51.0) 84 (37.5) 138 (61.6) 10 (4.5) 65 (29.0) 20 (8.9) 63 15
2 - - -
-≥3 - - -
-Internal medicine 0 293( 44.7) 167 (57.0) 166 (56.7) 48 (16.4) 24 (8.2) 39 (13.3) 52 14
(n = 655) 1 122 (18.6) 70 (57.3) 67 (54.9) 8 (6.6) 11 (9.0) 18 (14.7) 55 13
2 162 (24.7) 78 (48. 1) 70 (43.2) 38 (23.5) 2 (1.2) 44 (27.2) 60 18
≥3 78 (11.9) 26 (33.3) 35 (44.9) 15 (19.2) 8 (10.3) 18 (23.1) 42 23
Neurology 0 72 (62.6) 37 ( 51.4) 40 (55.6) 2 (2.8) 4 (5.6) 1 (1.4) 43 11
(n = 115 ) 1 43 (37.4) 24 (55.8) 26 (60.5) 1 (2.3) 6 (13.9) 3 (7.0) 62 17
2 - - -
-≥3 - - -
-General surgery 0 776 (93.4) 381 (49.1) 371 (47.8) 13 (1.7) 10 (1.3) 3 (0.4) 50 5
(n = 816 ) 1 - - -
-2 40 (4.8) 25 (62.5) - 8 (20.0) 2 (5.0) 4 (10.0) 56 16
≥3 - - -
-Gynecology 0 265 (80.5) 265 (100) 151 (57.0) 7 (2.6) 1 (0.4) - 49 6
(n = 329 ) 1 - - -
-2 64 (19.5) 64 (100) - 1 (1.6) - 1 (1.6) 51 13
≥3 - - -
-Thoracic surgery 0 68 (79.1) 55 (80.9) 45 (66.2) 2 (2.9) 10 (14.7) - 46 6
(n = 84 ) 1 - - -
-2 16 (18.6) 16 (100) - - - - 60 9
≥3 - - -
-Orthopedics 0 329 (94.8) 161 (48.9) 150 (45.6) 11 (3.3) 1 (0.3) 1 (0.3) 45 5
(n = 346 ) 1 - - -
-2 17 (4.9) 7 (41.5) 15 (88.2) 2 (11.8) 2 (11.8) 2 (11.8) 56 23
≥3 - - - - -
-Urology 0 174 (89.2) 36 (20.7) 88 (50.6) 11 (6.3) 3 (1.7) - 59 11
(n = 195 ) 1 - - -
-2 21 (10.8) 1 (4.7) 14 (66.7) 5 (23.8) 1 (4.8) - 67 22
≥3 - - -
I675, I677 and I679 since only patients with history of cerebrovascular accident with minor or no residua and transient ischemic attacks are included; 5) following Deyo et al adaptation, Alzheimer disease (G30) is not included in the dementia category.
Values found for the c parameter in the logistic models developed are not different from the results of studies with similar applications of the Charlson index or its variations. For example, reported c values for Charlson index performance in the prediction of in-hospital mor-tality include either the low 0.64;0.70,9,15 the acceptable
0.74; 0.769 and the very high 0.83;0.87.7,8,22
In the present study, models including the risk index developed had a better performance than those with an alternative scheme for the Charlson index ICD-10 mapping22 (c= 0.76 vs. 0.70 for the reduced model).
Further studies are required to investigate whether the
identifi ed predictive advantage is specifi c of the pres-ent application (that is, the use of a single admission diagnosis) or it is a more general characteristic of the mapping. The literature has described that only small Charlson index performance differences are detectable between ICD-9 and ICD-10 revisions.16,22
Ideally, co-morbidities indexes of the Charlson index-type should be developed for specifi c populations, since its weight defi nition is basically cohort-driven.9 This is,
however, obviously impractical, and a simple, robust and reliable (albeit not optimal) index is arguably more useful. This is the case of the adaptation proposed in the present study, which was able to effectively discrimi-nate the odds of in-hospital death. The adaptation can be a valid approach in settings where limited informa-tion (single reliable patient diagnosis) is available from hospital administrative databases.
Table 3. Logistic regression models for in-hospital patient death. Rio de Janeiro, Southeastern Brazil, 2001–2003.
Model beta p-values OR [95% CI]
ICD-10 developed adaptation
Full model (c: 0.86; 95% CI [0.83;0.89])
ICU admission 1.44 0.000 4.21 [2.75;6.44]
Blood transfusion 1.57 0.000 4.78 [3.12;7.32]
Age 0.03 0.000 1.03 [1.02;1.04]
Length of hospital stay 0.02 0.000 1.02 [1.01;1.03]
Risk-adjustment index 0.44 0.000 1.56 [1.41;1.72]
Constant -5.58 0.000
Reduced model (c: 0.76; 95% CI [0.72;0.80])
Age 0.03 0.000 1.03 [1.02;1.04]
Risk-adjustment index 0.54 0.000 1.72 [1.58;1.88]
Constant -5.34 0.000
Replicated
Full model (c: 0.83; 95% CI [0.80;0.87])
ICU admission 1.31 0.000 3.72 [2.44;5.65]
Blood transfusion 1.67 0.000 5.29 [3.48;8.05]
Age 0.02 0.000 1.02 [1.01;1.04]
Length of hospital stay 0.02 0.000 1.02 [1.01;1.03]
Risk-adjustment index 0.30 0.000 1.35 [1.21;1.52]
Constant -5.26 0.000
Reduced model (c: 0.70; 95% CI [0.66;0.74])
Age 0.03 0.000 1.03 [1.02;1.04]
Risk-adjustment index 0.44 0.000 1.56 [1.41;1.72]
Constant -5.03 0.000
1. Anderson RN, Miniño AM, Hoyert D, Rosemberg HM. Comparability of cause of death between ICD-9 and ICD-10: preliminary estimates. Natl Vital Stat Rep. 2001;49(2):1-32.
2. Carvalhosa-Mello PC, Almeida RMVR, Pereira WCA. A computerized information system for the analysis of hospital admission fl ow. Int J Medical Inf. 2001;61(1):11-20. doi:10.1016/S1386-5056(00)00129-5
3. Charlson ME, Pompei P, Ales KL, MacKenzie CR. A new method of classifying prognostic comorbidty in longitudinal studies: development and validation. J Chronic Dis. 1987;40(5):373-83. doi:10.1016/0021-9681(87)90171-8
4. Groot BH, Beckerman H, Lankhorst GJ, Bouter LM. How to measure comorbidity: a critical review of available methods. J Clin Epidemiol. 2003; 56(3):221-9. doi:10.1016/S0895-4356(02)00585-1
5. Deyo R, Cherkin D, Ciol MA. Adapting a clinical comorbidity index for use with ICD-9CM administrative databases. J Clin Epidemiol. 1992;45(6):613-9.
doi:10.1016/0895-4356(92)90133-8
6. Deyo RA. Adapting a clinical comorbidity index for use with ICD-9-CM administrative data: a response. J Clin Epidemiol. 1993;46(10):1081-2. doi:10.1016/0895-4356(93)90104-9
7. D’Hoore W, Sicotte C, Tilquim C. Risk adjustment in outcome assessment: the Charlson comorbidity index. Methods Inf Med. 1993;32(5):382-7.
8. D’Hoore W, Bouckaert A, Tilquin C. Practical considerations on the use of the Charlson Comorbidity Index with administrative data bases. J Clin Epidemiol. 1996;49(12):1429-33.
doi:10.1016/S0895-4356(96)00271-5
9. Ghali WA, Hall RE, Rosen AK, Ash AS, Moskowitz MA. Searching for an improved clinical comorbidity index for use with ICD-9-CM administrative data. J Clin Epidemiol. 1996;49(3):273-8. doi:10.1016/0895-4356(95)00564-1
10. Hosmer D, Lemeshow S. Applied logistic regression. 2.ed. New York: Wiley & Sons; 2000.
11. Kasper DL, Braunwald E, Hauser S, Longo D, Jameson JL, Fauci AS. Harrison Principles of Internal Medicine. 16.ed. New York: McGraw Hill; 2004.
12. McKee M, Coles J, James P. ‘Failure to rescue’ as a measure of quality of hospital care: the limitations of secondary diagnosis coding in English hospital data. J Public Health. 1999;21(4):453-8. doi:10.1093/ pubmed/21.4.453
13. Needham DM, Scales DC, Laupacis A, Pronovost PJ. A systematic review of the Charlson comorbidity index using Canadian administrative databases: a perspective on risk adjustment in critical care research. J Crit Care. 2005;20(1):12-9. doi:10.1016/j.jcrc.2004.09.007
14. O´Connell RL, Lim LL. Utility of the Charlson comorbidity index computed from routinely collected hospital discharge diagnosis codes. Methods Inf Med. 2000;39(1):7-11.
15. Poses RM, Smith WR, McClish DK, Anthony M. Controlling for confounding by indication for treatment. Are administrative data equivalent to clinical data? Med Care. 1995;33(4 Supl):AS36-46.
16. Quan H, Sundararajan V, Halfon P, Fong A, Burnand B, Luthi JC, et al. Coding algorithms for defi ning comorbidities in ICD-9-CM and ICD-10 administrative data. Med Care. 2005;43(11):1130-9. doi:10.1097/01. mlr.0000182534.19832.83
17. Romano PS, Roos LL, Jollis JG. Adapting a clinical comorbidity index for use with ICD-9-CM administrative data: differing perspectives. J Clin Epidemiol. 1993;46(10):1075-9. doi:10.1016/0895-4356(93)90103-8
18. Romano PS, Leslie LR, Jollis JG. Further evidence concerning the use of a clinical comorbidity index with ICD-9-CM administrative data. J Clin Epidemiol. 1993;46(10):1085-90. doi:10.1016/0895-4356(93)90106-B
19. Schneeweiss S, Maclure M. Use of comorbidity scores for control of confounding in studies using administrative databases Int J Epidemiol. 2000; 29(5):891-8. doi:10.1093/ije/29.5.891
20. Schneeweiss S, Wang PS, Avorn J, Maclure M, Levin R, Glynn RJ. Consistency of performance ranking of comorbidity adjustment scores in Canadian and U.S. utilization data. J Gen Intern Med. 2004;19(5):444-50. doi:10.1111/j.1525-1497.2004.30109.x
21. Shaughnessy PW, Hittle DF. Overview of risk adjustment and outcome measures for home health agency OBQI reports: Highlights of current approaches and outline of planned Enhancements. Center for Health Services Research, University of Colorado Health Sciences Center; 2002. Available from: http://www.cms.hhs.gov/HomeHealthQualityInits/ Downloads/HHQIRiskAdj.pdf
22. Sundararajan V, Henderson T, Perry C, Muggivan A, Quan H, Ghali WA. New ICD-10 version of the Charlson Comorbidity Index predicted in-hospital mortality. J Clin Epidemiol. 2004;57(1):1288-94. doi:10.1016/j.jclinepi.2004.03.012
23. World Health Organization. International Statistical Classifi cation of Diseases and Health Related Problems ICD-10. Geneva; 2004.