Validation of self-reported diabetes in a
representative sample of São Paulo city
Mariane de Mello FontanelliI, Juliana Araújo TeixeiraI, Cristiane Hermes SalesI, Michelle Alessandra
de CastroI, Chester Luiz Galvão CesarII, Maria Cecilia Goi Porto AlvesIII, Moisés GoldbaumIV,
Dirce Maria MarchioniV, Regina Mara FisbergV
I Programa de Pós-Graduação de Nutrição em Saúde Pública. Universidade de São Paulo. São Paulo, SP, Brasil II Departamento do Epidemiologia. Faculdade de Saúde Pública. Universidade de São Paulo. São Paulo, SP, Brasil III Instituto de Saúde. Secretaria de Estado da Saúde. São Paulo, SP, Brasil
IV Departamento de Medicina Preventiva. Faculdade de Medicina. Universidade de São Paulo. São Paulo, SP, Brasil V Departamento de Nutrição. Faculdade de Saúde Pública. Universidade de São Paulo. São Paulo, SP, Brasil
ABSTRACT
OBJECTIVE: To validate the self-reported diabetes mellitus in adults and older adults living in the city of São Paulo, Brazil.
METHODS: We have used data of 569 subjects (284 adults and 285 older adults), participants of the population-based cross-sectional study Inquérito de Saúde do Município de São Paulo (Health Survey of São Paulo). Fasting glucose ≥ 7.0 mmol/L (126 mg/dL) and/or use of drugs (oral hypoglycemic and/or insulin) deined the diagnosis of diabetes mellitus. We have validated the self-reported diabetes mellitus by calculating the sensitivity, speciicity, positive predictive values, and negative predictive values. We have used Poisson regression with robust variance to verify the factors associated with the sensitivity of the self-reported datum. For all analyses, we have considered the sample design of the study.
RESULTS: he sensitivity of self-reported diabetes mellitus was 63.8% (95%CI 49.2–76.3), speciicity was 99.7% (95%CI 99.1–99.9), positive predictive value was 95.5% (95%CI 84.4–98.8), and negative predictive value was 96.9% (95%CI 94.9–98.2). he correct reporting of diabetes mellitus was more prevalent among older adults (PR = 2.0; 95%CI 1.2–3.5) than among adults. CONCLUSIONS: he use of the datum of self-reported diabetes mellitus is valid, especially among older adults living in the city of São Paulo. he results highlight the need to track diabetes mellitus in asymptomatic subjects who have one or more risk factors for it, mainly in the adult population of this city.
DESCRIPTORS: Diabetes Mellitus, epidemiology. Diagnostic Self Evaluation. Health Surveys. Reproducibility of Results. Validation Studies.
Correspondence: Regina Mara Fisberg
Av. Dr. Arnaldo, 715 Cerqueira Cesar 01246-904 São Paulo, SP, Brasil E-mail: [email protected]
Received: 4 May 2015 Approved: 14 Feb 2016
How to cite: Fontanelli MM, Teixeira JA, Sales CH, Castro MA, Cesar CLG, Alves MCGP, Goldbaum M, Marchioni DM, Fisberg RM. Validation of self-reported diabetes in a representative sample of São Paulo city. Rev Saude Publica. 2017;51:20.
Copyright: This is an open-access article distributed under the terms of the Creative Commons Attribution License, which permits unrestricted use, distribution, and reproduction in any medium, provided that the original author and source are credited.
INTRODUCTION
Diabetes mellitus (DM) is a heterogeneous group of metabolic disorders characterized by hyperglycemia caused by defects in insulin action or insulin secretion1. More than 90.0% of the
cases of DM correspond to type 2 DM, whose prevalence is increasing, especially in developing
countries3. Data from 133 studies of 91 countries suggest that the overall prevalence of DM,
estimated as 6.4% in 2010, will be 7.7% in 2030, reaching 439 million persons and representing a signiicant impact on national health systems18.
Data from 27 Brazilian cities assessed in the Vigilância de fatores de risco e proteção para doenças crônicas por Inquérito Telefônico (VIGITEL – Risk and Protective Factors
Surveillance for Chronic Diseases by Telephone Interviews) showed a prevalence of 6.9% (95%CI 6.5–7.3) for self-reported DMa, with a growth of 0.21 percentage points
per year for the 2006-2013 period when prevalence rates were monitored. Data from the same study suggest the prevalence of 8.2% (95%CI 6.9–9.6) for self-reported DM in the city of São Paulo in 2013a. Even more alarming figures were presented by the Estudo
Longitudinal de Saúde do Adulto (ELSA-Brazil – Brazilian Longitudinal Study of Adult
Health), conducted in six Brazilian cities with 15,102 civil servants aged 35-74 years, whose prevalence of DM was 19.7% (95%CI 19.0–20.3), determined by fasting glucose
test, oral glucose tolerance test, and glycated hemoglobin test19.
In this scenario, the use of information on self-reported DM becomes an important and
convenient tool for population monitoring and surveillance, because of its low-cost and speed in data collection and analysis9.
Self-reported DM has often been used in national and international surveys14,16,19. Some studies
have been conducted in order to validate this self-reported information using biochemical
tests, for speciic locations and populations5,9,13,17,20. However, there is no consensus on the
precision and accuracy of this datum20. hus, the purpose of this study was to validate
self-reported DM in adults and older adults living in the city of São Paulo, Brazil.
METHODS
We have used data from the Inquérito de Saúde de São Paulo (ISA – Health Survey of São
Paulo), a cross-sectional population-based study with probabilistic sampling of the residents of the urban area of this city.
Briely, the sample was calculated by conglomerates in two stages: census tract (primary sampling units) and household (secondary sampling units). In the irst stage, 70 census sectors
were randomly selected from the register of the Pesquisa Nacional por Amostra de Domicílios
(PNAD – National Household Survey) of 2005 of the Brazilian Institute of Geography and Statistics (IBGE). Domains of study were set according to age and sex. In order to preserve the representativeness of each domain, diferent sampling fractions were applied, considering
the participation of age groups in the population of the urban area of São Paulo. Details of
sampling are described in Alves and Escuderb.
he study involved 2,086 adults (20-59 years) and older adults (60 years or older) of both sexes. Of these, 1,662 had two 24-hour dietary recalls (24hR) collected for the analysis of food intake and 592 had blood samples taken for the analysis of biochemical data. here was no diference in terms of sexes, age, income, and education between the original ISA
sample and the remaining sample18.
For this study, 569 individuals were selected (284 adults and 285 older adults), aged 20 years or
older, who had their fasting glucose evaluated or who reported the use of oral hypoglycemic agents or insulin. Twenty-three individuals were excluded because they had no values for the analysis of glucose.
a Ministério da Saúde (BR). VIGITEL Brasil 2013: vigilância de fatores de risco e proteção para doenças crônicas por inquérito telefônico. Brasília (DF); 2014.
In 2008, information was obtained in-home, using a structured questionnaire administered by
trained interviewers, who collected demographic, socioeconomic, lifestyle, health conditions, and health care service data.
he irst 24hR was collected in the irst home visit and conducted using the Multiple-Pass
methodc, in which the respondent is guided through ive steps (quick list, forgotten foods,
time & occasion, detail cycle, and inal probe) in a standardized process, which helps
to maintain the individuals interested and engaged in the interview, and helps them
remember all the items consumed. he second 24hR was conducted by telephone, two or
three days before the second home visit, using the interview system of the Nutrition Data
System for Research (NDS-R), version 2007, developed by the Nutrition Coordinating Center at the University of Minnesota, Minneapolis, MN, USA, which resembles the computerized version of the Multiple-Pass method (the Automated Multiple-Pass Method) as it enables the same structure to collect dietary data in ive steps.
In the second home visit, we measured the anthropometric and blood pressure parameters, collected venous blood, and investigated drug use. he data were collected by a previously
trained nursing technician, according to the recommendations for measuring weight, height20, waist circumference7, and blood pressure17.
For blood collection, participants were instructed to fast for 12 hours, without eating or drinking ( for alcoholic beverages, the minimum fast should be 36 hours), and no physical activity or exhaustive physical eforts should be performed during the 24 hours preceding
the test. Blood samples were collected in vacuum tubes with a clot activator (BD Vacutainer,
# 368660, Franklin Lakes, NJ, USA), packed in coolers, and immediately transported to the
laboratory for processing.
he self-reported DM information was obtained from the structured questionnaire from the answer to the question: “Do you have a chronic disease, a long-term disease, or a recurring disease?” Individuals who answered “Diabetes (if only gestational diabetes, select no)” were considered as self-reporting DM. A subsequent question was made: “Who told you that you have diabetes?” All individuals answered that a doctor made the diagnosis.
he laboratory diagnosis was made by measuring fasting serum glucose, using the enzyme glucose oxidase method (Glucose Liquiform, Labtest, Lagoa Santa, Minas Gerais, Brazil) and an automated system (LabMax 240, Lagoa Santa, Minas Gerais, Brazil). All biochemical analyses were carried out in duplicate with a 10% variation limit set as the criterion for
repetition of the test.
he use of drugs was investigated by asking the following question on the day of blood collection: “Do you currently use any medication and/or supplement?” “Which one?” he use of medication was also considered when the individual selected the options “routinely use insulin” or “routinely take oral medication” for the question “What do you do to control your diabetes?” (question included in the structured questionnaire). he individual was classiied as having DM if the value of fasting glucose was ≥ 7 mmol/L (126 mg/dL) or if
he or she used medications (oral hypoglycemic agents or insulin), according to current criteria at the time of the studyd.
Prediabetes was characterized by fasting glucose levels between 5.6 mmol/L (100 mg/dL) and 6.9 mmol/L (125 mg/dL) and if no oral hypoglycemic agents or insulin were usedd.
Alcoholism was investigated by a speciic questionnaire to assess alcohol dependence, named CAGE (Cut down, Annoyed by criticism, Guilty and Eye-opener)6. he cutof point adopted for positivity of the test was two or more positive answers. Usual alcohol consumption was estimated by incorporating 24hR data in the Multiple Source Method program.
Physical activity data was collected using the International Physical Activity Questionnaire (IPAQ), long version4. For the analyses, physical activity of leisure was considered, classiied
c Guenther PM, DeMaio TJ, Ingwersen LA, Berline M. The multiple-pass approach for the 24-hour recall in the Continuing Survey of Food Intakes by Individuals (CSFII) 1994-1996. Presented at the International Conference on Dietary Assessment Methods, January 1995; Boston, Mass. d Sociedade Brasileira de Diabetes. Diretrizes da
either as suicient (practice of physical activity for at least 30 minutes a day, ive days a week, of moderate intensity, or at least 20 minutes a day, three days a week, of vigorous intensity) or insuicient.
Body mass index (BMI) was calculated as weight divided by the square of height (BMI = weight [kg] / height [m]2) and classiied according to the World Health Organization20
for adults and the Pan American Health Organization (PAHO)10 for older adults. he BMI data
were categorized into overweight (overweight and obesity) and not overweight (underweight and normal weight).
Waist circumference was classiied as adequate or inadequate according to the cutof points of 88 cm for women and 102 cm for men7.
Hypertension was deined as systolic blood pressure ≥ 140 mmHg and diastolic blood pressure ≥ 90 mmHg or the use of drugs for hypertension17.
he study sample design was considered for all statistical analyses by using survey module commands available on Stata version 12.0. he signiicance level was set at 5%.
he prevalence of DM was calculated for the total population and by age group (adults and older adults). Diferences between the relative frequencies of socioeconomic and
lifestyle variables according to the presence of DM were analyzed using Pearson’s
Chi-square test. Absolute and relative frequencies were used to compare diagnosed DM
and self-reported DM.
The validation of self-reported DM was determined by sensitivity (proportion of individuals with DM that self-reported the condition), specificity (proportion of individuals without DM who reported not having the condition), positive predictive value (proportion of individuals who self-reported DM and were classified as having the condition), and negative predictive value (proportion of individuals who self-reported not having DM and were classified as such). The diagnosis of DM ( fasting glucose
≥ 7 mmol/L (126 mg/dL) or the use of oral hypoglycemic agents or insulin) was considered
as reference for these calculations. The validation of the self-reported data was also determined according to the socioeconomic and lifestyle variables.
he univariate Poisson regression with robust variance was used to identify factors associated
with the sensitivity of self-reported DM, so that the model could determine the probability of correct answer given the presence of DM.
The University Research Ethics Committee (CAAE 26800414.1.0000.5421) and the Ethics Committee of the Municipal Health Secretariat of São Paulo (CAAE 003.0.162.000-08)
have approved this study. The objectives of the study were explained to all potential participants and we emphasized that their participation would be completely voluntary.
All those who agreed to participate in the study, before starting any procedure, signed
the written informed consent.
RESULTS
he prevalence of DM among residents in the urban area of the city of São Paulo was estimated at 8.0% (95%CI 6.1–10.6), 5.0% in adults (95%CI 3.0–8.2) and 20.7% in older adults (95%CI 16.1–26.1). he prevalence of prediabetes in the study population was 4.4% (95%CI 2.7–7.3).
Table 1. Baseline characteristics of adults and older adults living in São Paulo, SP, Brazil, according to the diagnosis of diabetes mellitus, 2008.
Characteristics With DM Without DM pb
n % n %
Sex (n = 569)
Male 28 6.4 188 93.6 0.128
Female 54 9.5 299 90.5
Age group (n = 569)
Adults 17 5.0 267 95.0 0.000
Older adults 65 20.7 220 79.3
Self-reported race (n = 569)
White 49 7.6 306 92.4 0.623
Non-white 33 8.8 181 91.2
Education of head of household (n = 566)
Up to 5 years 57 15.0 196 85.0 0.001
6 or more years 25 5.5 288 94.5
Family income per capita (n = 569)
Up to 1 MWa 31 7.3 208 92.7 0.620
More than 1 MW 51 8.5 279 91.5
Marital status (n = 269)
With partner 5 3.3 109 96.7 0.097
Without partner 19 8.4 136 91.6
Smoking status (n = 569)
Non-smoker 44 6.2 276 93.8 0.013
Former smoker 29 15.4 118 84.6
Current smoker 9 6.8 93 93.2
Alcohol abuse (n = 255)
Possibly no 21 3.9 212 96.1 0.111
Possibly yes 4 9.2 18 90.8
Physical activity of leisure (n = 569)
Sufficient 4 4.5 50 95.5 0.229
Insufficient 78 8.5 437 91.5
BMI (n = 545)
Not overweight 33 4.8 239 95.2 0.028
Overweight 44 10.7 229 89.3
Waist circumference (n = 489)
Adequate 18 3.9 192 96.1 0.001
Inadequate 56 13.54 223 86.5
Hypertension (n = 569)
No 22 3.7 283 96.3 0.000
Yes 60 17.4 204 82.6
Health insurance (n = 569)
No 49 7.1 321 92.9 0.342
Yes 33 9.6 166 90.4
Hospitalization in the past year (n = 569)
No 77 8.3 448 91.7 0.160
Yes 5 4.3 39 95.7
Health problem in the past 15 days (n = 569)
No 59 7.5 378 92.5 0.303
Yes 23 10.3 109 89.7
DM: Diabetes mellitus; BMI: body mass index a MW: minimum wage (US$260.00).
b Pearson’s Chi-square test. Survey module commands were considered for analyses.
Table 2. Self-reported and diagnosed diabetes mellitus in adults and older adults living in São Paulo, SP, Brazil, 2008.
Self-reported diabetes mellitus
Diagnosed diabetes mellitus
Total
Yes No
n % 95%CI n % 95%CI N % 95%CI
Yes 63 63.8 49.2–76.3 4 0.3 0.0–0.9 67 5.4 4.0–7.2
No 19 36.2 23.7–50.8 483 99.7 99.1–99.9 502 94.6 92.8–96.0
Total 82 100 - 487 100 - 569 100
Table 3. Sensitivity, specificity, positive predictive values, and negative predictive values of self-reported diabetes mellitus*. São Paulo, SP, Brazil, 2008.
Validity % 95%CI
Sensitivity 63.8 49.2–76.3
Specificity 99.7 99.1–99.9
Positive predictive value 95.5 84.4–98.8
Negative predictive value 96.9 94.9–98.2
* Survey module commands were considered for analyses.
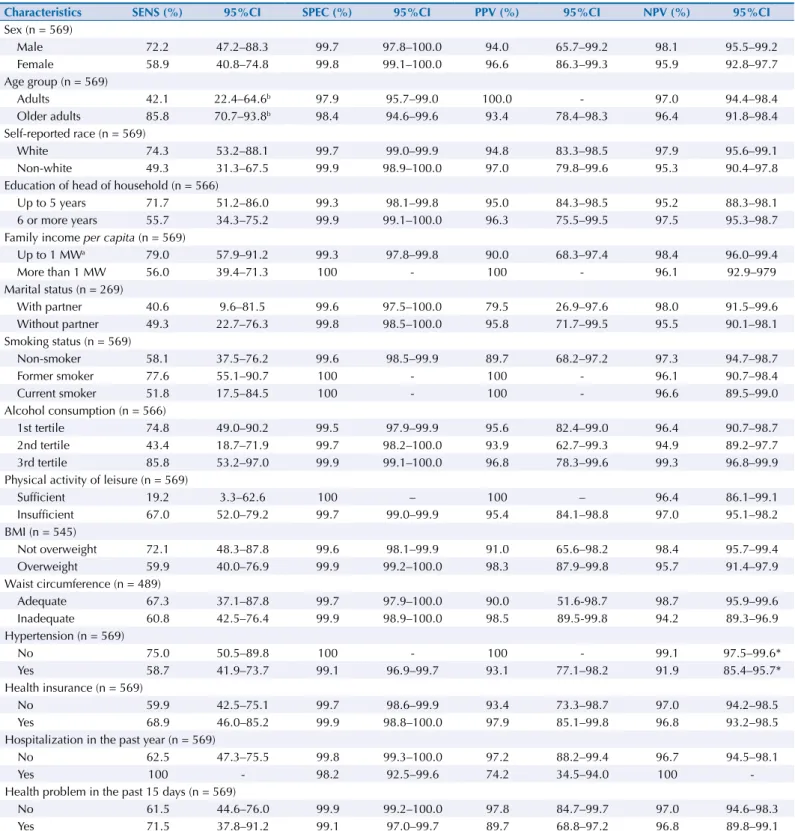
Table 4. Validation of self-reported diabetes mellitus according to baseline characteristics. São Paulo, SP, Brazil, 2008.
Characteristics SENS (%) 95%CI SPEC (%) 95%CI PPV (%) 95%CI NPV (%) 95%CI
Sex (n = 569)
Male 72.2 47.2–88.3 99.7 97.8–100.0 94.0 65.7–99.2 98.1 95.5–99.2
Female 58.9 40.8–74.8 99.8 99.1–100.0 96.6 86.3–99.3 95.9 92.8–97.7
Age group (n = 569)
Adults 42.1 22.4–64.6b 97.9 95.7–99.0 100.0 - 97.0 94.4–98.4
Older adults 85.8 70.7–93.8b 98.4 94.6–99.6 93.4 78.4–98.3 96.4 91.8–98.4
Self-reported race (n = 569)
White 74.3 53.2–88.1 99.7 99.0–99.9 94.8 83.3–98.5 97.9 95.6–99.1
Non-white 49.3 31.3–67.5 99.9 98.9–100.0 97.0 79.8–99.6 95.3 90.4–97.8
Education of head of household (n = 566)
Up to 5 years 71.7 51.2–86.0 99.3 98.1–99.8 95.0 84.3–98.5 95.2 88.3–98.1
6 or more years 55.7 34.3–75.2 99.9 99.1–100.0 96.3 75.5–99.5 97.5 95.3–98.7
Family income per capita (n = 569)
Up to 1 MWa 79.0 57.9–91.2 99.3 97.8–99.8 90.0 68.3–97.4 98.4 96.0–99.4
More than 1 MW 56.0 39.4–71.3 100 - 100 - 96.1 92.9–979
Marital status (n = 269)
With partner 40.6 9.6–81.5 99.6 97.5–100.0 79.5 26.9–97.6 98.0 91.5–99.6
Without partner 49.3 22.7–76.3 99.8 98.5–100.0 95.8 71.7–99.5 95.5 90.1–98.1
Smoking status (n = 569)
Non-smoker 58.1 37.5–76.2 99.6 98.5–99.9 89.7 68.2–97.2 97.3 94.7–98.7
Former smoker 77.6 55.1–90.7 100 - 100 - 96.1 90.7–98.4
Current smoker 51.8 17.5–84.5 100 - 100 - 96.6 89.5–99.0
Alcohol consumption (n = 566)
1st tertile 74.8 49.0–90.2 99.5 97.9–99.9 95.6 82.4–99.0 96.4 90.7–98.7
2nd tertile 43.4 18.7–71.9 99.7 98.2–100.0 93.9 62.7–99.3 94.9 89.2–97.7
3rd tertile 85.8 53.2–97.0 99.9 99.1–100.0 96.8 78.3–99.6 99.3 96.8–99.9
Physical activity of leisure (n = 569)
Sufficient 19.2 3.3–62.6 100 – 100 – 96.4 86.1–99.1
Insufficient 67.0 52.0–79.2 99.7 99.0–99.9 95.4 84.1–98.8 97.0 95.1–98.2
BMI (n = 545)
Not overweight 72.1 48.3–87.8 99.6 98.1–99.9 91.0 65.6–98.2 98.4 95.7–99.4
Overweight 59.9 40.0–76.9 99.9 99.2–100.0 98.3 87.9–99.8 95.7 91.4–97.9
Waist circumference (n = 489)
Adequate 67.3 37.1–87.8 99.7 97.9–100.0 90.0 51.6-98.7 98.7 95.9–99.6
Inadequate 60.8 42.5–76.4 99.9 98.9–100.0 98.5 89.5-99.8 94.2 89.3–96.9
Hypertension (n = 569)
No 75.0 50.5–89.8 100 - 100 - 99.1 97.5–99.6*
Yes 58.7 41.9–73.7 99.1 96.9–99.7 93.1 77.1–98.2 91.9 85.4–95.7*
Health insurance (n = 569)
No 59.9 42.5–75.1 99.7 98.6–99.9 93.4 73.3–98.7 97.0 94.2–98.5
Yes 68.9 46.0–85.2 99.9 98.8–100.0 97.9 85.1–99.8 96.8 93.2–98.5
Hospitalization in the past year (n = 569)
No 62.5 47.3–75.5 99.8 99.3–100.0 97.2 88.2–99.4 96.7 94.5–98.1
Yes 100 - 98.2 92.5–99.6 74.2 34.5–94.0 100
-Health problem in the past 15 days (n = 569)
No 61.5 44.6–76.0 99.9 99.2–100.0 97.8 84.7–99.7 97.0 94.6–98.3
Yes 71.5 37.8–91.2 99.1 97.0–99.7 89.7 68.8–97.2 96.8 89.8–99.1
SENS: sensitivity, SPEC: specificity, PPV: positive predictive value, NPV: negative predictive value, BMI: body mass index a MW: minimum wage (US$260.00).
he sample studied comprised subjects that were predominantly female (53.4%), adults (80.7%), who self-reported as white (51.6%), with head of household with six or more years of education (72.7%), with family income per capita of more than one minimum
wage (62.4%), without partner (52.6%), and who possibly do not abuse alcohol (89.2%). Among the individuals with DM, there was a predominance of older adults, with head of household with up to ive years of education, former smokers, overweight, with inadequate waist circumference, and hypertensive (Table 1).
Data from this study shows that 2.9% (95%CI 1.7–4.9) of the population of adults and older adults of São Paulo in 2008 were unaware of having DM. Of the individuals with DM, 63.8% self-reported the condition, while 36.2% were unaware of having the disease (Table 2). Adults corresponded to 80.4% (95%CI 57.9–92.5) of these individuals.
Table 3 shows the validation of self-reported DM. When the population was stratiied
by socioeconomic and lifestyle characteristics, the sensitivity was higher among older adults when compared to adults, and the negative predictive value was higher among the non-hypertensive when compared to the hypertensive (Table 4). For other categories, there
was no diference regarding speciicity and positive predictive values.
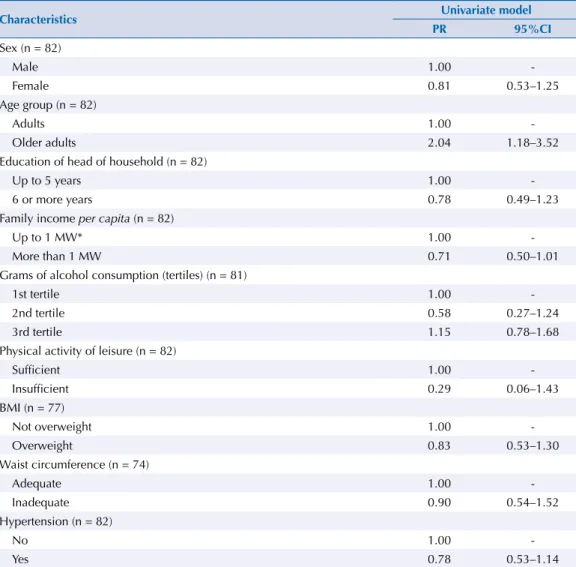
In the univariate Poisson regression model, only the age group was associated with sensitivity (Table 5). he prevalence of the correct answer for DM was higher among older adults (PR = 2.0; 95%CI 1.2–3.5) when compared to adults. he absolute number of individuals with
DM (n = 82) did not allow us to perform multiple Poisson regression analysis.
Table 5. Prevalence ratios of the sensitivity of self-reported diabetes mellitus according to baseline characteristics (raw data). São Paulo, SP, Brazil, 2008.
Characteristics Univariate model
PR 95%CI
Sex (n = 82)
Male 1.00
-Female 0.81 0.53–1.25
Age group (n = 82)
Adults 1.00
-Older adults 2.04 1.18–3.52
Education of head of household (n = 82)
Up to 5 years 1.00
-6 or more years 0.78 0.49–1.23
Family income per capita (n = 82)
Up to 1 MW* 1.00
-More than 1 MW 0.71 0.50–1.01
Grams of alcohol consumption (tertiles) (n = 81)
1st tertile 1.00
-2nd tertile 0.58 0.27–1.24
3rd tertile 1.15 0.78–1.68
Physical activity of leisure (n = 82)
Sufficient 1.00
-Insufficient 0.29 0.06–1.43
BMI (n = 77)
Not overweight 1.00
-Overweight 0.83 0.53–1.30
Waist circumference (n = 74)
Adequate 1.00
-Inadequate 0.90 0.54–1.52
Hypertension (n = 82)
No 1.00
-Yes 0.78 0.53–1.14
DISCUSSION
he results indicate that, in order to use the self-reported DM datum for residents of the
city of São Paulo, we need to consider the age group of the study population, as, while the
sensitivity of this information is 85.8% (95%CI 70.7–93.8) in older adults, the same is only 42.1% (95%CI 22.4–64.6) in adults, even though the sensitivity in the study population is 63.8% (95%CI 49.2–76.3).
A Brazilian study that has assessed the self-reported DM information in older adults of the city of Bambuí, state of Minas Gerais, Brazil, had a sensitivity rate of 57.1% (95%CI 50.3–63.8)11.
In international studies that have investigated self-reported DM among adolescents, adults and older adults, the sensitivity ranged from 30.1% (95%CI 24.0–36.2) to 70.4% (95%CI 64.5–75.8)5,9,13,20. he results show that, as in this study, sensitivity depends on the
study population.
One of the causes of the variation of sensitivity is the criterion that deines DM for validation
of self-reported data. Schneider et al.20 has found that the deinition of DM as fasting
glucose ≥ 7.8 mmol/L (140 mg/dL) or the use of drugs had higher sensitivity than the deinition of fasting glucose ≥ 7.0 mmol/L (126 mg/dL) or the use of drugs in participants of the Atherosclerosis Risk in Communities Study. Despite this inding, in our study, the classic deinition of fasting glucose ≥ 7.0 mmol/L (≥ 126 mg/dL) was chosen to be used as diagnosis, which has been indicated since 1997 by the Expert Committee on the Diagnosis and Classiication of Diabetes Mellitus and accepted by the World Health Organization and
the Brazilian Diabetes Society23.
he diference found in the sensitivity of self-reported DM among adults and older adults
in this study may have occurred because, in the population studied, older persons tend to the visit medical care more often than adults and, therefore, had already been diagnosed
with DM. Another possible reason is that older adults have more severe cases of the disease, since age is an important risk factor for the development of this condition12,15. On the other
hand, of the individuals classiied with DM and who did not know about the condition,
most were adults, a fact that may be related to the initial stage of the disease, when it has not yet been diagnosed.
Prediabetes and risk factors related to this condition were present in a substantial part of the study population. his fact emphasizes the importance of screening to minimize the progression of DM, condition that accounted for 5.4% of Brazilian disability-adjusted life years (DALY) in 20088.
he mass screening of individuals who do not show symptoms of DM or prediabetes is not recommended; however, the American Diabetes Association suggests tracking the diagnosis
of DM by fasting glucose, glycated hemoglobin, or by glucose tolerance test of individuals
that are overweight (BMI ≥ 25 kg/m2) and who have one of the following risk factors: physical
inactivity, irst-degree relative with DM, high-risk race/ethnic group (African American, Latino, Native American, Asian American, and Paciic Islanders), women who have been diagnosed with gestational DM, hypertension, HDL-c < 0.9 mmol/L (35 mg/dL) or level of triglycerides > 2.8 mmol/L (250 mg/dL), women with polycystic ovary syndrome, glycated hemoglobin ≥ 5.7%, impaired glucose tolerance or impaired fasting glucose on previous
testing, history of cardiovascular disease, or other conditions associated with insulin
resistance. Among those who do not present the mentioned risk factors, the screening of DM should be started in individuals aged 45 years and repeated every three to ive years1.
he screening of DM in Brazilian primary care is recommended when asymptomatic individuals have sustained blood pressure greater than 135/80 mmHge. In this study, 57.9% of the individuals who were unaware of having the disease met this criterion (data not shown).
Data from this study shows that 2.9% of the adults and older adults of São Paulo in 2008
were unaware of having DM. Similar result was found in a multicenter study conducted
in 1992, which described the prevalence of 3.4% of undiagnosed DM in a population aged 30-69 years in Brazilian urban areas12. However, when individuals with DM are taken as total,
the proportion of individuals unaware of the condition is 36.2%. Data from ELSA-Brazil shows an even higher prevalence (50.4%) of undiagnosed cases of DM15, a diference that may have
occurred because of the age of the population studied, 35-74 years, while this study, which uses data from the ISA, included individuals aged 20-94 years.
Age group was associated with sensitivity of self-reported DM in the univariate analysis. Among older adults living in Minas Gerais, Brazil, Lima-Costa et al. have detected that
visiting a doctor within the previous two years and educational level presented a positive
association with sensitivity of self-reported DM11. Educational level has been described as
a marker of social diferences in health. Data from the PNAD shows a higher prevalence of
investigated chronic diseases, including DM, in segments of the population with low literacy
levels2, which corroborates the higher prevalence of persons with head of household with
up to ive years of education among the individuals with DM found in this study.
The specificity of self-reported DM in a national study was 96.0% (95%CI 94.7–97.0). In international studies, the speciicity of this information ranged from 96.8% (95%CI 96.4-97.2) to 99.4% (95%CI 99.2–99.7)5,9,13,16; therefore, the result of this study is consistent with the
literature (99.7%; 95%CI 99.1–99.9). Diabetes Mellitus is a chronic disease with relatively clear diagnostic criteria and it has important implications for the quality of life of individuals that
have the disease13, which may explain the high speciicity of this self-reported information.
In this study, the prevalence of DM among residents of the urban area of the city of São Paulo was 8.0% (95%CI 6.1–10.6), whereas the prevalence of self-reported DM was 5.4% (95%CI 4.0–7.2), indicating that, despite the ease of collection and use of self-reported data,
the prevalence of this chronic disease is underestimated when self-reported information
is used. he same occurs when we compare the estimated prevalence of DM found in this study and the data from the VIGITEL-2008 of São Paulo, whose information is self-reported: 8.0% (95%CI 6.1–10.6) versus 6.5% (95%CI 5.3–7.7), respectively16.
An important limitation of validation studies on self-reported DM is the classiication bias11.
Only one measure of fasting glucose was used to classify the participants as individuals with DM in this study, while the ideal would be to repeat the test or to introduce the amount of glycated hemoglobin. Formerly only used for monitoring the glycemic control, glycated
hemoglobin has the advantage of not being inluenced by blood glucose luctuations from one day to the next, and it is currently also indicated to conirm the diagnosis of DM or
prediabetes1. However, because it is a population-based study, we could not measure fasting
glucose again or another marker. Furthermore, the use of fasting glucose does not allow diagnosing all individuals with DM, as observed by Goto et al.9 However, the inclusion of the biochemical measure in studies increases the validity of the data and reduces the
classiication bias13. It is possible that subjects that were not diagnosed with DM but who
self-reported the condition controlled their disease with their lifestyle, such as diet and
physical activity, which are also regarded as supporting factors for glycemic control1.
Another possible source of error was the classiication of all participants with fasting glucose ≥ 7.0 mmol/L (126 mg/dL) or use of oral medication or insulin as individuals with type 2 DM, with no stratiication among the other types of DM or other cases that demand the use of oral hypoglycemic agents. his fact does not invalidate the results, since type 2 DM represents 90% to 95% of all DM cases3. Of the individuals with DM, 1.9% reported age
of diagnosis under 18 years, an age group in which three quarters of the cases of type 1 or immune-mediated DM occur, though both did not use insulin, so they could not be classiied as individuals with type 1 DM, and it may indicate the early onset of type 2 DM, which is
increasingly being diagnosed at younger ages1.
Another limitation was the absolute number of individuals with DM (n = 82), which restricted
conidence intervals for some estimates and preventing us from using the multiple Poisson
regression model. However, few variables were associated with the sensitivity of self-reported DM in the univariate analysis, which suggests that the impossibility of carrying out a multiple
analysis is not a signiicant restriction. he same limitation was observed in a previous study conducted in the Netherlands: the Utrecht Health Project13.
he results obtained in this study provide evidence on the use of the self-reported DM information,
often used in national and international studies11,14,19, validate the data in a representative sample
of the city of São Paulo, and provide important prevalence estimates of DM for this city.
In conclusion, self-reported DM is valid, especially in older adults of the city of São Paulo. It is necessary to consider the age group of the study population in the analysis of this data,
which may underestimate the prevalence of diabetes in the study population and reduce
the power of association with other variables because of classiication error. herefore, the use of self-reported information will depend on the objectives of the study. In addition, the
results show the need for the screening of DM in asymptomatic individuals that have one
or more risk factors for DM, mainly in the adult population.
REFERENCES
1. American Diabetes Association. Standards of medical care in diabetes - 2014. Diabetes Care. 2014;37 Suppl 1:S14-80. https://doi.org/10.2337/dc14-S014
2. Barros MBA, Francisco PMSB, Zanchetta LM, César CLG. Tendências das desigualdades sociais e demográficas na prevalência de doenças crônicas no Brasil, PNAD: 2003-2008. Cienc Saude
Coletiva. 2011;16(9):3755-68. https://doi.org/10.1590/S1413-81232011001000012
3. Chen L, Magliano DJ, Zimmet PZ. The worldwide epidemiology of type 2 diabetes mellitus: present and future perspectives. Nat Rev Endocrinol. 2012;8(4):228-36. https://doi.org/10.1038/nrendo.2011.183
4. Craig CL, Marshall AL, Sjöström M, Bauman AE, Booth ML, Ainsworth BE, et al. International physical activity questionnaire: 12-country reliability and validity. Med SciSports Exerc. 2003;35(8):1381-95. https://doi.org/10.1249/01.MSS.0000078924.61453.FB
5. Espelt A, Goday A, Franch J, Borrell C. Validity of self-reported diabetes in health interview surveys for measuring social inequalities in the prevalence of diabetes. J Epidemiol Community Health. 2012;66(7):e15. https://doi.org/10.1136/jech.2010.112698
6. Ewing JA. Detecting alcoholism. The CAGE questionnaire. JAMA. 1984;252(14):1905-7. https://doi.org/10.1001/jama.1984.03350140051025
7. Executive Summary of the Third Report of the National Cholesterol Education Program (NCEP) Expert Panel on Detection, Evaluation, and Treatment of High Blood Cholesterol in Adults (Adult Treatment Panel III). JAMA. 2001;285(19):2486-97. https://doi.org/10.1001/jama.285.19.2486
8. Flor LS, Campos MR, Oliveira AF, Schramm JMA. Diabetes burden in Brazil: fraction attributable to overweight, obesity, and excess weight. Rev Saude Publica. 2015;49:29. https://doi.org/10.1590/S0034-8910.2015049005571
9. Goto A, Morita A, Goto M, Sasaki S, Miyachi M, Aiba N, et al. Validity of diabetes self-reports in the Saku diabetes study. J Epidemiol. 2013;23(4):295-300. https://doi.org/10.2188/jea.JE20120221
10. Lebrão ML, Duarte YAO, organizadores. SABE – Saúde, Bem-estar e Envelhecimento: o Projeto SABE no município de São Paulo: uma abordagem inicial. Brasília (DF): Organização Pan-Americana da Saúde; 2003.
11. Lima-Costa MF, Peixoto SV, Firmo JOA, Uchoa E. Validade do diabetes auto-referido e seus determinantes: evidências do projeto Bambuí. Rev Saude Publica. 2007;41(6):947-53. https://doi.org/10.1590/S0034-89102007000600009
12. Malerbi DA, Franco LJ. Multicenter study of the prevalence of diabetes mellitus and impaired glucose tolerance in the urban Brazilian population aged 30-69 yr. Diabetes Care. 1992;15(11):1509-16. https://doi.org/10.2337/diacare.15.11.1509
14. Paddison CAM, Saunders CL, Abel GA, Payne RA, Adler AI, Graffy JP, et al. How do people with diabetes describe their experiences in primary care? Evidence from 85,760 patients with self- reported diabetes from the English General Practice Patient Survey. Diabetes Care. 2015;38(3):469-75. https://doi.org/10.2337/dc14-1095
15. Schmidt MI, Hoffmann JF, Diniz MFS, Lotufo PA, Griep RH, Bensenor IM, et al. High prevalence of diabetes and intermadiate hyperglycemia – The Brazilian Longitudinal Study of Adult Health (ELSA-Brasil). Diabetol Metab Syndr. 2014;6:123. https://doi.org/10.1186/1758-5996-6-123
16. Schneider ALC, Pankow JS, Heiss G, Selvin E. Validity and reliability of self-reported diabetes in the Atherosclerosis Risk in Communities Study. Am J Epidemiol. 2012;176(8):738-43. https://doi.org/10.1093/aje/kws156
17. Selem SSAC, Castro MA, César CLG, Marchioni DML, Fisberg RM. Validade da hipertensão autorreferida associa-se inversamente com escolaridade em brasileiros. Arq Bras Cardiol. 2013;100(1):52-9. https://doi.org/10.1590/S0066-782X2012005000119
18. Shaw JE, Sicree RA, Zimmet PZ. Global estimates of the prevalence of diabetes for 2010 and 2030. Diabetes Res Clin Pract. 2010;87(1):4-14. https://doi.org/10.1016/j.diabres.2009.10.007
19. Stopa SR, César CLG, Segri NJ, Goldbaum M, Guimarães VMV, Alves MCGP, et al. Diabetes autorreferido em idosos: comparação das prevalências e medidas de controle. Rev Saude
Publica. 2014;48(4):554-62. https://doi.org/10.1590/S0034-8910.2014048005219
20. World Health Organization. Obesity: preventing and managing the global epidemic: report of a WHO Consultation. Geneva; 2000 [cited 2016 Sept 16]. (WHO-Technical Report Series, 894). Available from: http://who.int/iris/handle/10665/63854
Funding: Municipal Health Department of São Paulo, National Council for Scientiic and Technological Development (CNPq – Process 481176/2008-0 and 473100/2009-6), São Paulo Research Foundation (FAPESP – Process 2009/15831-0) and Coordination for the Improvement of Higher Education Personnel.
Authors’ Contribution: Design and planning of the study: MMF, JAT, CHS, RMF; MMF. Analysis and interpretation of the data: JAT, CHS, MAC, MCGPA, RMF. Drafting of the study: MMF, JAT, CHS. Critical review of the study: MAC, CLGC, MCGPA, MG, DMM, RMF. All authors have read and approved the submitted version.