Genetic variability in mitochondrial and nuclear genes of
Larus dominicanus
(Charadriiformes, Laridae) from the Brazilian coast
Gisele Pires de Mendonça Dantas
1, Diogo Meyer
1, Raquel Godinho
2, Nuno Ferrand
2and João Stenghel Morgante
11
Laboratório de Biologia Evolutiva e Conservação de Vertebrados, Departamento de Genética
e Biologia Evolutiva, Instituto de Biociências, Universidade de São Paulo, São Paulo, SP, Brazil.
2Centro de Investigação em Biodiversidade e Recursos Naturais, Porto, Portugal.
Abstract
Several phylogeographic studies of seabirds have documented low genetic diversity that has been attributed to bot-tleneck events or individual capacity for dispersal. Few studies have been done in seabirds on the Brazilian coast and all have shown low genetic differentiation on a wide geographic scale. The Kelp Gull is a common species with a wide distribution in the Southern Hemisphere. In this study, we used mitochondrial and nuclear markers to examine the genetic variability of Kelp Gull populations on the Brazilian coast and compared this variability with that of sub-Antarctic island populations of this species. Kelp Gulls showed extremely low genetic variability for
mitochon-drial markers (cytb and ATPase) and high diversity for a nuclear locus (intron 7 of theb-fibrinogen). The intraspecific
evolutionary history of Kelp Gulls showed that the variability found in intron 7 of theb-fibrinogen gene was compatible
with the variability expected under neutral evolution but suggested an increase in population size during the last 10,000 years. However, none of the markers revealed evidence of a bottleneck population. These findings indicate that the recent origin of Kelp Gulls is the main explanation for their nuclear diversity, although selective pressure on the mtDNA of this species cannot be discarded.
Key words:cytb, FIB7 intron, phylogeography, recent origin, selective sweep.
Received: January 13, 2012; Accepted: June 28, 2012.
Introduction
The gull genusLarus, which consists of 25 species worldwide, has a complex evolutionary history. Twenty-one species ofLarusoccur in the Northern Hemisphere and hybridization among several species in areas of secondary contact has been documented (Lieberset al., 2001; Crochet et al., 2003; Ponset al., 2004). Most studies of the genus
Larus have addressed the systematics of this group and
have reported recent divergence among various species (Crochetet al., 2003; Ponset al., 2005). Some studies have concluded that the last glaciations had a strong influence on the evolutionary pressures acting on this group (Lieberset al., 2001, 2004; Crochetet al., 2003). In contrast to North-ern Hemisphere species, little is known about the four spe-cies of Larus that occur in the Southern Hemisphere. Indeed, the work described in here is the first study to ex-amine the population genetics of this group.
Larus dominicanus (Kelp Gull) (Charadriiformes:
Laridae) is a common species that is widely distributed in the Southern Hemisphere, including South America, south-ern Africa, Australia, New Zealand, sub-Antarctic islands and the Antarctic Peninsula (Burguer and Gochfeld, 1996). Several studies have documented a large increase in the size of Kelp Gull populations in recent decades (Quintana and Yorio, 1998; Steele and Hockey, 1990). For example, the Kelp Gull population of the Valdez Peninsula, Argen-tina, reportedly increased from 3,200 to 6,500 breeding pairs in 10 years (Quintana and Yorio, 1998). These in-creases in population size may reflect the fact that the Kelp Gull is a competitive species that preys on several seabird species and displaces many species from their breeding sites (Quintana and Yorio, 1998). However, the effects of Kelp Gulls on coastal wildlife are not confined to other sea-birds. Thomas (1988) and Rowntreeet al.(1998) observed Kelp Gulls injuring Right Whales (Eubalaena australis) by picking off skin and fat when the whales surfaced to brea-the. These authors argued that intense harassment by gulls caused Right Whales to abandon breeding areas before their young are sufficiently strong for the open sea.
Send correspondence to Gisele P.M. Dantas. Laboratório de Biodi-versidade e Evolução Molecular, Instituto de Ciências Biomédicas, Universidade Federal de Minas Gerais, Av. Antonio Carlos 6627, Sala L3-244, 31270-010 Belo Horizonte, MG, Brazil. E-mail: [email protected].
For several species of seabirds, there are few or no vicariant processes and extrinsic barriers to dispersion (Congdonet al., 2000), leading to the expectation that low levels of population structure should be observed. On the other hand, strong philopatry, a wide geographic distribu-tion or historic separadistribu-tion can create substantial genetic dif-ferentiation in some species (Genovart et al., 2003). Several studies had shown low population structure in sea-birds (Austinet al., 1994; Friesenet al., 1996). On the Bra-zilian coast, the few studies that have been done have shown low genetic differentiation on a wide geographic scale. Fariaet al.(2010) observed low genetic structure in the South American Tern (Sterna hirundinacea) on the Brazilian coast. Gonçalveset al.(2007) also found low ge-netic structure in Calidris pusilla on the north coast of Brazil. A similar pattern was observed forSula dactylacta
and Sula leucogaster along the Brazilian coast
(Baum-garten MM, 2003, PhD thesis, Universidade de São Paulo, São Paulo, Brazil). In all three cases, low genetic differenti-ation was attributed to a high capacity for dispersion that homogenized the genetic variability among population or to a population bottleneck that reduced the genetic diversity through the loss of a large number of individuals.
For many years, phylogeographic studies were based on the analysis of a single locus for mitochondrial markers (Austinet al., 1994; Brownet al., 2004; Helbig and Sei-bold, 1999; Aviseet al., 2000). However, more recently, the use of nuclear markers to infer evolutionary history has proven to be highly informative; these markers allow infer-ences on more remote demographic events that have helped to clarify the evolutionary history of many groups (Hareet al., 2002; Godinhoet al., 2006; Melo-Ferreiraet al., 2009). Mitochondrial and nuclear markers have different effective population sizes and modes of inheritance such that demo-graphic events shape the variation in these genetic markers in distinct ways (Zink and Barrowclough, 2008). In addi-tion, because mitochondria do not generally undergo re-combination any selection events on a mitochondrial gene would tend to decrease the diversity at linked loci through hitch-hiking or background selection (Bazinet al., 2006). Since mitochondria show maternal inheritance the pattern observed for this molecule faithfully represents the history of the population based on female patterns (Ballard and Whitlock, 2004). In contrast, nuclear markers reflect both male and female histories (Zhang and Hewitt, 2003), have deeper coalescence times and experience recombination, thus making distinct unlinked markers independent. Conse-quently, studies that use both markers should provide a more accurate evolutionary history of the group being in-vestigated.
Into this context, Kelp Gulls are an interesting group in which to study phylogeography patterns because of their wide distribution, fast-growing populations and intense interaction with other species. The use of nuclear and mito-chondrial markers should allow us to reconstruct the
evolu-tionary history of this species on the Brazilian coast. The aim of the present study was to estimate the divergence of the Kelp Gull from its sister groups and to describe the ge-netic variability of this species in populations on the Brazil-ian coast in comparison with sub-Antarctic islands popula-tions of this species. Two major quespopula-tions were addressed: 1) Are Brazilian populations genetically different from each other and from non-Brazilian populations? and 2) Is there genetic evidence for a population bottleneck or ex-pansion in the recent evolutionary history of Kelp Gulls?
Materials and Methods
Phylogenetic analysis
The phylogenetic analyses of the Larus group re-ported by Lieberset al.(2004) and Ponset al.(2005) lo-cated the Kelp Gull in a group consisting of large white-headed gulls. Based on these analyses, we sought to esti-mate the divergence of the Kelp Gull from its sister groups. For this, we used 105 specimens,i.e., five specimens ofL. dominicanusand 98 individuals from other taxa of the ge-nusLarus; the phylogeny was rooted with the two individu-als from genusRissawith 405 bp of cytochrome b, obtained from GenBank (Supplementary material Table S1). The se-quences were aligned by eye using Bioedit v. 7.0 (Hall, 2001). The most appropriate model of DNA evolution for the sequences was inferred with MODELTEST (Posada and Cradall, 1998) implemented in PAUP v. 4.0 (Swofford, 2000). Bayesian inferences were done using BEAST v.1.4.8 software (Drummond and Rambaut, 2007). This analysis was based on the following assumptions: a re-stricted molecular clock, a 2% per million years substitu-tion rate and a 3.3 Mya (Million years ago) divergence be-tween the generaRissaandLarus(Patonet al., 2003). We then used a portioned Bayesian Inference search in a Markov-Chain Monte Carlo analysis to run four independ-ent chains, each with 10,000,000 steps and sampled every 1000 steps, excluding a burn-in of 1,000,000 trees. The pa-rameter analysis was visualized by means of Tracer v. 1.4.1 software and the trees were connected in TreeAnotator and visualized in FigTree (Drummond and Rambaut, 2007).
Intraspecific analysis
Population sampling
DNA was isolated from blood samples by a standard phe-nol/chloroform technique, precipitated with ethanol and re-suspended in Tris-EDTA (TE) buffer (Sambrook et al., 2001). In addition, sequences available in GenBank from Kerguelen Island and New Zealand were included in the analysis to compare genetic diversity.
Molecular methods
Two regions of mitochondrial DNA (ATPase 8and6 of ~750 bp andcytochrome b(cytb) of ~350 bp) and one nu-clear (intron 7 ofb-fibrinogen, ~900 bp) were used in this study.ATPase 8is the second most variable region of the mitochondrial genome in birds, but it is short (165-168 pb). Thecytbgene is a well-conserved region with an estimated substitution rate of ~2%/Myr for the entire avian mitochon-drial genome (Shields and Wilson, 1987; Bridge et al., 2005). Intron 7 ofb-fibrinogenis located on chromosome 4 in chicken (Gallus gallus) and has been used in other phylogeographic studies (Bridgeet al., 2005; Godinho et al., 2006; Gonçalveset al., 2007); this intron has an evolu-tionary rate of 0.53%/Myr in the pigeon (Johnson and Clay-ton, 2000). TheATPase 8and6fragments were amplified using primersLys(Sorensonet al., 1999) andint-H(Faria et al., 2007),cytbwas amplified using primersL15008and
H1532b (Desjardin and Morais, 1990) and intron 7 of
b-fibrinogen was amplified using primers FIB7U and
Fib7L (Prychitko and Moore, 2000). The reactions for
ATPase 8and6andcytbwere run in a final volume of 10
mL containing 1XTaqplatinum polymerase buffer (10 mM Tris-HCl, pH 8.3, 50 mM KCl), 2.5 mM MgCl2, 2 mM of each dNTP, 10 pmol of primer, 0.5 units ofTaqpolymerase and approximately 20 ng of DNA. The PCR cycling se-quence consisted of 94 °C for 5 min, followed by 35 cycles of 94 °C for 45 s, 58 °C for 35 s and 72 °C for 45 s, with a
fi-nal extension at 72 °C for 10 min. The PCR forb -fibri-nogenPCR was done in a final volume of 10mL containing 1X PCR buffer (50 mM Tris-HCl, 50 mM NaCl, pH 8.5), 200 uM of each dNTP, 0.5 units of GoTaqDNA polymer-ase (Promega), 5 pmol of each primer and approximately 50 ng of DNA. The PCR began with an initial denaturation of 5 min at 95 °C followed by 38 cycles of 30 s at 95 °C, 45 s at 60 °C, 1 min at 72 °C and a final extension of 7 min at 72 °C.
The PCR products were purified using EXOI-SAP (1:1). Sequences were obtained using BigDye terminator (version 3.1) (Applied Biosystems) according to the manu-facturer’s recommendations and the primers used for PCR; the sequences were analyzed on an Applied Biosystems 3100 genetic analyzer. Electropherograms were checked by eye in ChromasLite (www.technelysium.com.au). The alignments were adjusted by eye in Bioedit v.5.06 software (Hall, 2001). A Bayesian approach run with the program PHASE (Stephenset al., 2001) was used to identify haplo-types of heterozygotes in the nuclear intron; this program reconstructs the haplotype as implemented in DNAsp v. 5.10.01 software (Librado and Rozas, 2009). The RDP (Recombination Detection Program) v.3 (Martin et al., 2005) was used to detect recombination in the set of aligned DNA sequences, based on the following methods: the origi-nal RDP, bootscanning, GENECONV, Maximum Chi Square, Chimaera, Sister Scanning and 3SEQ. All of these non-parametric recombination detection methods provided a detailed breakdown of the recombination breakpoint loca-tions and of the identities of recombinant and parental se-quences.
Comparison of mtDNA versus nDNA diversity
For intraspecific analyses, a fragment ofcytb(312 bp) was sequenced in 83 individuals from the Brazilian coast, seven individuals from the Antarctic Peninsula, and five in-dividuals from Marion Island. These sequences were com-pared with those available in GenBank from New Zealand (NC006007, AY293619 and AF268497) and Kerguelen Is-land (AF444259). The coding region ofATPase 6and8 was sequenced for 58L. dominicanusindividuals from the Brazilian coast. Intron 7 of theb-fibrinogengene (858 bp) was sequenced in 66 individuals from the Brazilian coast, seven individuals from the Antarctic Peninsula and three individuals from Marion Island.
Descriptive analyses including haplotype diversity (h), nucleotide diversity (p) and Theta per gene (q) were calculated for all loci using DNAsp v.5.10.01 (Librado and Rozas, 2009). Tajima’s D value (Tajima, 1989) and Fu and Li’s D* and F* values (Fu and Li, 1993) and the signifi-cance of these neutrality test statistics were calculated us-ing DNAsp v.5.10.01 (Librado and Rozas, 2009). DNAsp v.5.10.01 was also used to calculate parameters for the de-mographic history of the population based on mismatch distributions; unimodal curves are expected in populations
that have undergone rapid population expansion (Rogers and Harpending, 1992). The Raggedness statistic and Ra-mos-Onsins and Rozas R2 statistics (Ramos-Onsins and Rozas, 2002) were used to test for deviations between the observed and expected on mismatch distribution. Haplo-type networks were constructed using the median-joining method (MJN) (Bandeltet al., 1999) as implemented in the NETWORK v.4.1.0.8 software
We used coalescent simulations to generate the pre-dicted levels of genetic diversity based ona priorispecified demography history, thus allowing us to contrast nuclear and mitochondrial markers based on the following assump-tions or hypothesis: 1) If a demographic event affected the gull populations it would leave signatures in the entire mi-tochondrial and nuclear genomes; on the other hand, selec-tive events would leave signatures only at individual loci and unlinked loci, 2) Lieberset al.(2001) stated that the last glaciation affected the distribution of these gulls; conse-quently, if the last glaciation reduced the population size then the ecological expansion observed today is a conse-quence of expansion after this period, and 3) if this species has a recent origin, as described for other seabirds (Crochet et al., 2003; Ponset al.(2005), then the diversity observed in mitochondrial DNA and nuclear DNA is the result of an-cestral polymorphism, with or without expansion of the species.
The simulations based on these three scenarios were run in SIMCOAL2 (Laval and Excoffier, 2004): Scenario 1 – theL. dominicanuspopulation has experienced continu-ous expansion from the time of its divergence from other Larusspecies to the present, Scenario 2 – the population passed through a bottleneck that reduced 90% its original population size 10,000 years ago followed by subsequent expansion and Scenario 3 – the population has a recent ori-gin with regard to the time of divergence fromLarus fuscus
complex to formL. dominicanusas estimated here and has not experienced expansion or a bottleneck. This approach allowed us to compare the results for all Brazilian popula-tions with simulated data generated under each model, with the following additional assumptions: a substitution rate of 2%/Myr forcytochrome b(Shields and Wilson, 1986) and 0.53%/Myr forb-fibrinogen(Johnson and Clayton, 2000). The initial population sizes were calculated for each popu-lation on the Brazilian coast based on the variability of the
b-fibrinogenlocus (Table 1). The generation time used in this simulation forL. dominicanuswas 10 years based on that estimated forL. michaelisfrom field data (Crochetet al., 2003). The estimated divergence time between L.
dominicanusand theL. fuscuscomplex in this work was
used to calculate the number of generations from the diver-gence up to the present day. For each scenario, 10,000 sim-ulations were run and the SIMCOAL2 results were then analyzed using ARLEQUIN v.3.01 (Excoffieret al., 1992) to estimate Tajima’s D values for each simulation. The val-ues obtained during each run were used to construct the dis-tribution of Tajima’s D values for each L. dominicanus population on the Brazilian coast. Finally, the observed Tajima’s D values for each Brazilian population were com-pared with the distribution generated by the simulations.
Population analysis
Population analyses were done only for intron 7 of
b-fibrinogensince the mitochondrial locus showed insuffi-cient variation. Each island was considered as a single pop-ulation. We estimated the haplotype diversity (h), nucleo-tide diversity (p) and Theta (q) per gene for each population using DNAsp v. 5.10.01. In addition, Tajima’s D value, Fu and Li’s D* and F* values and Ramos-Onsins and Rozas R2 statistics were calculated for all populations and the
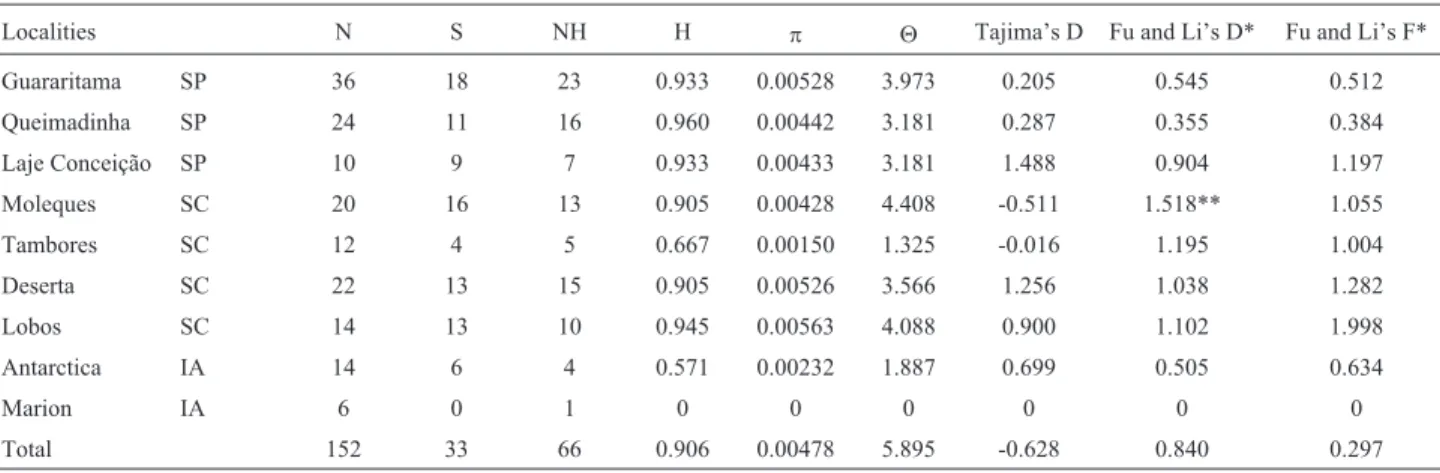
signifi-Table 1- Analysis of the genetic diversity of intron 7 ofb-fibrinogenin variousL. dominicanuspopulations, showing the number of polymorphic sites (S), haplotype number (NH), haplotype diversity (H), nucleotide diversity (p) and theta (q) per gene. The parameters used in the neutrality test of intron 7 of theb-fibrinogengene are also shown.
Localities N S NH H p Q Tajima’s D Fu and Li’s D* Fu and Li’s F* Guararitama SP 36 18 23 0.933 0.00528 3.973 0.205 0.545 0.512 Queimadinha SP 24 11 16 0.960 0.00442 3.181 0.287 0.355 0.384 Laje Conceição SP 10 9 7 0.933 0.00433 3.181 1.488 0.904 1.197
Moleques SC 20 16 13 0.905 0.00428 4.408 -0.511 1.518** 1.055 Tambores SC 12 4 5 0.667 0.00150 1.325 -0.016 1.195 1.004
Deserta SC 22 13 15 0.905 0.00526 3.566 1.256 1.038 1.282
Lobos SC 14 13 10 0.945 0.00563 4.088 0.900 1.102 1.998
Antarctica IA 14 6 4 0.571 0.00232 1.887 0.699 0.505 0.634
Marion IA 6 0 1 0 0 0 0 0 0
Total 152 33 66 0.906 0.00478 5.895 -0.628 0.840 0.297
cance of these test statistics was assessed using DNAsp v. 5.10.01 (Librado and Rozas, 2009).
The overall differentiation of intron 7 ofb-fibrinogen among the sampled populations was quantified using pair-wise F-statistics. Empirical FSTvalues were compared with a null distribution of no difference between the populations to test for significance. The analyses were implemented in ARLEQUIN with 10,000 permutations. Molecular distances were estimated by the method of Tamura (1992) which al-lows for unequal nucleotide frequencies. The transi-tion-to-transversion ratios, as well as the overall nucleotide frequencies, were computed from the original data. The par-titioning of genetic differences among populations was as-sessed using hierarchical analysis of molecular variance (AMOVA; Excoffieret al., 1992), with 10,000 permutations and estimates of molecular distance (Tamura, 1992).
The Mantel test was used to assess the association be-tween geographic distance and genetic distance for all pop-ulation pairs. The test was initially included all islands (Brazilian and sub-Antarctic ones) and was then run by considering the Brazilian islands and the Antarctic Penin-sula without Marion Island since the latter locality had only one haplotype.
Bayesian Skyline plots were constructed with BEAST v. 1.4.6 (Drummond and Rambaut, 2007) to esti-mate historical changes in population size over time. Since this method for estimating historical demography assumes that sequences are sampled from a single panmitic popula-tion the analysis considered all of the populapopula-tions as a sin-gle group. This method uses Markov-Chain Monte Carlo sampling techniques to estimate the posterior distribution of effective population size given a set of aligned DNA se-quences and a model of molecular evolution and takes into consideration uncertainty in the genealogical process (Drummondet al., 2005). The best-fit model of molecular evolution selected based on the criteria of Posada and Cradall (1998) was implemented in PAUP v.4.0 (Swofford, 2000). The skyline plot was run for 20,000,000 steps with parameters logged every 2,000 steps and a burn-in of 1,000,000 trees, under a strict molecular clock based on a substitution rate of 0.53%/Myr for b-fibrinogen of G.
gallus (Jonhson and Clayton, 2000). Skyline plots were
constructed using TRACER v.1.4.1 (Drummond and Rambaut, 2007).
Results
Phylogenetic analyses
Phylogenetic Bayesian analysis based oncytochrome bwas done using the HKY+G model. The inferred topol-ogy showed short branch lengths within gull species (Fig-ure 2). Larus dominicanus appeared as a monophyletic clade and the sister clade consisted of six species from the
fuscus complex: L. taymyrensis, L. glaucoides, L.
glaucescens,L. smithsonianns,L. marinusandL. shiasagus
(Figure 2). The estimated divergence time of L.
dominicanusfrom thefuscuscomplex was ~241,200 years
ago. The time to the most recent common ancestor ofL.
dominicanuswas ~153,184 years ago.
Intraspecific analyses
Comparison of mtDNA and nDNA diversity
Larus dominicanusfrom the Brazilian coast showed
only one haplotype forcytochrome bwhile the sequences from the Antarctic Peninsula, Marion Island, Kerguelen Is-land and New ZeaIs-land represented another haplotype that differed by a single substitution (Table 2). The coding re-gion ofATPase 6and8 contained three haplotypes with two polymorphic sites (Table 2). The most common haplo-type found on the Brazilian coast (HBRA01) was identical to the sequences found in New Zealand (NC006007, AY293619) (Figure 3). On the other hand, intron 7 of
b-fibrinogenhad a comparatively higher genetic diversity with 55 haplotypes, 28 polymorphic sites, three singletons and 25 parsimonius sites (Figure 3 and Table 2). All of these sequences are available through GenBank accession numbers FJ668863-FJ668936. None of the methods imple-mented in RDP3 software provided any evidence of recom-bination in intron 7 ofb-fibrinogen, a finding that allowed the use of all haplotypes in subsequent analyses.
Tajima’s D value and Fu and Li’s D* and F* values forcytochrome b,ATPase 6and8and intron 7 ofb -fibri-nogenrevealed no significant deviation from neutrality and the expected equilibrium (Table 2), except for Fu and Li’s D* value for intron 7 ofb-fibrinogen. The mismatch distri-bution of intron 7 ofb-fibrinogen showed a wave signal (multiple peaks) consistent with a stable population (Rag-gedness index = 0.0110 and Ramos-Onsins and Rozas r2= 0.0723, p = 0.60; intial theta = 1.89 and tau = 2.19) (Figure 4). However, the mismatch distribution for loci from mtDNA did not show the expected bias for
cyto-chrome b(Raggedness statistic r = 0.280 and
Ramos-On-sins and Rozas r2= 0.1367; estimated initial theta = 0.00 and tau = 0.273) andATPase 6 and 8(Raggedness statistic r = 0.199 and Ramos-Onsins and Rozas r2= 0.0925; esti-mated initial theta = 0.000 and tau = 0.370).
The best scenario from simulations that could explain the variation found in nuclear intron 7 ofb-fibrinogenwas the hypothesis of a recent origin and neutral evolution, without marked expansion. None of the models used in the simulations were compatible with the diversity found at the
cytochrome blocus. We therefore chose to show only the
outcomes of the simulations for this scenario (Figure 5) be-cause other simulations showed distributions that did not include the values observed in the populations.
Population analysis
When Tajima’s D value and Fu and Li’s D* and F* values for intron 7 ofb-fibrinogenwere analyzed for each
Table 2 -Genes analyzed in L. dominicanus showing the number of polymorphic sites (SNP), haplotype diversity (h), nucleotide diversity ( p ), theta per gene ( q ), Tajima’s D value and Fu and Li’s D* and F* values among loci. Gene N Size SNP H Pi ( p ) q Tajima’s D (ci) P Fu and Li’s F* (ci) P Fu and Li’s D* (ci) P cytochrome b 95 315 1 0.273 0.00083 0.00064 0.460 (-1.30; 1.82) 0.74 0.565 (-2.00; 1.24) 0.75 0.496 (-2.01; 0.94) 0.48 ATPase 8 and 6 58 583 2 0.358 0.00063 0.00074 -0.323 (-1.44; 1.81) 0.39 0.513 (-2.01; 1.28) 0.67 0.723 (-1.89; 0.98) 0.88 Intron 7 of b -fibrinogen 152 858 28 0.896 0.00465 1.053 0.0517 (-1.65; 1.95) 0.61 0.13 (-2.21; 1.70) 0.12 1.74 (-2.14; 1.57) 0.02 ci – confidence interval.
population separately they revealed no significant devia-tion from neutrality and the expected equilibrium, except for the Moleques population in Santa Catarina that deviated significantly from Fu and Li’s D test (Table 1).
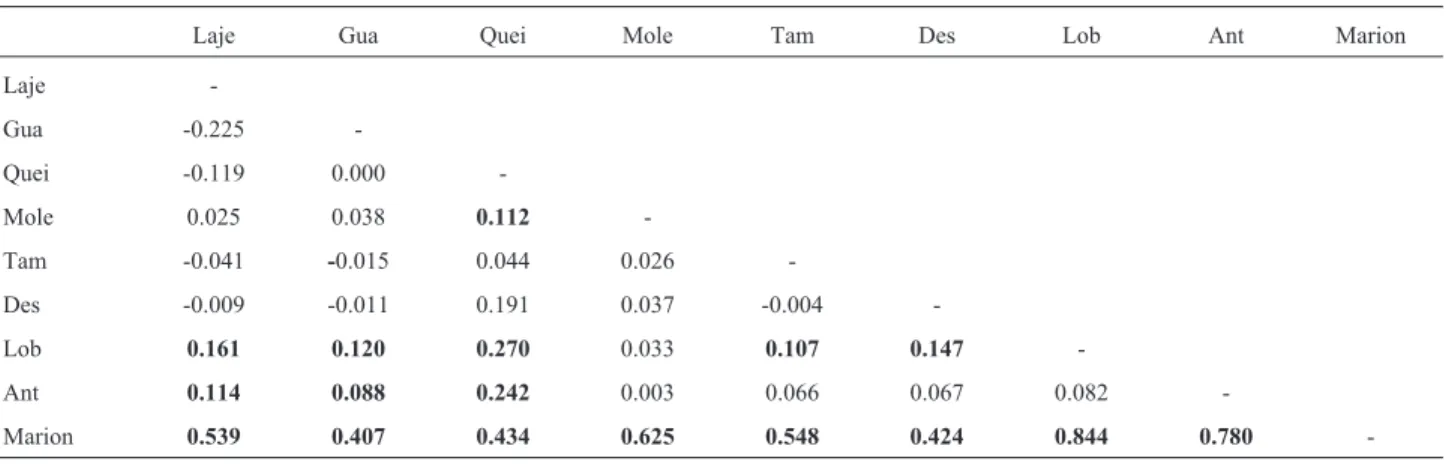
AMOVA of intron 7 of theb-fibrinogen revealed sig-nificant differentiation among populations, but a large part of the total variation was found within the population (92%; Table 3). The Marion Island population was the most dif-ferentiated population ofL. dominicanusbecause of a sin-gle exclusive haplotype (Table 4). There was also differen-tiation between the Antarctic and São Paulo islands
(Guararitama, Queimadinha, Laje da Conceição) but there was no marked differentiation between Santa Catarina is-lands (Moleques, Tambores, Itacolomis) and the Antarctic. This weak structure was corroborated by the locus network (Figure 3) which detected no exclusive haplotypes for any region, except for Marion Island.
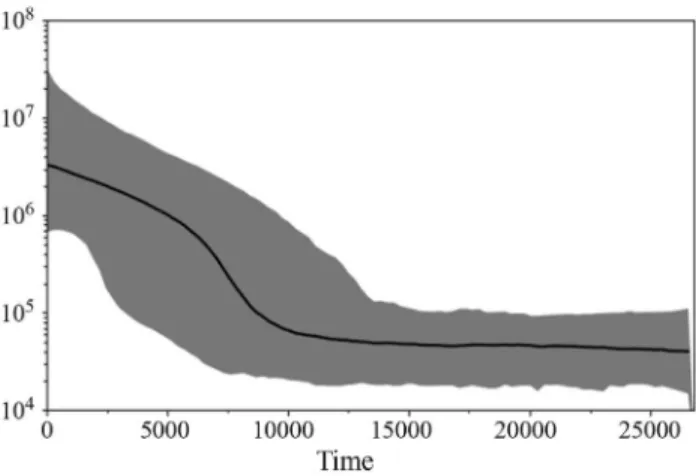
The Mantel test detected a correlation between dis-tance and genetic differentiation when all populations were used in the test (r = 0.826) but this was not significant (test t= 2.5752; p = 0.9950). The correlation found using that the Mantel test without Marion Island was r = 0.324 (test t= 1.2651; p = 0.8971). The Bayesian Skyline analysis in-dicated rapid growth that started ~10,000 years ago and has continued up to the present time, with no sign of retraction during the evolutionary history of these lineages of intron 7 of theb-fibrinogen gene (Figure 6).
Discussion
Phylogenetic analysis
The phylogenetic analysis indicated that theLarus group has a recent origin:L. dominicanusdiverged from the fuscuscomplex 241,201 years ago and the time to the most recent common ancestor was estimated at 153,184 years ago (Figure 2). Other researchers have also shown that the
Larus group has a recent origin. The argentatus-fuscus
complex diverged between 100,000 and 170,000 years ago (Crochet and Desmarais, 2000); the species into this
com-Table 3- Analysis of molecular variance (AMOVA) for intron 7 of theb-fibrinogengene ofL. dominicanuspopulations.
Source of variation Degrees of freedom Sum of squares Variance components Percentage of variation
Among population 8 7.903 0.03565 Va 7.8
Within population 139 58.374 0.41996 Vb 92.2
Total 147 66.277 0.45560 100.00
Fst = 0.074, p = 0.00. Va: covariance component due to differences among populations within populations. Vb: covariance component among individuals within populations.
Table 4- Pairwise FSTvalues for intron 7 ofb-fibrinogen(below diagonal) among populations ofL. dominicanus.Significant values (p < 0.05) are
indi-cated in bold.
Laje Gua Quei Mole Tam Des Lob Ant Marion
Laje
-Gua -0.225
-Quei -0.119 0.000
-Mole 0.025 0.038 0.112
-Tam -0.041 -0.015 0.044 0.026
-Des -0.009 -0.011 0.191 0.037 -0.004
-Lob 0.161 0.120 0.270 0.033 0.107 0.147
-Ant 0.114 0.088 0.242 0.003 0.066 0.067 0.082
-Marion 0.539 0.407 0.434 0.625 0.548 0.424 0.844 0.780 -Figure 4 - Mismatch distribution of the fragment of intron 7 of
plex share several haplotypes and hybridization is observed in their contact zone in the Northern Hemisphere. Givenet al. (2005) also reported a recent origin for masked gulls since they estimated that nine species in the Southern He-misphere diverged from a common ancestor ~0.5 Mya. Overall, there is a consensus regarding the recent diver-gence of the genusLarusand the cause of extensive hybrid-ization among species in the Northern Hemisphere (Liebers et al., 2001, 2004; Crochetet al.,2003; Givenet al.,2005).
Comparison of mtDNA and nDNA diversity
The mtDNA results for Kelp Gulls were lower than those found in another groups of birds in which the same
cytochrome b region was analyzed. Brooke and Rowe
(1996) reported a haplotype diversity of 0.68 and nucleo-tide diversity of 0.0013 forPterodroma magentawhereas
the corresponding values for Brichyranphys perdix were 0.70 and 0.004, respectively (Friesenet al., 1996). Proud-footet al.(2006) observed a nucleotide diversity of 0.013
forGlaucidium brasilianumand Mundy et al.(1997)
re-ported a corresponding value of 0.0043 for Lanius ludovicianus. All of these indicators of diversity in seabirds or other groups were considerably higher than in Kelp Gulls, for which the haplotype diversity was 0.273 and the nucleotide diversity 0.00083. On the other hand, the haplo-type diversity (0.89) of intron 7 ofb-fibrinogenwas similar to that of seabirds such asCalidris pussillaon the northern coast of Brazil (Gonçalveset al., 2007).
The low genetic diversity observed forcytochrome b
andATPase 8and6was compatible with both demographic
and selective processes. Demographic factors include bot-tlenecks and founder effects, both of which reduce
tion size temporally and result in an increased rate of genetic drift (Galtieret al., 2000). On the other hand, the rapid fixation of a new, favorable allele through directional selection (selective sweep) can also reduce genetic variabil-ity at a locus under selection and at linked loci (Galtieret al., 2000). A reduction in genetic variability can transform an abundant species into a species with a high probability of extinction because of stochastic events such as infection by new pathogens. Nevertheless, the b-fibrinogen gene showed high diversity, indicating that the genetic variabil-ity of Kelp Gulls is not at a critical level (Table 2).
The low genetic variability at mtDNA loci and a com-paratively higher level of variation at intron 7 ofb
-fibri-nogen allowed us to formulate three hypotheses:
Hypothesis 1 – demographic events reduced the genetic di-versity of both mitochondrial and nuclear genes, but the dif-ference in effective size between these molecules preserved greater diversity at the nuclear gene, Hypothesis 2 – the re-cent demographic expansion ofL. dominicanuscan explain the low genetic diversity in mtDNA while the high diver-sity in intron 7 ofb-fibrinogenreflects ancestral polymor-phism; these findings reflect differences in the effective population size for these markers and the divergence time of the species, and Hypothesis 3 – mitochondrial DNA fromL. dominicanusexperienced a selective sweep that re-duced its variability.
Hypothesis 1 could be the outcome of founder events or bottleneck events on the Brazilian coast. Recent coloni-zation can lead to reduced genetic diversity since all indi-viduals are descendants of a small founder group (Hartl and Clarck, 1989). If populations on the Brazilian coast are the result of recent colonization then this may have involved specimens from the Pacific coast of South America, the southeast Atlantic Ocean, South Africa or Australia. Re-gardless of the origin of these populations, this species would use the sub-Antarctic islands and Antarctic
Penin-sula as a route to migrate to the Brazilian coast. Considering this route of migration, the colonies on the Atlantic coast of South America would be expected to show differentiation in a south-north direction. However, as shown here, there was low genetic differentiation in mitochondrial markers such as cytochrome b when compared with populations from Australia, New Zealand and Kerguelen Island. Over-all, the low genetic variability of the Brazilian populations compared with other colonies in the Southern Hemisphere was not consistent with the hypothesis that the colonization of this region involved founder events. On the other hand, intron 7 ofb-fibrinogen showed a cline of differentiation between the Antarctic and Brazilian coast (Table 4), indi-cating that this hypothesis cannot be discarded; however, its acceptance would require an analysis of samples from the Pacific and other sub-Antarctic islands.
A second possible demographic event that may have occurred inL. dominicanusis the loss of genetic diversity as a result of bottlenecks in the last glaciations. Pleistocene glaciers promoted changes in sea temperature, currents and other physiochemical characteristics that may have af-fected the population history of tropical birds (Peck and Congdon, 2004). Glacial cycles in the Pleistocene that were associated with ecological changes affected the dynamics of gull populations in the Northern Hemisphere (Lieberset al., 2001). Oscillations in sea levels and changes in ecologi-cal factors in response to glacial cycles may have reduced the size of the Kelp Gull population. This reduction may have led to the loss of genetic variability through succes-sive reduction and expansion of the population. Sea levels are known to have oscillated during the Quaternary gla-ciations (Bigarela, 1965). On the Brazilian coast, the sea level was up to 10 meters above its current level (Suguio, 2004) and there is evidence that regressions of approxi-mately 100 meters below the current level occurred in the Pleistocene (Bigarela, 1965). Such fluctuations may have altered the breeding sites for this species. However, the in-fluence of sea level fluctuations on the genetic diversity of seabirds with a wide distribution and high capacity for dis-persion remains unclear.
As shown here, Tajima’s D value and Fu and Li’s D* and F* values and the R2 neutrality tests for intron 7 of
b-fibrinogenshowed no signs of the population expansion that would be expected in the case of a recent bottleneck followed by expansion. Fu and Li’s D* and F* values and the R2statistic are more sensitive indicators of range expan-sion when compared to Tajima’s D value (Ramos-Onsins and Rozas, 2002). R2is more effective when testing small sample sizes, but these tests did not detect any sign of ex-pansion in Kelp Gull. These results were corroborated by mismatch distribution that showed no sign of population expansion, with a multimodal distribution consistent with a population in demographic equilibrium (Excoffier et al., 1992). However, ecological data suggest that Kelp Gulls have increased at a rate of 50% per year (Dantas and
Figure 6- Bayesian skyline plot for intron 7 sequences ofb-fibrinogen
Morgante, 2010) and the Bayesian Skyline plot clearly showed the expansion ofL. dominicanusfrom 10,000 years ago up to the present-day, but no sign of bottleneck events (Figure 6). The conditions that prevailed after the last glaciations probably favored the expansion of L.
dominicanuson the Brazilian coast. Although the summary
statistics of the data for intron 7 ofb-fibrinogenwere con-sistent with a population in equilibrium, the ecological data and Bayesian analysis indicated expansion of the popula-tion. Gonçalveset al.(2007) also observed marked genetic diversity inC. pusillaon the northern coast of Brazil based on an analysis of intron 7 ofb-fibrinogen; these authors suggested that this diversity was the result of recent growth in population size and that the populations had not experi-enced recent bottleneck events.
Based on a generation time of 10 years for Kelp Gulls and their recent origin dated at 241,201 years ago (which correspond to 24,120 generations) it seems reasonable to question whether this length of time is compatible with the absence of variation in the mtDNA locus but insufficient for splitting of the nuclear genome. The simulations showed that divergence time did not explain the low ge-netic variability observed in mtDNA whereas a recent ori-gin explained the genetic diversity seen in b-fibrinogen (Figure 5). This simple demographic scenario therefore cannot explain the low genetic diversity in mtDNA and the hypothesis of a selective sweep in mtDNA cannot be dis-carded. In addition, Bazinet al.(2006) have shown that nat-ural selection acting on mtDNA contributes to the homoge-nization of diversity. These authors affirmed that mtDNA frequently undergoes adaptive evolution involving direct selection that targets the respiratory machinery,i.e., a form of nucleo-cytoplasmic coadaptation. An investigation of other mtDNA markers is needed to confirm this hypothesis.
Population diversity
Intron 7 of theb-fibrinogen gene of the Kelp Gull showed similar variation that found in other Charadriiform seabirds. Gonçalveset al.(2007) reported a nucleotide di-versity of 0.0048 and haplotype didi-versity of 0.97 for this species whereas we estimated the corresponding values to be 0.0046 and 0.89, respectively. Our results were consis-tent with previous genetic studies of seabirds on the Brazil-ian coast (Gonçalveset al., 2007; Fariaet al., 2010) in that we observed a low genetic population structure among Kelp Gull populations (FST= 0.074) and little differentia-tion when compared with sub-Antarctic islands (Marion and King George) (Table 4). This outcome was corrobo-rated by network analysis that showed identified shared haplotypes among regions, and by the Mantel test that de-tected no significant correlation between geographic dis-tance and genetic diversity.
The low genetic structure in the Kelp Gull could re-flect the current high levels of dispersal since this species can fly hundreds of kilometers on foraging trips and the
Brazilian coast has no apparent barriers to seabird dis-persal. Marine currents are believed to play an important role in species distribution and dispersion. The Brazilian coast is influenced by a warm, nutrient-poor current that flows from north to south. In contrast, the Falklands current is cold, rich in nutrients and flows from the south up to Rio de Janeiro in the north. Consequently, all of the Kelp Gull colonies examined were influenced by the same currents. The Kelp Gull is a poorly studied species for which impor-tant ecological data and information on the migratory routes are still lacking. To understand the population dy-namics of this species it will be necessary to gather ecologi-cal and demographic information throughout the species’ distribution.
One important result of this study was that the Baye-sian skyline plot detected signs of a change in population size, with a clear expansion after the last glacial maximum and no retraction during the glacial period. This outcome is consistent with the population expansion detected based on ecological data from several sites around the world (Quin-tana and Yorio, 1998; Steele and Hockey, 1990).
Conclusions
L. dominicanushas shown population growth in
re-cent decades, with skyline plots showing a rapid increase during the last 10,000 years. Neutrality tests based on sum-mary statistics showed no deviation from a neutral equilib-rium model and there was no sign of bottleneck events. A simple demographic scenario based on the estimated time of divergence betweenL. fuscusandL. dominicanusdid not explain the low genetic diversity found in mtDNA. In addi-tion, the genetic diversity found in the nuclear gene agreed with the expected neutrality, especially considering that the divergence between the L. fuscus complex and L.
dominicanusoccurred 241,201 years ago. Based on these
findings, we cannot discard a selective sweep hypothesis for mtDNA, although a recent origin followed by rapid ex-pansion of this species after the last glacial period is the most likely scenario.
Acknowledgments
References
Austin JJ, Whoite RWG and Ovenden JR (1994) Population-genetic structure of phylopatric colonially nesting seabirds, the Short-tailed Shearwater (Puffinus tenuirostris). Auk 11:70-79.
Avise JC, Nelson WS, Bowen BW and Walker D (2000) Phylo-geography of colonially nesting seabirds, with special refer-ence to global matrilineal patterns in the Sooty tern (Sterna fuscata). Mol Ecol 9:1783-1892.
Ballard JWO and Whitlock MC (2004) The incomplete natural history of mitochondria. Mol Ecol 13:729-744.
Bandelt H-J, Forster P and Röhl A (1999) Median-joining net-works for inferring intraspecific phylogenies. Mol Biol Evol 16:37-48.
Bazin E, Glemin S and Galtier N (2006) Population size does not influence mitochondrial genetic diversity in animals. Sci-ence 312:570-572.
Bigarela JJ (1965) Subsídios para estudos da variação do nível oceânico no Quarternário brasileiro. Ann Acad Bras Ciênc 37:263-278.
Bridge ES, Jones AW and Baker AJ (2005) A phylogenetic frame-work for the terns (Sternini) inferred from mtDNA se-quences: Implications for taxonomy and plumage evolution. Mol Phylogenet Evol 35:459-469.
Brooke MDL and Rowe G (1996) Behavioural and molecular evi-dence for specific status of light and dark morphs of the Her-ald PetrelPterodroma heraldica. Ibis 138:420-432. Brown LM, Ramey IIRR, Tamburini B and Gavin TA (2004)
Pop-ulation structure and mitochondrial DNA variation in seden-tary Neotropical birds isolated by forest fragmentation. Con-serv Genet 5:743-755.
Burger J and Gochfeld M (1996) Laridae. In: del Hoyo JA and Elliott SJ (eds) Handbook of the Birds of the World. Volume 3. Hoatzin to Auks. Lynx Ediciones, Barcelona, 821 pp. Congdon BC, Piatt HF, Martin K and Friesen VL (2000)
Mecha-nisms of population differentiation in Marbled Murrelets: Historical versus contemporary processes. Evolution 54:974-986.
Crochet PA and Desmarais E (2000) Slow rate of evolution in the mitochondrial control region of gulls (Aves, Laridae). Mol Biol Evol 17:1797-1806.
Crochet PA, Chen JZ, Pons JM, Lebreton JD, Hebert PDN and Bonhomme F (2003) Genetic differentiation at nuclear and mitochondrial loci among Large White-Headed Gulls: Sex-biased interspecific gene flow? Evolution 57:2865-2878. Dantas GPM and Morgante JS (2010) Breeding biology of Kelp
Gull on the Brazilian coast. Wilson J Ornithol 122:39-45. Desjardin P and Morais R (1990) Sequence and gene organization
of the chicken mitochondrial genome: A novel gene order in higher vertebrates. J Mol Biol 212:599-634.
Drummond AJ and Rambaut A (2007) BEAST: Bayesian evolu-tionary analysis by sampling trees. BMC Evol Biol 7:214. Drummond AJ, Rambaut A, Shapiro B and Pybus OG (2005)
Bayesian coalescent inference of past population dynamics from molecular sequences. Mol Biol Evol 22:1185-1192. Excoffier L, Smouse PE and Quattro JM (1992) Analysis of
mo-lecular variance inferred from metric distances among DNA haplotypes: Application to human mitochondrial DNA re-striction data. Genetics 131:479-491.
Faria PJ, Baus E, Morgante JS and Bruford MW (2007) Chal-lenges and prospects of population genetics studies in terns
(Sternidae, Charadriiformes, Aves). Genet Mol Biol 30:681-689.
Faria PJ, Campos FP, Branco JO, Musso CM, Morgante JS and Bruford MW (2010) Population structure in the South Ame-rican ternSterna hirundinaceain the South Atlantic: Two populations with distinct breeding phenologies. J Avian Biol 41:378-387.
Friesen VL, Piatt JF and Baker AJ (1996) Evidence from cyto-chrome b sequences and allozymes for a “new” species of alcid: The Long-billed Murrelet (Brachyramphus perdix). Condor 98:681-690.
Fu Y-X and Li WH (1993) Statistical tests of neutrality of muta-tions. Genetics 133:693-709.
Galtier N, Depaulis F and Barton NH (2000) Detecting bottle-necks and selective sweep from DNA sequence polymor-phism. Genetics 155:981-987.
Genovart ML, Oro D and Bonhomme F (2003) Genetic and mor-phological differentiation between two largest breeding col-onies of Audouin’s GullLarus audouinii. Ibis 145:448-456. Given AD, Mills JA and Baker AJ (2005) Molecular evidence for
recent radiation in southern hemisphere Masked Gull. Auk 122:268-279.
Godinho R, Mendonça B, Crespo EG and Ferrand N (2006) Gene-alogy of the nuclearb-fibrinogen locus in a highly structured lizard species: Comparison with mtDNA and evidence for intragenic recombination in the hybrid zone. Heredity 96:454-463.
Gonçalves EC, Rodrigues AAF, Ferrari SF, Silva A and Schnei-der MPC (2007) Molecular evolution ofb-fibrinogen intron 7 applied to the population genetics of the Semilpalmated Sandpiper (Calidris pusilla) on the northern coast of Brazil. Rev Bras Orn. 15:253-260.
Hall TA (2001) BioEdit: A user-friendly biological sequence alignment editor and analysis program for Windows 95/98/NT. Nucleic Acids Symp Ser 41:95-98.
Hare MP, Cipriano F and Palumbi SR (2002) Genetic evidence on the demography of speciation in allopatric dolphin species. Evolution 56:804-816.
Hartl DL and Clarck AG (1989) Principles of Population Genet-ics. Sinauer Associates, Sunderland, 682 pp.
Helbig AJ and Seibold J (1999) Molecular phylogeny of Palear-tic-African Acrocephalus and Hippolis warblers (Aves, Sylviidae). Mol Phylogenet Evol 11:246-260.
Johnson KP and Clayton DH (2000) Nuclear and mitochondrial genes contain similar phylogenetic signal for pigeons and doves (Aves, Columbiformes). Mol Phylogenet Evol 14:141-151.
Laval G and Excoffier L (2004) SIMCOAL ver. 2.0: A program to simulate genomic diversity over larger recombination re-gions in a subdivided population with a complex history. Bioinformatics 20:2485-2487.
Librado P and Rozas J (2009) DnaSP ver. 5: A software for com-prehensive analysis of DNA polymorphism data. Bioin-formatics 25:1451-1452.
Liebers D, Helbig AJ and De Kniff P (2001) Genetic differentia-tion and phylogeography of gulls in theLarus cachinnans-fuscusgroup (Aves, Charadriiformes). Mol Ecol 10:2447-2462.
Martin DP, Williamson C and Posada D (2005) RDP2: Recombi-nation detection and analysis from sequence alignments. Bioinformatics 21:260-262.
Melo-Ferreira J, Alves PC, Freitas H, Ferrand N and Boursot P (2009) The genomic legacy from the extinctLepus timidus
to the three hare species of Iberia: Contrast between mtDNA, sex chromosomes and autosomes. Mol Ecol 18:2643-2658.
Mundy NI, Winchell CS and Woodruff DS (1997) Genetic differ-ences between the endangered San Clemente Island Logger-head Shrike Lanius ludovvicianus mearnsiani and two neighbouring subspecies demonstrated by mtDNA control region and cytochrome b sequence variation. Mol Ecol 6:29-37.
Paton TA, Baker AJ, Groth JG and Barrowclough GF (2003) RAG-1 sequences resolve phylogenetic relationships within Charadrii-form birds. Mol Phylogenet Evol 29:268-278. Peck DR and Congdon BC (2004) Reconciling historical
pro-cesses and population structure in the Sooty tern Sterna fuscata. J Avian Biol 35:327-335.
Pons JM, Crochet PA, Thery M and Bermejo A (2004) Geograph-ical variation in the Yellow-legged gull: Introgression or convergence from the Herring gull? J Zool Syst Evol Res 42:245-256.
Pons JM, Hassanin A and Crochet PA (2005) Phylogenetic rela-tionships within the Laridae (Charadriiformes, Aves) in-ferred from mitochondrial markers. Mol Phylogenet Evol 37:686-699.
Posada D and Cradall KA (1998) Modeltest: Testing the model of DNA substitution. Bioinformatics 14:817-818.
Proudfoot GA, Honeycutt RL and Slack DR (2006) Mitochondrial DNA variation and phylogeography of the ferruginous pygmy-owl (Glaucidium brasilianum). Conserv Genet 7:1-12.
Prychitko TM and Moore WS (2000) Comparative evolution of the mitochondrial cytochrome b gene and nuclear
b-fibrinogen intron 7 in woodpeckers (Aves, Picidae). Mol Phylogenet Evol 8:193-204.
Quintana F and Yorio P (1998) Competition for nest sites between Kelp Gull (Larus dominicanus) and terns (Sterna maxima
andS. eurygnatha) in Patagonia. Auk 115:1068-1071. Ramos-Onsins SE and Rozas J (2002) Statistical properties of
new neutrality tests against population growth. Mol Biol Evol 19:2092-2100.
Rogers AR and Harpending H (1992) Population growth makes waves in the distribution of pairwise genetic differences. Mol Biol Evol 9:552-569.
Rowntree VJ, MacGuinness P, Marshall K, Payne R, Sirone M and Seger J (1998) Increased harassment of Right Whales (Eubalena australis) by Kelp Gull (Larus dominicanus) at Peninsula Váldez, Argentina. Mar Mammal Sci 14:99-115. Sambrook KJ, Russel DW and Sambrook J (2001) Molecular
Cloning: A Laboratory Manual. Cold Spring Harbor Labo-ratory Press, New York.
Shields GF and Wilson AC (1987) Calibration of mitochondrial evolution in geese. J Mol Evol 24:212-217.
Sorenson MD, Ast JC, Dimcheff DE, Yuri T and Mindell DP (1999) Primers for a PCR-based approach to mitochondrial genome sequencing in birds and other vertebrates. Mol Phylogenet Evol 12:105-114.
Steele WK and Hockey PAR (1990) Population size, distribution and dispersal of Kelp Gulls in the Southwestern Cape, South Africa. Ostrich 61:97-106.
Stephens M, Smith NJ and Donnelly P (2001) A new statistical method for haplotype reconstruction from population data. Am J Hum Genet 73:1162-1169.
Suguio K (2004) O papel das variações do nível relativo do mar durante o Quaternário tardio na origem da baixada litoranea da Juréia, SP. In: Otavio AV and Marques WD (eds) Estação Ecológica Juréia-Itatins: Ambiente Físico, Flora e Fauna. Holos, Ribeirão Preto, pp 33-41.
Swofford DL (2000) PAUP, Phylogenetic analysis using parsi-mony and other methods. Sinauer Associates, Sunderland, 142 pp.
Tajima F (1989) Statistical method for testing the neutral mutation hypothesis by DNA polymorphism. Genetics 123:585-595. Tamura K (1992) Estimation of the number of nucleotide
substitu-tions when there are strong transition-transversion and G+C content biases. Mol Biol Evol 9:678-687.
Thomas PO (1988) Kelp Gulls,Larus dominicanus, are parasites on flesh of the Right Whale,Eubalaena australis. Ethology 79:89-103.
Zhang X and Hewitt GM (2003) Nuclear DNA analyses in genetic studies of populations: Practice, problems and prospects. Mol Ecol 12:563-584.
Zink RM and Barrowclough GF (2008) Mitochondrial DNA un-der siege in avian phylogeography. Mol Ecol 17:2107-2121.
Internet Resources
NETWORK ver. 4.1.0.8, http://www.flux-us-engineering.com/sharepub.htm#a1 (December 26, 2011).
Mantel test, http://life.bio.sunysb.edu/morph/soft-mult.html (De-cember 26, 2011).
Supplementary Material
The following online material is available for this ar-ticle:
Table S1 - List of the 105 taxa of the genusLarusused in the phylogenetic analysis. The genusRissawas used to root the tree. The accession numbers are from GenBank.
This material is available as part of the online article from http://www.scielo.br/gmb.
Associate Editor: Fabricio Santos
The accession numbers are from GenBank.
AB208758.1| Larus canus
AB208757.1| Larus canus
AB208756.1| Larus canus
AB208754.1| Larus crassirostris
AB208753.1| Larus crassirostris
EF513630.1| Larus argentatus
EF513629.1| Larus argentatus
EF513628.1| Larus argentatus
EF513627.1| Larus argentatus
EF513626.1| Larus cachinnans
EF513625.1| Larus argentatus
EF513624.1| Larus cachinnan
EF513623.1| Larus cachinnans
EF373138.1| Larus marinus
AY964952.1| Larus hemprichii
AY964949.1| Larus relictus
AY964948.1| Larus saundersi
AY964947.1| Larus maculipennis
AY964946.1| Larus bulleri
AY964945.1| Larus novaehollandiae
AY964944.1| Larus hartlaubii
AY964943.1| Larus brunnicephalus
AY964942.1| Larus armenicus
AY964941.1| Larus cachinnan
AY964940.1| Larus glaucescens
AY964939.1| Larus leucophthalmus
AY964938.1| Larus modestus
AY964937.1| Larus crassirostris
AY964936.1| Larus atlanticus
AY964935.1| Larus belcheri
AY964934.1| Larus pacificus
AY615706.1| Larus thayeri
AY615705.1| Larus thayeri
AY615704.1| Larus thayeri
AY615703.1| Larus glaucescens
AY615702.1| Larus glaucescens
AY615701.1| Larus glaucescens
AY615697.1| Larus occidentalis wymani
AY615696.1| Larus occidentalis occidentalis
AY615695.1| Larus occidentalis occidentalis
AY615694.1| Larus occidentalis occidentalis
AJ508148.1| Larus schistisagus
AJ508147.1| Larus occidentalis
AJ508145.1| Larus michahellis
AJ508144.1| Larus michahellis
AJ508091.1| Larus argentatus
AJ508092.1| Larus argentatus argenteus
AJ508094.1| Larus argentatus argenteus
AJ508095.1| Larus argentatus argenteus
AJ508096.1| Larus argentatus argenteus
AJ508097.1| Larus argentatus argenteus
AJ508098.1| Larus argentatus argenteus
AJ508099.1| Larus argentatus argenteus
AJ508100.1| Larus argentatus argenteus
AJ508103.1| Larus argentatus smithsonianus
AJ508104.1| Larus argentatus smithsonianus
AJ508122.1| Larus fuscus fuscus
AJ508105.1| Larus argentatus smithsonianus
AJ508106.1| Larus argentatus smithsonianus
AJ508107.1| Larus argentatus smithsonianus
AJ508108.1| Larus argentatus smithsonianus
AJ508109.1| Larus argentatus smithsonianus
AJ508110.1| Larus armenicus
AJ508111.1| Larus cachinnans barabensis
AJ508112.1| Larus cachinnans barabensis
AJ508113.1| Larus cachinnans barabensis
AJ508114.1| Larus cachinnans
AJ508115.1| Larus cachinnans
AJ508116.1| Larus cachinnans
AJ508117.1| Larus cachinnans
AJ508118.1| Larus cachinnans
AJ508119.1| Larus cachinnans
AJ508120.1| Larus cachinnans
AJ508121.1| Larus dominicanus
AJ508140.1| Larus marinus
AJ508138.1| Larus hyperboreus
AJ508123.1| Larus fuscus fuscus
AJ508124.1| Larus fuscus fuscus
AJ508125.1| Larus fuscus graellsii
AJ508126.1| Larus fuscus graellsii
AJ508128.1| Larus fuscus graellsii
AJ508129.1| Larus fuscus graellsii
AJ508130.1| Larus fuscus heuglini
AJ508131.1| Larus fuscus intermedius
AJ508139.1| Larus hyperboreus
AJ508136.1| Larus hyperboreus
AJ508135.1| Larus hyperboreus
AJ508137.1| Larus hyperboreus
AJ508134.1| Larus glaucoides
AJ508133.1| Larus glaucoide
AJ508132.1| Larus fuscus taimyrensis
AJ508127.1| Larus fuscus graellsii
Nc006007 | Larus dominicanus
AY293619| Larus dominicanus
AJ508121| Larus dominicanus
AF268497| Larus dominicanus
AF 444259| Larus dominicanus
DQ385229| Rissa tridactyla