Short-tandem repeat analysis in seven Chinese regional populations
Xing-bo Song1, Yi Zhou1, Bin-wu Ying1, Lan-lan Wang1, Yi-song Li1, Jian-feng Liu2, Xiao-gang Bai3, Lei Zhang1, Xiao-jun Lu1, Jun Wang1and Yuan-xin Ye1
1Department of Laboratory Medicine, West China Hospital, Sichuan University, Chengdu, Sichuan,
P.R. China.
2
The Police Station of Wenzhou, Wenzhou, Zhejiang, P.R. China.
3
The Police Station of Chengdu, Chengdu, Sichuan, P.R. China.
Abstract
In the present study, we investigated the application of 13 short tandem repeat (STR) loci (D13S317, D7S820, TH01, D16S539, CSFIPO, VWA, D8S1179, TPOX, FGA, D3S1358, D21S11, D18S51 and D5S818) routinely used in fo-rensic analysis, for delineating population relationships among seven human populations representing the two major geographic groups, namely the southern and northern Chinese. The resulting single topology revealed pronounced geographic and population partitioning, consistent with the differences in geographic location, languages and eating habits. These findings suggest that forensic STR loci might be particularly powerful tools in providing the necessary fine resolution for reconstructing recent human evolutionary history.
Key words:forensic medicine, population genetics, short-tandem repeat, human evolutionary history, genetic distance.
Received: October 19, 2009; Accepted: June 11, 2010.
Introduction
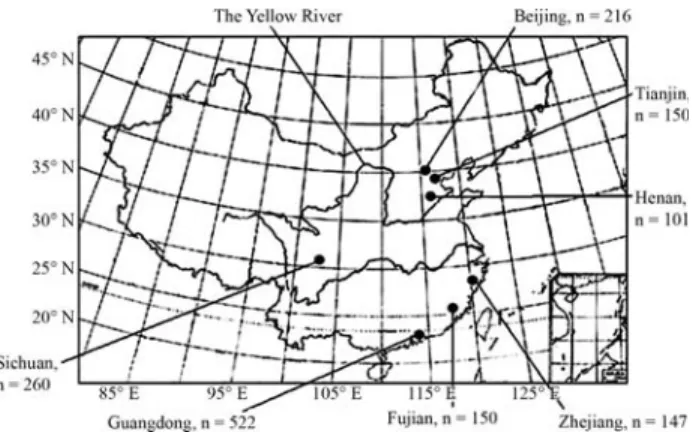
The present Chinese population of around 1.4 billion is primarily divided by the Yellow River into two large groups, the southern and the northern, with diverse lan-guages and eating habits. There is thus an immense scope to study the processes of anthropological subdivisions and microevolutionary effects in different populations groups of China. However, the traditional structure of Chinese populations is facing the imminent threat of disintegration through urbanization and increasing communication, with the consequential gene flow between subcastes through marriages. Therefore, there is a need for understanding lo-cal traditional population structure and its role in shaping human genome diversity.
A large-scale survey of autosomal variation in an am-ple geographic samam-ple of human Asian populations has shown that, apart from geography, genetic ancestry is strongly correlated with linguistic affiliations (The HUGO Pan-Asian SNP Consortium 2009). A distinction between northern and southern Chinese populations (Han and mi-nority alike) has been observed on analyzing genetic mark-ers (Zhao and Lee, 1989; Chuet al., 1998). Short tandem repeat (STR) loci are highly polymorphic loci in the human genome, are relatively small in size, and can be analyzed in a multiplex PCR fashion. Many population genetic studies
have investigated the polymorphism profile of the STR sys-tem in Chinese Han populations, this including the loci D13S317, D7S820, TH01, D16S539, CSFIPO, VWA, D8S1179, TPOX, FGA, D3S1358, D21S11, D18S51 and D5S818 (Caiet al., 2005; Denget al., 2007). In the present study, these 13 STR loci in seven Chinese regional popula-tions, comprising 3 northern, (Henan, Beijing and Tianjin) and 4 southern (Sichuan, Fujian Guangdong, and Zhejiang), were analyzed by way of capillary electrophore-sis on 3100 genetic analyzers.
Based on the population data of these STR poly-morphisms, the forensic parameters of the respective loci were calculated in order to estimate their value in genetic identity testing. Furthermore, genomic affinities among the diverse regional population groups were evaluated. The current study contributed to supplementing the ever-increasing population-information database worldwide.
Materials and Methods
Sample preparation
Whole blood was obtained by venipuncture in EDTA-coated vaccutainers from unrelated, consenting do-nors. Community history and family disease backgrounds were recorded on blood donor cards.
Seven geographically targeted populations, encom-passing the major biogeographical zones and representing the two main Han populations (southern and northern),
Genetics and Molecular Biology, 33, 4, 605-609 (2010)
Copyright © 2010, Sociedade Brasileira de Genética. Printed in Brazil www.sbg.org.br
were selected. These included 4 southern, the Sichuan (n = 260, Yinget al., 2005), Fujian (n = 150), Guangdong (n = 522) and Zhejiang (n = 147), and 3 northern, the Henan (n = 101), Tianjin (n = 150) and Beijing (n = 216). Their re-spective location is shown in Figure 1
DNA was extracted using the Chelex method (Walsh
et al., 1991).
PCR amplification
PCR amplification was carried out on a thermal cy-cler, using primers with the same sequences as those in the “PowerPlex 16 System” kit (Krenke et al., 2002). Each PCR reaction was performed with 2.5mL of template DNA
(5-250 ng), 0.5mM of each primer, 2.5mL ofTaq buffer
(10PCR Buffer, Applied Biosystems), 2 mL of MgCL2 (25 mM, Applied Biosystems), 0.5 mL of a dNTPs mix
(10mM PCR nucleotide Mix, Promega), and 1U Taq
poly-merase (DyNAzyme, DNA Polypoly-merase, Finnzymes) in a total volume of 25mL. A total of 30 cycles were run, with
an initial incubation (preliminary denaturation) step at 96° C for 2 min, followed by 10 cycles of 94 °C for 1 min, 60 °C for 1 min and 70 °C for 1.5 min, followed by 20 cy-cles of 90 °C for 1 min, 60 °C for 1 min and 70 °C for 1.5 min, ending with a final extension at 60 °C for 30 min.
Electrophoresis and analysis
The PCR product (1.5 mL), as well as
GeneScan-400HD-ROX Size Standard (Applied Biosystems) (0.5mL), were added to 24.5mL of deionized formamide,
and subsequently denatured for 3 min at 95 °C. Alleles were then separated by capillary electrophoresis in POP-4 polymer (Applied Biosystems) with the GS STR POP4 D Module (1 mL), using an ABI PRISM 3100 Genetic Ana-lyzer (Applied Biosystems). Samples were injected into the capillaries in batches of 16 samples, directly from the microtitre plate, for 10 s at 3 kV. Electrophoresis was per-formed at 15 kV and 60 °C for 45 min under routine running conditions. Alleles were identified by means of GeneScan Analysis 3.7 Software (Applied Biosystems), whereupon the analyzed data were automatically genotyped using
Genotyper 3.6 Software (Applied Biosystems) and a tem-plate specially made for this specific multiplex system. The Peak Amplitude Threshold adopted was more than 150 RFU (relative fluorescence units).
Statistical analysis
Individual locus frequency was calculated from the number of each genotype in the sample set. Unbiased esti-mates of expected heterozygosity were computed as de-scribed by Edwardset al.(1992). Possible divergence from Hardy-Weinberg equilibrium (HWE) was determined by calculating an unbiased estimate of expected homozy-gote/heterozygote frequencies (Nei and Roychoudhury, 1974; Chakrabortyet al., 1988; ), through likelihood-ratio testing (Weir, 1992; Buscemiet al., 1995). The Chi-square test was applied for comparing the genotype and allelic fre-quency of each STR locus among the studied populations. We also calculated certain parameters of genetic and foren-sic interest,i.e., the power of discrimination (Grunbaumet al., 1978), the chance of exclusion (Ohno et al., 1982), polymorphism information content (PIC) (Botsteinet al., 1980) and heterozygosity. Distance was estimated using the Nei formula (Nei and Roychoudhury, 1972; Li and Nei, 1977), whereas phylogeny was inferred by UPGMA and Neighbor-Joining methods in Mega 2.1.
Results
Polymorphisms of 13 STR loci in seven Chinese Han populations
Details on polymorphism exhibited at the 13 loci with respect to the allele frequencies in the seven Chinese popu-lations are listed in Tables S1-S13.
Despite the wide range of allelic variation in the 13 STR loci, a discernable pattern depicting mutual geo-graphical affiliation is apparent. Generally speaking, fre-quency was high in only few alleles (e.g., allele 9 of TH01, allele 14 of VWA, allele 14 of D16S539, allele 30 of D21S11, and allele 10 of TPOX) (Tables S1-S13). 13 STR loci among seven Chinese populations showed similar trends Furthermore, both genotype and allele distribution were not significantly different among the seven Chinese populations (p > 0.05). These results are thought to reflect the influence of gene flow due to geographic proximity.
Phenotype distribution and value in forensic application
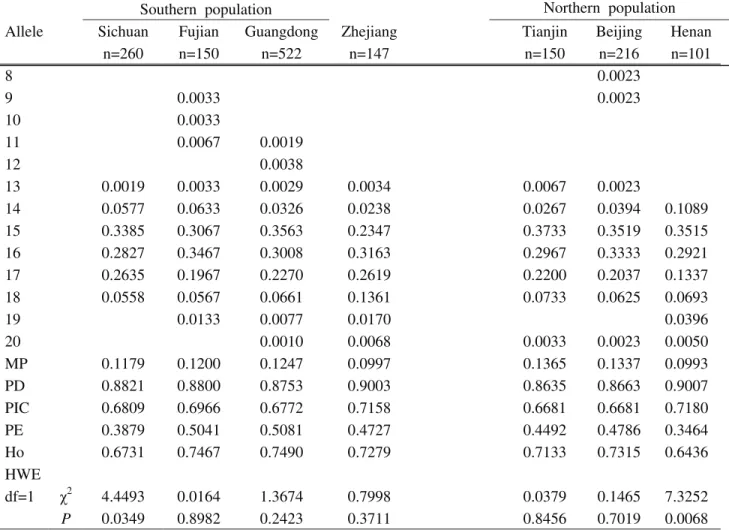
The distribution of observed allele frequencies in the 13 loci (D13S317, D7S820, TH01, D16S539, CSFIPO, VWA, D8S1179, TPOX, FGA, D3S1358, D21S11, D18S51, D5S818), as well as the results from the various analytical procedures for testing the correspondence of ge-notype frequencies with Hardy-Weinberg equilibrium, are shown in Tables S1-S13.
606 Songet al.
All the 13 loci complied with Hardy-Weinberg equi-librium, with no evidence of association of alleles among the 13 loci. The parameters for both forensic efficiency and genetic variability, such as MP, PD, PIC, PE and hetero-zygosity, were calculated and subsequently listed for each population in the supplementary tables.
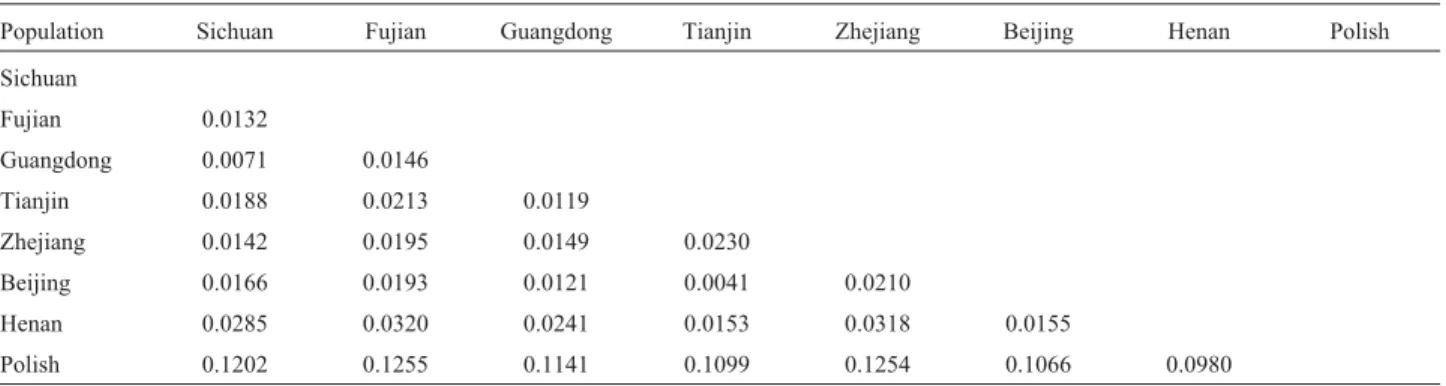
Analysis of genetic distances
In order to ascertain relationships among the seven Chinese populations, we have calculated the Nei measure of pairwise genetic distances using allele frequency data from the 13 STR markers. Polish population data (Pepinski
et al., 2005) was included in the analysis as outgroup refer-ence.
The longest distance (0.0320) was noted between the Fujian (a southern) and Henan (a northern) populations, whereas the lowest (0.0041) was observed between Beijing (a northern) and Tianjin (also a northern) populations (Ta-ble 1).
Based on genetic distance data, population trees were constructed using the UPGMA and Neighbor-Joining methods. As both methods revealed the same pattern, UPGMA results were preferred for display. Bootstrap val-ues for the trees were high (Figure 2). The Sichuan (south-ern) and the Guangdong (also south(south-ern) populations first clustered together with a high bootstrap value (97%), to then cluster with the other two southern populations, the Zhejiang and Fujian, with bootstrap values of 94%. The three northern populations (Beijing, Tianjin and Henan) formed a single cluster with bootstrap values of 95%. The two major populations (the northern and southern) clus-tered together with bootstrap values of 98%. As expected, on comparing the Polish population, as outgroup control, with any pair of the Chinese populations, the distance was greater.
Discussion
Owing to the several advantages, such as high poly-morphism, ease and low-cost, STR markers have been widely used for fine-scale genetic mapping (Edwardset al., 1991, 1992; Hearneet al., 1992), intra-species
phylogen-etic reconstruction (Bowcock et al., 1994; Jorde et al., 1998), maternity/paternity determination (Hammondet al., 1994), and forensic analysis (Edwardset al., 1991; Hearne
et al., 1992). Consistent with previous studies (Caiet al., 2005; Denget al., 2007; Yinget al., 2005, 2006), all the 13 STR loci were highly polymorphic in the seven population samples and exhibited desirable values in the forensic anal-ysis and genetic analanal-ysis.
Over the past decades, and based on STR polymor-phisms, important information has contributed to elucidat-ing the history of human populations (Jordeet al., 1997; Shriveret al., 1997), as well as genetic microdifferentiation among local subdivided populations (Reddyet al., 2001). In the current study, seven Chinese Han populations, with three representative groups from the northern portion and four from the southern, were investigated, by comparing the allele frequency of 13 STR loci, whereby the following consequential information was obtained. First, the 13 loci exhibited high polymorphism in all the seven populations, but with no significant difference in allele distribution in any. It was inferred that both geographical and ethnic affili-ations in Chinese Han populaffili-ations are close. A single STR-based comparison of the population was insufficient to detect the delicate mutual difference among these popu-lations. A method integrating polymorphic information on all the 13 STR loci of each population is essential for deter-mining respective genetic distances. In addition, the spe-cific parameters revealed the high forensic efficiency of the 13 STR loci. Heterozygosity among these ranged from
STR polymorphisms in China 607
Table 1- Genetic distances of 8 populations using UPGMA software.
Population Sichuan Fujian Guangdong Tianjin Zhejiang Beijing Henan Polish Sichuan
Fujian 0.0132
Guangdong 0.0071 0.0146
Tianjin 0.0188 0.0213 0.0119
Zhejiang 0.0142 0.0195 0.0149 0.0230
Beijing 0.0166 0.0193 0.0121 0.0041 0.0210
Henan 0.0285 0.0320 0.0241 0.0153 0.0318 0.0155
Polish 0.1202 0.1255 0.1141 0.1099 0.1254 0.1066 0.0980
0.5248 (TPOX in the Henan population) to 0.8989 (D8S1179 in the Zhejiang), whereas the number of alleles observed ranged from 8 (TPOX) to 20 (D18S51). The data presented herein will facilitate calculating matching proba-bilities in forensic casework, in the event of Chinese indi-viduals being considered as the source of DNA evidence. Furthermore, by using the UPGMA and Neighbor-Joining methods, it was possible to calculate genetic distances on the basis of data from all the 13 STR locus polymorphisms in each population, whereby a population tree was con-structed to reflect mutual evolutionary relationships. The results indicated that genetic distances among these popu-lations correspond to their geographic location, Whereas three northern populations formed one cluster, the four southern ones formed another cluster, as confirmed through UPGMA and Neighbor-Joining methodology. Although the distances among the studied populations were only short, clustering remained distinct in certain groups, this being consistent with their ethnohistory and geographic lo-cation. Compared to the outgroup control (Polish popula-tion), Chinese southern and northern populations clustered together. While clustering tended to occur between two populations with smallest geographic distance, it was nota-ble that the Guangdong population first clustered with that of Sichuan, instead of doing so with the two geographically nearer populations of Fujian and Zhejiang, thereby provid-ing evidence for historical records that the earliest Sichuan population most likely emigrated from Guangdong.
Acknowledgments
We thank Dr. Junping Xin (Loyola University Medi-cal Center) for critiMedi-cal review and editorial assistance dur-ing manuscript revision. This study was supported by Grants #30900658 from the National Natural Science Foundation of China.
References
Botstein D, White RL, Scolnick M and Davis RW (1980) Con-struction of a genetic linkage map in man using restriction fragment length polymorphisms. Am J Hum Genet 32:314-331.
Bowcock AM, Ruiz-Linares A, Tomfohrde J, Minch E, Kidd JR and Cavalli-Sforza LL (1994) High resolution of human evolutionary trees with polymorphic microsatellites. Nature 368:455-457.
Buscemi L, Cucurachi N, Mencarelli R, Tagliabracci A, Wiegand P and Ferrara SD (1995) PCR analysis of the short tandem repeat (STR) system HUMVWA31. Allele and genotype frequencies in an Italian population sample. Int J Legal Med 107:171-173.
Cai GQ, Chen LX, Tong DY, Ou JH and Wu XY (2005) Muta-tions of 15 short tandem repeat loci in Chinese population. Zhonghua Yi Xue Yi Chuan Xue Za Zhi 22:507-509. Chakraborty R, Smouse PE and Neel JV (1988) Population
amal-gamation and genetic variation: Observations on artificially
agglomerated tribal populations of Central and South Amer-ica. Am J Hum Genet 43:709-725.
Chu JY, Huang W, Kuang SQ, Wang JM, Xu JJ, Chu ZT, Yang ZQ, Lin KQ, Li P, Wu M,et al.(1998) Genetic relationship of populations in China. Proc Natl Acad Sci USA 95:11763-11768.
Deng YJ, Yan JW, Yu XG, Li YZ, Mu HF, Huang YQ, Shi XT and Sun WM (2007) Genetic analysis of 15 STR loci in Chi-nese Han population from West China. Genomics Proteo-mics Bioinform 5:66-69.
Edwards A, Civitello A, Hammond HA and Caskey CT (1991) DNA typing and genetic mapping with trimeric and tetra-meric tandem repeats. Am J Hum Genet 49:746-756. Edwards A, Hammond HA, Jin L, Caskey CT and Chakraborty R
(1992) Genetic variation at five trimeric and tetrameric tan-dem repeat loci in four human population groups. Genomics 12:241-253.
Grunbaum BW, Selvin S, Pace N and Black DM (1978) Fre-quency distribution and discrimination probability of twelve protein genetic variants in human blood as functions of race, sex, and age. J Forensic Sci 23:577-587.
Hammond HA, Jin L, Zhong Y, Caskey CT and Chakraborty R (1994) Evaluation of 13 short tandem repeat loci for use in personal identification applications. Am J Hum Genet 55:175-189.
Hearne CM, Ghosh S and Todd JA (1992) Microsatellites for link-age analysis of genetic traits. Trends Genet 8:288-294. Jorde LB, Bamshad M and Rogers AR (1998) Using
mitochon-drial and nuclear DNA markers to reconstruct human evolu-tion. Bioessays 20:126-136.
Jorde LB, Rogers AR, Bamshad M, Scott WW, Krakowiak P, Sung S, Kere J and Harpending HC (1997) Microsatellite di-versity and the demographic history of modern humans. Proc Natl Acad Sci USA 94:3100-3103.
Krenke BE, Tereba A, Anderson SJ, Buel E, Culhane S, Finis CJ, Tomsey CS, Zachetti JM, Masibay A, Rabbach DRet al. (2002) Validation of a 16-locus fluorescent multiplex sys-tem. J Forensic Sci 47:773-785.
Li WH and Nei M (1977) Persistence of common alleles in two re-lated populations or species. Genetics 86:901-914. Nei M and Roychoudhury AK (1972) Gene differences between
Caucasian, Negro, and Japanese populations. Science 177:434-436.
Nei M and Roychoudhury AK (1974) Sampling variances of heterozygosity and genetic distance. Genetics 76:379-390. Ohno Y, Sebetan IM and Akaishi S (1982) A simple method for
calculating the probability of excluding paternity with any number of codominant alleles. Forensic Sci Int 19:93-98. Pepinski W, Niemcunowicz-Janica A, Skawronska M, Janica J,
Koc-Zorawska E, Aleksandrowicz-Bukin M and Soltys-zewski I (2005) Genetic data on 15 STR loci in the ethnic group of Polish Tatars residing in the area of Podlasie (Northeastern Poland). Forensic Sci Int 49:263-265. Reddy BM, Pfeffer A, Crawford MH and Langstieh BT (2001)
Population substructure and patterns of quantitative varia-tion among the Gollas of southern Andhra Pradesh, India. Hum Biol 73:291-306.
Shriver MD, Jin L, Ferrell RE and Deka R (1997) Microsatellite data support an early population expansion in Africa. Ge-nome Res 7:586-591.
The HUGO Pan-Asian SNP Consortium (2009) Mapping human genetic diversity in Asia. Science 326:1541-1545.
Walsh PS, Metzger DA and Higuchi R (1991) Chelex 100 as a me-dium for simple extraction of DNA for PCR-based typing from forensic material. Biotechniques 10:506-513. Weir BS (1992) Independence of VNTR alleles defined as fixed
bins. Genetics 130:873-887.
Ying BW, Wei YG, Sun XM, Liu TT and Hou YP (2005) STR data for the AmpFlSTR profiler plus from western China. J Forensic Sci 50:716-717.
Ying BW, Fan H, Liu TT, Zhao ZH, Liang ZH, Feng S, Yuan WA and Yun LB (2006) Genetic variation for five short tandem repeat loci in a Central China population sample. J Forensic Sci 51:1201.
Zhao TM and Lee TD (1989) Gm and Km allotypes in 74 Chinese populations: A hypothesis of the origin of the Chinese na-tion. Hum Genet 83:101-110.
Supplementary Material
The following online material is available for this article:
Table S1: Genetic polymorphism at the D3S1358 lo-cus for the seven Chinese population groups.
Table S2: Genetic polymorphism at the D16S539 lo-cus for the seven Chinese population groups.
Table S3: Genetic polymorphism at the TPOX locus for the seven Chinese population groups.
Table S4: Genetic polymorphism at the TH01 locus for the seven Chinese population groups.
Table S5: Genetic polymorphism at the CSF1PO lo-cus for the seven Chinese population groups.
Table S6: Genetic polymorphism at the D7S820 locus for the seven Chinesepopulation groups.
Table S7: Genetic polymorphism at the VWA locus for the seven Chinese population groups.
Table S8: Genetic polymorphism at the FGA locus for the seven Chinese population groups.
Table S9: Genetic polymorphism at the D8S1179 lo-cus for the seven Chinese population groups.
Table S10: Genetic polymorphism at the D21S11 lo-cus for the seven Chinese population groups.
Table S11: Genetic polymorphism at the D18S51 lo-cus for the seven Chinese population groups.
Table S12: Genetic polymorphism at the D5S818 lo-cus for the seven Chinese population groups.
Table S13: Genetic polymorphism at the D13S317 lo-cus for the seven Chinese population groups.
This material is available as part of the online article from http://www.scielo.br/gmb.
Associate Editor: Francisco Mauro Salzano
License information: This is an open-access article distributed under the terms of the Creative Commons Attribution License, which permits unrestricted use, distribution, and reproduction in any medium, provided the original work is properly cited.
Table S1-Genetic polymorphism at the D3S1358 locus for the seven Chinese population groups.
Southern population Northern population
Allele Sichuan Fujian Guangdong Zhejiang Tianjin Beijing Henan
n=260 n=150 n=522 n=147 n=150 n=216 n=101
8 0.0023
9 0.0033 0.0023
10 0.0033
11 0.0067 0.0019
12 0.0038
13 0.0019 0.0033 0.0029 0.0034 0.0067 0.0023
14 0.0577 0.0633 0.0326 0.0238 0.0267 0.0394 0.1089
15 0.3385 0.3067 0.3563 0.2347 0.3733 0.3519 0.3515
16 0.2827 0.3467 0.3008 0.3163 0.2967 0.3333 0.2921
17 0.2635 0.1967 0.2270 0.2619 0.2200 0.2037 0.1337
18 0.0558 0.0567 0.0661 0.1361 0.0733 0.0625 0.0693
19 0.0133 0.0077 0.0170 0.0396
20 0.0010 0.0068 0.0033 0.0023 0.0050
MP 0.1179 0.1200 0.1247 0.0997 0.1365 0.1337 0.0993
PD 0.8821 0.8800 0.8753 0.9003 0.8635 0.8663 0.9007
PIC 0.6809 0.6966 0.6772 0.7158 0.6681 0.6681 0.7180
PE 0.3879 0.5041 0.5081 0.4727 0.4492 0.4786 0.3464
Ho 0.6731 0.7467 0.7490 0.7279 0.7133 0.7315 0.6436
HWE
df=1 χ2 4.4493 0.0164 1.3674 0.7998 0.0379 0.1465 7.3252
P 0.0349 0.8982 0.2423 0.3711 0.8456 0.7019 0.0068
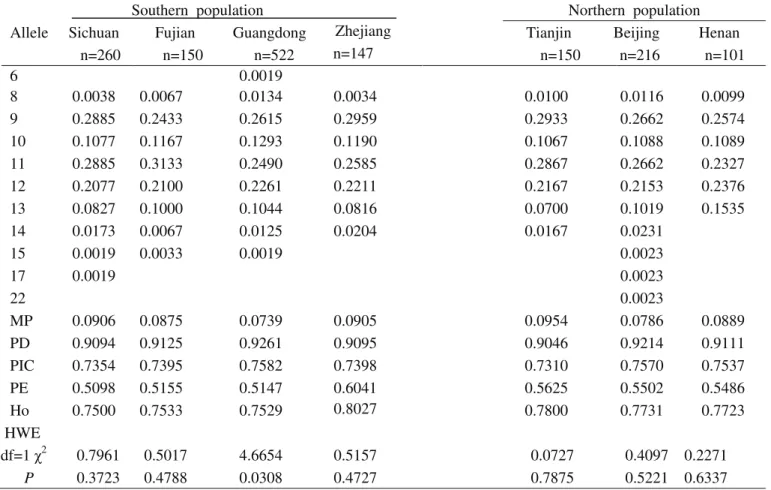
Table S2-Genetic polymorphism at the D16S539 locus for the seven Chinese population groups.
Southern population Northern population
Allele Sichuan Fujian Guangdong Zhejiang Tianjin Beijing Henan
n=260 n=150 n=522 n=147 n=150 n=216 n=101
6 0.0019
8 0.0038 0.0067 0.0134 0.0034 0.0100 0.0116 0.0099
9 0.2885 0.2433 0.2615 0.2959 0.2933 0.2662 0.2574
10 0.1077 0.1167 0.1293 0.1190 0.1067 0.1088 0.1089
11 0.2885 0.3133 0.2490 0.2585 0.2867 0.2662 0.2327
12 0.2077 0.2100 0.2261 0.2211 0.2167 0.2153 0.2376
13 0.0827 0.1000 0.1044 0.0816 0.0700 0.1019 0.1535
14 0.0173 0.0067 0.0125 0.0204 0.0167 0.0231
15 0.0019 0.0033 0.0019 0.0023
17 0.0019 0.0023
22 0.0023
MP 0.0906 0.0875 0.0739 0.0905 0.0954 0.0786 0.0889
PD 0.9094 0.9125 0.9261 0.9095 0.9046 0.9214 0.9111
PIC 0.7354 0.7395 0.7582 0.7398 0.7310 0.7570 0.7537
PE 0.5098 0.5155 0.5147 0.6041 0.5625 0.5502 0.5486
Ho 0.7500 0.7533 0.7529 0.8027 0.7800 0.7731 0.7723
HWE
df=1 χ2 0.7961 0.5017 4.6654 0.5157 0.0727 0.4097 0.2271
P 0.3723 0.4788 0.0308 0.4727 0.7875 0.5221 0.6337
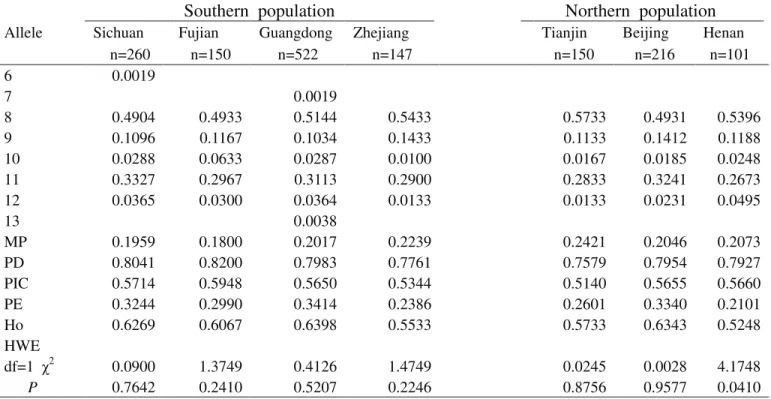
Table S3-Genetic polymorphism at the TPOX locus for the seven Chinese population groups.
Southern population
Northern population
Allele Sichuan Fujian Guangdong Zhejiang Tianjin Beijing Henan
n=260 n=150 n=522 n=147 n=150 n=216 n=101
6 0.0019
7 0.0019
8 0.4904 0.4933 0.5144 0.5433 0.5733 0.4931 0.5396
9 0.1096 0.1167 0.1034 0.1433 0.1133 0.1412 0.1188
10 0.0288 0.0633 0.0287 0.0100 0.0167 0.0185 0.0248
11 0.3327 0.2967 0.3113 0.2900 0.2833 0.3241 0.2673
12 0.0365 0.0300 0.0364 0.0133 0.0133 0.0231 0.0495
13 0.0038
MP 0.1959 0.1800 0.2017 0.2239 0.2421 0.2046 0.2073
PD 0.8041 0.8200 0.7983 0.7761 0.7579 0.7954 0.7927
PIC 0.5714 0.5948 0.5650 0.5344 0.5140 0.5655 0.5660
PE 0.3244 0.2990 0.3414 0.2386 0.2601 0.3340 0.2101
Ho 0.6269 0.6067 0.6398 0.5533 0.5733 0.6343 0.5248
HWE
df=1 χ2 0.0900 1.3749 0.4126 1.4749 0.0245 0.0028 4.1748
P 0.7642 0.2410 0.5207 0.2246 0.8756 0.9577 0.0410
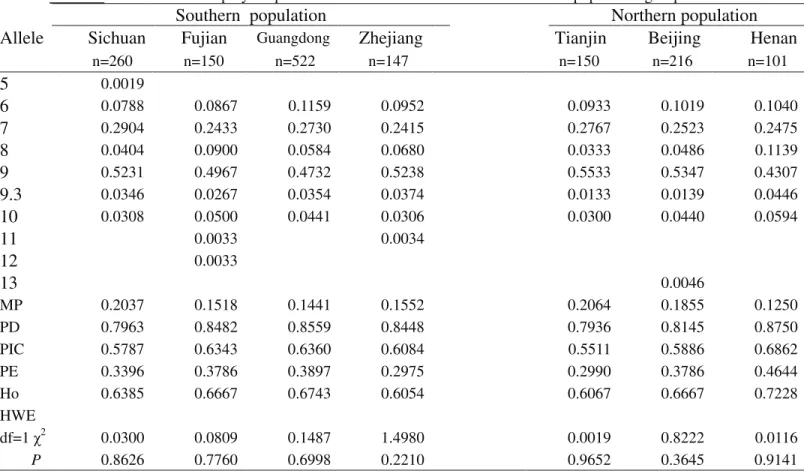
Table S4-Genetic polymorphism at the TH01 locus for the seven Chinese population groups.
Southern population
Northern population
Allele
Sichuan
Fujian
GuangdongZhejiang
Tianjin
Beijing
Henan
n=260 n=150 n=522 n=147 n=150 n=216 n=101
5
0.00196
0.0788 0.0867 0.1159 0.0952 0.0933 0.1019 0.10407
0.2904 0.2433 0.2730 0.2415 0.2767 0.2523 0.24758
0.0404 0.0900 0.0584 0.0680 0.0333 0.0486 0.11399
0.5231 0.4967 0.4732 0.5238 0.5533 0.5347 0.43079.3
0.0346 0.0267 0.0354 0.0374 0.0133 0.0139 0.044610
0.0308 0.0500 0.0441 0.0306 0.0300 0.0440 0.059411
0.0033 0.003412
0.003313
0.0046MP 0.2037 0.1518 0.1441 0.1552 0.2064 0.1855 0.1250
PD 0.7963 0.8482 0.8559 0.8448 0.7936 0.8145 0.8750
PIC 0.5787 0.6343 0.6360 0.6084 0.5511 0.5886 0.6862
PE 0.3396 0.3786 0.3897 0.2975 0.2990 0.3786 0.4644
Ho 0.6385 0.6667 0.6743 0.6054 0.6067 0.6667 0.7228
HWE
df=1 χ2 0.0300 0.0809 0.1487 1.4980 0.0019 0.8222 0.0116
P 0.8626 0.7760 0.6998 0.2210 0.9652 0.3645 0.9141
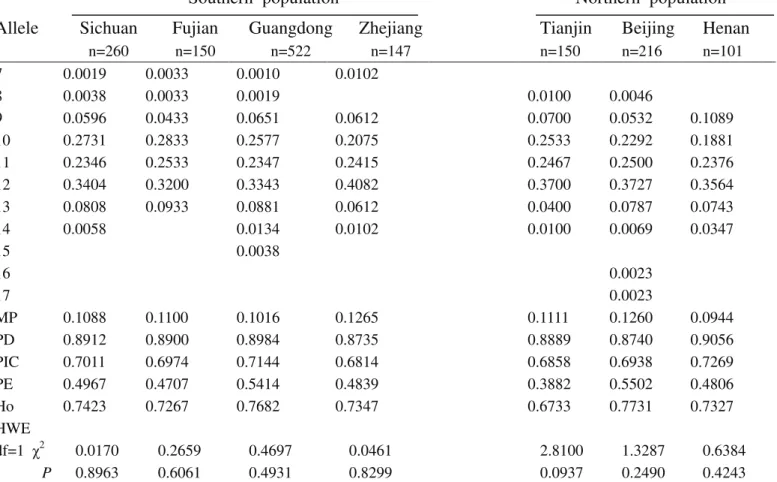
Table S5-Genetic polymorphism at the CSF1PO locus for the seven Chinese population groups.
Southern population
Northern population
MP: matching probability; PD: power of discrimination; PIC: polymorphism information content PE: power of exclusion; Ho: heterozygosity; HWE: Hardy-Weinberg equilibrium
Allele
Sichuan
Fujian
Guangdong
Zhejiang
Tianjin
Beijing
Henan
n=260 n=150 n=522 n=147 n=150 n=216 n=101
7 0.0019 0.0033 0.0010 0.0102
8 0.0038 0.0033 0.0019 0.0100 0.0046
9 0.0596 0.0433 0.0651 0.0612 0.0700 0.0532 0.1089
10 0.2731 0.2833 0.2577 0.2075 0.2533 0.2292 0.1881
11 0.2346 0.2533 0.2347 0.2415 0.2467 0.2500 0.2376
12 0.3404 0.3200 0.3343 0.4082 0.3700 0.3727 0.3564
13 0.0808 0.0933 0.0881 0.0612 0.0400 0.0787 0.0743
14 0.0058 0.0134 0.0102 0.0100 0.0069 0.0347
15 0.0038
16 0.0023
17 0.0023
MP 0.1088 0.1100 0.1016 0.1265 0.1111 0.1260 0.0944
PD 0.8912 0.8900 0.8984 0.8735 0.8889 0.8740 0.9056
PIC 0.7011 0.6974 0.7144 0.6814 0.6858 0.6938 0.7269
PE 0.4967 0.4707 0.5414 0.4839 0.3882 0.5502 0.4806
Ho 0.7423 0.7267 0.7682 0.7347 0.6733 0.7731 0.7327
HWE
df=1 χ2 0.0170 0.2659 0.4697 0.0461 2.8100 1.3287 0.6384
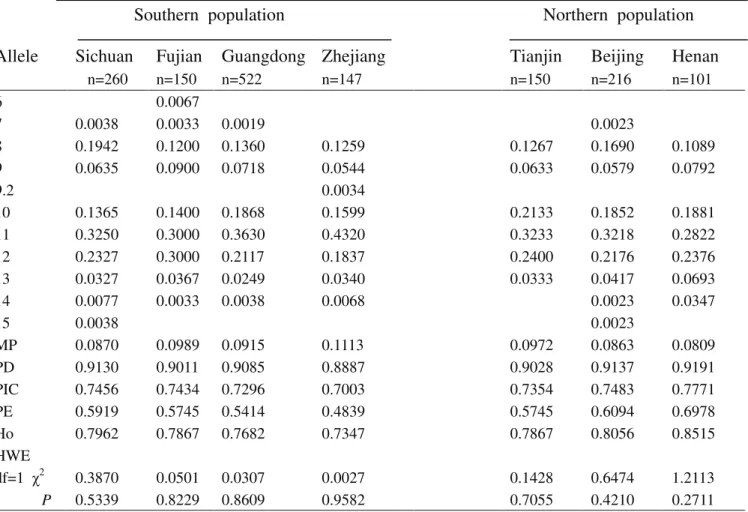
Table S6-Genetic polymorphism at the D7S820 locus for the seven Chinese population groups.
Allele
Sichuan
Fujian
Guangdong Zhejiang
Tianjin
Beijing
Henan
n=260 n=150 n=522 n=147 n=150 n=216 n=101
6 0.0067
7 0.0038 0.0033 0.0019 0.0023
8 0.1942 0.1200 0.1360 0.1259 0.1267 0.1690 0.1089
9 0.0635 0.0900 0.0718 0.0544 0.0633 0.0579 0.0792
9.2 0.0034
10 0.1365 0.1400 0.1868 0.1599 0.2133 0.1852 0.1881
11 0.3250 0.3000 0.3630 0.4320 0.3233 0.3218 0.2822
12 0.2327 0.3000 0.2117 0.1837 0.2400 0.2176 0.2376
13 0.0327 0.0367 0.0249 0.0340 0.0333 0.0417 0.0693
14 0.0077 0.0033 0.0038 0.0068 0.0023 0.0347
15 0.0038 0.0023
MP 0.0870 0.0989 0.0915 0.1113 0.0972 0.0863 0.0809
PD 0.9130 0.9011 0.9085 0.8887 0.9028 0.9137 0.9191
PIC 0.7456 0.7434 0.7296 0.7003 0.7354 0.7483 0.7771
PE 0.5919 0.5745 0.5414 0.4839 0.5745 0.6094 0.6978
Ho 0.7962 0.7867 0.7682 0.7347 0.7867 0.8056 0.8515
HWE
df=1 χ2 0.3870 0.0501 0.0307 0.0027 0.1428 0.6474 1.2113
P 0.5339 0.8229 0.8609 0.9582 0.7055 0.4210 0.2711
MP: matching probability; PD: power of discrimination; PIC: polymorphism information content PE: power of exclusion; Ho: heterozygosity; HWE: Hardy-Weinberg equilibrium
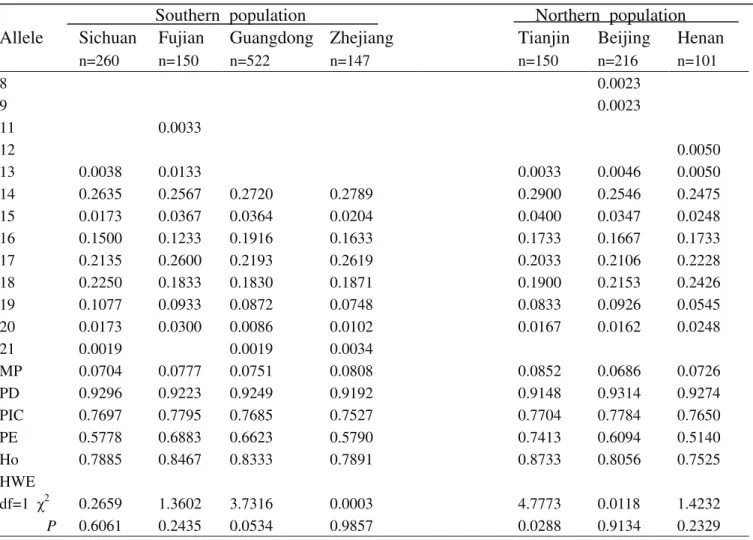
Table S7-Genetic polymorphism at the VWA locus for the seven Chinese population groups.
Southern population Northern population
Allele
Sichuan
Fujian
Guangdong Zhejiang
Tianjin
Beijing
Henan
n=260 n=150 n=522 n=147 n=150 n=216 n=101
8 0.0023
9 0.0023
11 0.0033
12 0.0050
13 0.0038 0.0133 0.0033 0.0046 0.0050
14 0.2635 0.2567 0.2720 0.2789 0.2900 0.2546 0.2475
15 0.0173 0.0367 0.0364 0.0204 0.0400 0.0347 0.0248
16 0.1500 0.1233 0.1916 0.1633 0.1733 0.1667 0.1733
17 0.2135 0.2600 0.2193 0.2619 0.2033 0.2106 0.2228
18 0.2250 0.1833 0.1830 0.1871 0.1900 0.2153 0.2426
19 0.1077 0.0933 0.0872 0.0748 0.0833 0.0926 0.0545
20 0.0173 0.0300 0.0086 0.0102 0.0167 0.0162 0.0248
21 0.0019 0.0019 0.0034
MP 0.0704 0.0777 0.0751 0.0808 0.0852 0.0686 0.0726
PD 0.9296 0.9223 0.9249 0.9192 0.9148 0.9314 0.9274
PIC 0.7697 0.7795 0.7685 0.7527 0.7704 0.7784 0.7650
PE 0.5778 0.6883 0.6623 0.5790 0.7413 0.6094 0.5140
Ho 0.7885 0.8467 0.8333 0.7891 0.8733 0.8056 0.7525
HWE
df=1 χ2 0.2659 1.3602 3.7316 0.0003 4.7773 0.0118 1.4232
P 0.6061 0.2435 0.0534 0.9857 0.0288 0.9134 0.2329
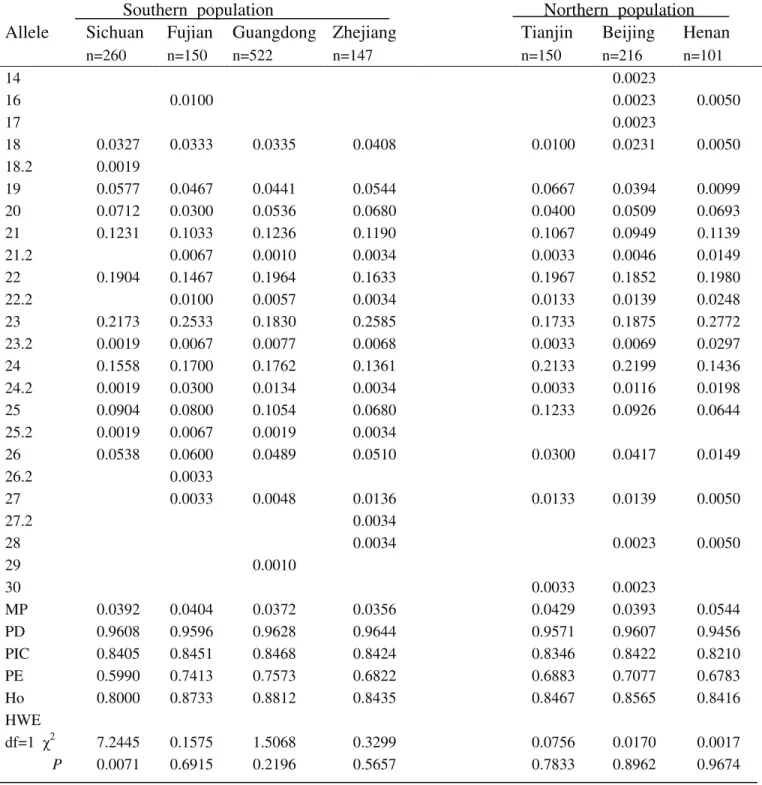
Table S8-Genetic polymorphism at the FGA locus for the seven Chinese population groups.
Southern population Northern population
Allele
Sichuan
Fujian
Guangdong Zhejiang
Tianjin
Beijing
Henan
n=260 n=150 n=522 n=147 n=150 n=216 n=101
14 0.0023
16 0.0100 0.0023 0.0050
17 0.0023
18 0.0327 0.0333 0.0335 0.0408 0.0100 0.0231 0.0050
18.2 0.0019
19 0.0577 0.0467 0.0441 0.0544 0.0667 0.0394 0.0099
20 0.0712 0.0300 0.0536 0.0680 0.0400 0.0509 0.0693
21 0.1231 0.1033 0.1236 0.1190 0.1067 0.0949 0.1139
21.2 0.0067 0.0010 0.0034 0.0033 0.0046 0.0149
22 0.1904 0.1467 0.1964 0.1633 0.1967 0.1852 0.1980
22.2 0.0100 0.0057 0.0034 0.0133 0.0139 0.0248
23 0.2173 0.2533 0.1830 0.2585 0.1733 0.1875 0.2772
23.2 0.0019 0.0067 0.0077 0.0068 0.0033 0.0069 0.0297
24 0.1558 0.1700 0.1762 0.1361 0.2133 0.2199 0.1436
24.2 0.0019 0.0300 0.0134 0.0034 0.0033 0.0116 0.0198
25 0.0904 0.0800 0.1054 0.0680 0.1233 0.0926 0.0644
25.2 0.0019 0.0067 0.0019 0.0034
26 0.0538 0.0600 0.0489 0.0510 0.0300 0.0417 0.0149
26.2 0.0033
27 0.0033 0.0048 0.0136 0.0133 0.0139 0.0050
27.2 0.0034
28 0.0034 0.0023 0.0050
29 0.0010
30 0.0033 0.0023
MP 0.0392 0.0404 0.0372 0.0356 0.0429 0.0393 0.0544
PD 0.9608 0.9596 0.9628 0.9644 0.9571 0.9607 0.9456
PIC 0.8405 0.8451 0.8468 0.8424 0.8346 0.8422 0.8210
PE 0.5990 0.7413 0.7573 0.6822 0.6883 0.7077 0.6783
Ho 0.8000 0.8733 0.8812 0.8435 0.8467 0.8565 0.8416
HWE
df=1 χ2 7.2445 0.1575 1.5068 0.3299 0.0756 0.0170 0.0017
P 0.0071 0.6915 0.2196 0.5657 0.7833 0.8962 0.9674
Table S9-Genetic polymorphism at the D8S1179 locus for the seven Chinese population groups.
Southern population Northern population
Allele
Sichuan
Fujian
Guangdong Zhejiang
Tianjin
Beijing
Henan
n=260 n=150 n=522 n=147 n=150 n=216 n=101
8 0.0019 0.0033 0.0023
9 0.0068
10 0.1423 0.1333 0.1303 0.1054 0.1133 0.0926 0.0545
11 0.1154 0.0867 0.1207 0.1020 0.1033 0.0903 0.1386
12 0.1154 0.1600 0.1111 0.1088 0.1167 0.1319 0.1535
13 0.1827 0.1800 0.1762 0.2007 0.1967 0.1875 0.2574
14 0.1942 0.1200 0.1619 0.1871 0.1733 0.1898 0.1782
15 0.1635 0.2000 0.2021 0.1803 0.1767 0.1968 0.1337
16 0.0731 0.1000 0.0814 0.0884 0.0967 0.0972 0.0446
17 0.0115 0.0133 0.0134 0.0204 0.0167 0.0069 0.0396
18 0.0067 0.0029 0.0033 0.0023
19 0.0023
MP 0.0420 0.0432 0.0426 0.0490 0.0444 0.0460 0.0544
PD 0.9580 0.9568 0.9574 0.9510 0.9556 0.9540 0.9456
PIC 0.8313 0.8342 0.8331 0.8326 0.8357 0.8274 0.8142
PE 0.6206 0.6623 0.6475 0.7913 0.7280 0.6623 0.6591
Ho 0.8115 0.8333 0.8257 0.8980 0.8667 0.8333 0.8317
HWE
df=1 χ2 3.2763 0.5646 2.8707 2.3261 0.1349 0.3820 0.0397
P 0.0703 0.4524 0.0902 0.1272 0.7134 0.5365 0.8420
Table S10-Genetic polymorphism at the D21S11 locus for the seven Chinese population groups.
Southern population Northern population
Allele
Sichuan
Fujian
Guangdong Zhejiang
Tianjin
Beijing
Henan
n=260 n=150 n=522 n=147 n=150 n=216 n=101
26 0.0019
27 0.0019
27.2 0.0033
28 0.0481 0.0300 0.0565 0.0510 0.0400 0.0394 0.0644
28.2 0.0077 0.0100 0.0034 0.0067 0.0093 0.0050
29 0.2538 0.2567 0.2548 0.2823 0.2933 0.2894 0.3119
29.2 0.0019 0.0033
30 0.2673 0.3133 0.2443 0.2857 0.2300 0.2569 0.2574
30.2 0.0077 0.0067 0.0096 0.0204 0.0100 0.0139 0.0149
31 0.0942 0.1100 0.1303 0.0714 0.1167 0.0972 0.1089
31.2 0.0769 0.0367 0.0441 0.0646 0.1000 0.0764 0.0842
32 0.0346 0.0300 0.0546 0.0476 0.0300 0.0324 0.0248
32.2 0.1558 0.1500 0.1370 0.1293 0.1200 0.1366 0.0693
33 0.0019 0.0100 0.0048 0.0034 0.0100 0.0046
33.2 0.0404 0.0400 0.0603 0.0306 0.0333 0.0370 0.0594
34 0.0023
34.2 0.0019 0.0033 0.0019 0.0068 0.0067 0.0046
35.2 0.0019 0.0034
36 0.0019
MP 0.0552 0.0897 0.0538 0.0703 0.0563 0.0694 0.0777
PD 0.9448 0.9103 0.9462 0.9297 0.9437 0.9306 0.9223
PIC 0.7972 0.7695 0.8066 0.7822 0.7971 0.7885 0.7799
PE 0.6134 0.6623 0.7036 0.6822 0.5625 0.7354 0.4644
Ho 0.8077 0.8333 0.8544 0.8435 0.7800 0.8704 0.7228
HWE
df=1 χ2 0.3302 1.1012 2.4467 1.1269 1.7965 4.5473 4.7533
P 0.5656 0.2940 0.1178 0.2884 0.1801 0.0330 0.0292
Table S11-Genetic polymorphism at the D18S51 locus for the seven Chinese population groups.
Southern population Northern population
Allele
Sichuan
Fujian Guangdong
Zhejiang
Tianjin
Beijing
Henan
n=260 n=150 n=522 n=147 n=150 n=216 n=101
9 0.0033
10 0.0033 0.0033 0.0023 0.0099
10.2 0.0034
11 0.0019 0.0100 0.0038 0.0068 0.0070 0.0099
12 0.0404 0.0233 0.0287 0.0442 0.0267 0.0395 0.0149
13 0.1577 0.1933 0.1983 0.1905 0.2067 0.1837 0.1832
14 0.2058 0.1967 0.1887 0.2109 0.2133 0.2302 0.1634
15 0.1904 0.1400 0.1916 0.1905 0.1667 0.1674 0.1832
16 0.1462 0.1700 0.1264 0.1054 0.1167 0.1372 0.0743
17 0.0712 0.0967 0.0671 0.0646 0.0833 0.0767 0.0792
18 0.0462 0.0233 0.0556 0.0340 0.0500 0.0512 0.0842
19 0.0481 0.0533 0.0575 0.0612 0.0367 0.0302 0.0545
20 0.0308 0.0233 0.0287 0.0408 0.0400 0.0326 0.0396
21 0.0212 0.0200 0.0287 0.0272 0.0300 0.0233 0.0248
22 0.0173 0.0400 0.0144 0.0102 0.0167 0.0070 0.0347
23 0.0135 0.0033 0.0077 0.0068 0.0067 0.0070 0.0149
23.2 0.0248
24 0.0077 0.0029 0.0034
25 0.0019 0.0023 0.0050
26 0.0033 0.0023
MP 0.0347 0.0413 0.0388 0.0403 0.0444 0.0427 0.0350
PD 0.9653 0.9587 0.9612 0.9597 0.9556 0.9573 0.9650
PIC 0.8473 0.8440 0.8432 0.8428 0.8402 0.8373 0.8683
PE 0.6798 0.6367 0.7341 0.7498 0.7280 0.7435 0.6027
Ho 0.8423 0.8200 0.8697 0.8776 0.8667 0.8744 0.8020
HWE
df=1 χ2 1.0177 2.2680 0.4468 0.3321 0.0745 0.6151 6.6459
P 0.3131 0.1321 0.5039 0.5644 0.7849 0.4329 0.0099
Table S12-Genetic polymorphism at the D5S818 locus for the seven Chinese population groups.
Southern population Northern population
Allele
Sichuan
Fujian
Guangdong Zhejiang
Tianjin
Beijing
Henan
n=260 n=150 n=522 n=147 n=150 n=216 n=101
7 0.0308 0.0200 0.0297 0.0408 0.0367 0.0162 0.0198
8 0.0019 0.0048 0.0034 0.0046 0.0297
9 0.0846 0.0967 0.0996 0.0646 0.0900 0.0718 0.0545
10 0.1788 0.1667 0.2165 0.1565 0.1700 0.1944 0.1733
11 0.3269 0.2933 0.3123 0.2993 0.3300 0.2940 0.3416
12 0.2327 0.2867 0.2107 0.2959 0.2400 0.2546 0.2228
13 0.1269 0.1133 0.1044 0.1361 0.1200 0.1458 0.1040
14 0.0115 0.0133 0.0192 0.0100 0.0185 0.0545
15 0.0058 0.0100 0.0029 0.0034 0.0033
MP 0.0805 0.0804 0.0772 0.0964 0.0778 0.0897 0.0913
PD 0.9195 0.9196 0.9228 0.9036 0.9222 0.9103 0.9087
PIC 0.7510 0.7484 0.7585 0.7396 0.7488 0.7508 0.7568
PE 0.4774 0.4599 0.5828 0.5544 0.5270 0.5837 0.3600
Ho 0.7308 0.7200 0.7912 0.7755 0.7600 0.7917 0.6535
HWE
df=1 χ2 4.3703 3.5963 0.0054 0.0011 0.4778 0.0456 11.2602
P 0.0366 0.0579 0.9415 0.9741 0.4894 0.8309 0.0008
Table S13-Genetic polymorphism at the D13S317 locus for the seven Chinese population groups.
Southern population Northern population
Allele
Sichuan
Fujian
Guangdong Zhejiang
Tianjin
Beijing
Henan
n=260 n=150 n=522 n=147 n=150 n=216 n=101
7 0.0019
8 0.3135 0.3167 0.3065 0.3265 0.2833 0.2546 0.1931
9 0.1365 0.1367 0.1446 0.1463 0.1033 0.1690 0.1188
10 0.1154 0.1400 0.1025 0.1395 0.1733 0.1505 0.1238
11 0.2212 0.2300 0.2423 0.2075 0.2200 0.2199 0.2277
12 0.1692 0.1167 0.1619 0.1395 0.1833 0.1690 0.2228
13 0.0269 0.0367 0.0364 0.0374 0.0300 0.0278 0.0792
14 0.0154 0.0100 0.0057 0.0034 0.0067 0.0093 0.0347
15 0.0067
16 0.0033
18 0.0033
MP 0.0727 0.0797 0.0782 0.0843 0.0769 0.0684 0.0603
PD 0.9273 0.9203 0.9218 0.9157 0.9231 0.9316 0.9397
PIC 0.7611 0.7645 0.7570 0.7584 0.7654 0.7773 0.8005
PE 0.5569 0.6367 0.5828 0.5666 0.5990 0.6445 0.5844
Ho 0.7769 0.8200 0.7912 0.7823 0.8000 0.8241 0.7921
HWE
df=1 χ2 0.3988 0.5289 0.0138 0.0722 0.0016 0.3568 0.9391
P 0.5277 0.4671 0.9066 0.7881 0.9685 0.5503 0.3325