A multi-criteria decision approach to sorting actions
for promoting energy efficiency
Luís Pires Neves
a),d),*, António Gomes Martins
b),d),
Carlos Henggeler Antunes
b),d), Luís Cândido Dias
c),d)a) School of Technology and Management of Leiria, Morro do Lena, Alto Vieiro, Ap. 4163, 2411-901 Leiria, Portugal
b) Department of Electrical Engineering and Computers, University of Coimbra, Polo II, Pinhal de Marrocos, 3030-290 Coimbra, Portugal
c) Faculty of Economics, University of Coimbra, Av. Dias da Silva, 165, 3004-512 Coimbra, Portugal d) INESC Coimbra, Rua Antero de Quental, 3000-033 Coimbra, Portugal
* Corresponding author: [email protected], tel: +351 239851040; fax: +351 239824692
Abstract
This paper proposes a multi-criteria decision approach for sorting energy efficiency initiatives, promoted by electric utilities, with or without public funds authorized by a regulator, or promoted by an
independent energy agency, overcoming the limitations and drawbacks of Cost-Benefit Analysis. The proposed approach is based on the ELECTRE-TRI multi-criteria method and allows the consideration of different kinds of impacts, although avoiding difficult measurements and unit conversions. The decision is based on all the significant effects of the initiative, both positive and negative ones, including ancillary effects often forgotten in cost-benefit analysis. The ELECTRE-TRI, as most multi-criteria methods, provides to the Decision Maker the ability of controlling the relevance each impact can have on the final decision in a transparent way. The decision support process encompasses a robustness analysis, which, together with a good documentation of the parameters supplied into the model, should support sound decisions. The models were tested with a set of real-world initiatives and compared with possible decisions based on Cost-Benefit analysis.
Keywords
Energy Efficiency; Multi-criteria Decision Support; Market Transformation
Introduction
For a long time, Demand-Side Management (DSM) was recognized as an effective tool for increasing the energy efficiency of the economy and reducing the environmental impact of energy use. Utilities were stimulated through regulation to promote DSM with financial compensations to turn Cost-Benefit analysis more to the benefit side. Incentives have faded away with the deregulation trend and market liberalization has led to a dramatic reduction of DSM investments by utilities. In this new context, DSM has been replaced by the concept of Market Transformation (MT) in which the set of energy efficiency promoting agents has extended beyond the electric energy sector companies. The contribution of electric companies to the MT efforts can only proceed or arise by their own initiative if ex-ante evaluations provide profit assurance, in the respect of any legal or regulatory constraints that may exist. Other entities have been using public funds, sometimes collected through specific levies, to implement these initiatives but have the limitation of being external to the market. The main purpose of MT initiatives is to change the market on a permanent basis, reducing the barriers to the natural adoption of Energy Efficiency (EEff) as a criterion of equipment choice or everyday practice by end-users.
The motivation for these initiatives has now several dimensions. Having started as a good idea in economic terms, the promotion of EEff became a strategy for the climate change mitigation effort, the improvement of low-income households’ welfare, the reliability improvements on the electric energy systems and other political reasons such as employment creation, reduction of the dependence on imported energy sources, etc.
The consideration of all advantages and disadvantages of EEff promotion leads naturally to a multi-criteria decision problem formulation, since multiple evaluation aspects of its merits are at stake. The traditional solution to support decisions is then to aggregate all these multiple benefits and costs into a single additive index, using a common monetary scale. In this way it seems easy to use common procedures of investment analysis to compare EEff initiatives, and to compare these with other options, namely supply-side options.
The methodologies called Cost-Benefit Analysis and Cost-Effectiveness Analysis have been applied to the analysis of EEff initiatives since the 1980s, mainly after the publication of a set of “tests” by the
California Energy Commission and California Public Utilities Commission (CEC&CPUC, 83, 87; CPUC, 2001b). These tests became almost universal, being used by many utilities and regulatory entities in other US states and outside the US (ELSAM, 93). There are five perspectives addressed in these
methodologies: the Participant (consumer) in the programme, the average ratepayer (Ratepayer Impact Measure), the Utility Cost, the Total Resource Cost and the Societal Cost.
The beginning of the market liberalisation process and the multiplicity of market situations in Europe, where simultaneously public monopoly frameworks existed, fostered the development of a specific methodology for Europe. A EU funded project (SRCi, 1996) created such a methodology, which although similar in concept to the California methodology, included a few innovations, namely the choice of perspectives and impacts to include in the analysis as a way of adapting the methodology to the diversity of situations and the inclusion of non-monetary impacts as a qualitative help to the decision. Other methodologies developed after the beginning of the market deregulation process also adopted this latter principle in order to include benefits which were difficult or impossible to monetise (Eto et al., 1998; CPUC, 2001a, 2003).
However, there are several issues that challenge the validity methodologies based on Cost-Benefit Analysis (CBA) for judging EEff initiatives. Firstly, the basic assumptions of the Welfare Economics theory are not universally accepted. Secondly, value judgements are done by analysts and somehow hidden in the calculations, not being available to the decision makers. Thirdly, the methods which could lead to reliable data, namely the economic value of impacts, may be difficult or impossible to apply, forcing the use of questionable data, which may have a significant effect on the resulting indicators supplied to the decision maker. For instance, there is no consensus on how to calculate the value of avoided or added environmental externalities, resulting from EEff initiatives or supply options. These difficulties were notorious during the EU funded ExternE, resulting on wide ranges for external costs of each energy source, and even those had to be subject to serious simplifying assumptions or otherwise they could not be calculated at all (European Commission, 1999a; 1999b; Krewitt, 2002; Sundqvist, 2004). This kind of unreliable data should lead to a lack of confidence on a decision based only on a net benefit or benefit-cost ratio, and even more if the calculation details are hidden from the decision maker, but the fact is that money values usually inspire a degree of confidence that easily supports political decisions, even if they should not.
better suit the preferences stated by the decision maker. A carefully chosen procedure may also include the treatment of the uncertainty of data, allowing the analysis of the decision robustness.
This paper summarizes a proposal for a multi-criteria evaluation framework for the process of analysis of EEff initiatives. The first section describes the perspectives of analysis, the choice of the multi-criteria method to be used for the evaluation, and the selection of criteria. The second section makes a brief presentation of the multi-criteria method chosen to provide decision support. The following section shows the results of applying the proposed methodology to a set of DSM/EEff initiatives. Finally, some
conclusions are drawn regarding the use of this approach and a comparison is made with the traditional Cost-Benefit Analysis.
Main perspectives of analysis
The definition of a new analysis framework, based on a paradigm different from Cost-Benefit Analysis and the new realities of the electricity market with new market players and new relations of power suggested the need of a fresh view of the problem. There were several useful starting points such as the European Benefit-Cost Methodology (SRCi, 1996), the California Standard Practice and a multi-criteria approach described in Hobbs and Horn (1997) for the British Columbia Gas.
On a first structuring phase (Neves et al., 2004), the main actors and some of their points-of-view regarding EEff were identified and the knowledge about the problem was extended. This step allowed us to identify the entities that could be interested in using such an evaluation system:
the Energy Agency, representing an entity with the purpose of using the public funds usually collected through non-bypassable levies, e.g., the System Benefit Charge (or Public Benefit Charge) in the U.S.;
the Regulator, the authority which still regulates the remaining monopoly activities of the Electric Energy Market, namely the “wires” business;
the Distribution utilities, still regulated and that in some countries have been chosen as EEff promoters by removing the disincentives in the revenue definition mechanism (Pagliano et al., 2001);
the competitive Supply companies which, although naturally aiming at an increase in sales, may look to EEff as a marketing strategy to attract or to keep customers.
The first stage also identified desirable characteristics of the multi-criteria method which should support decisions:
capacity of evaluating each initiative in absolute terms, and not only in comparison with others, independence towards scales, to permit the inclusion of impacts measured in different units, and
even of impacts measured in qualitative terms.
Such characteristics suggest the use of the ELECTRE TRI method (Yu, 1992).
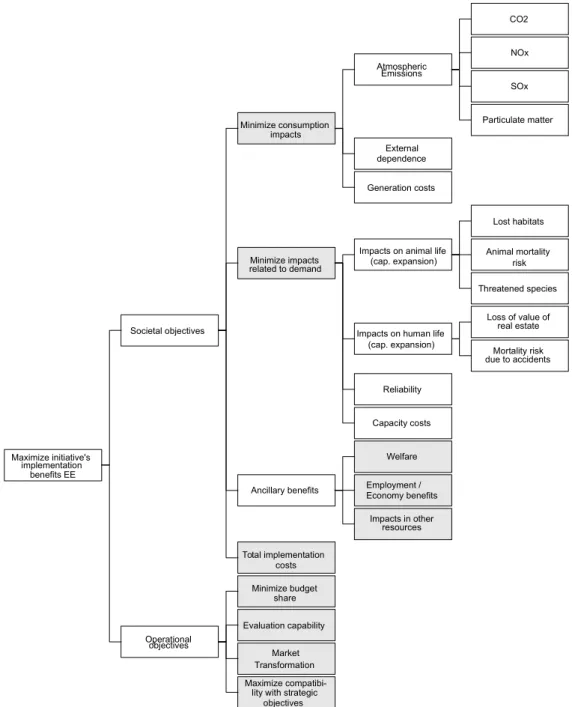
A second phase involved the development of hierarchies of fundamental objectives and their expression in terms of criteria to use in the evaluation models (Neves et al., 2005), based on the knowledge developed in the structuring phase. The process of constructing the multi-criteria models through the development of the hierarchies of fundamental objectives addressed the need of an evaluation system that can be applied to any future EEff initiative, by discovering the points-of-view of the decision makers, instead of looking only to the distinctive characteristics of each alternative in a decision problem. An example of the result of this step is the tree of fundamental objectives of the Energy Agency, shown in figure 1.
The coloured boxes in figure 1 represent the objectives which were chosen to be the criteria for the evaluation model. The first two, to minimize consumption impacts and to minimize impacts related to demand, are used as proxy measures for the objectives of lower levels due to the problematic conversions involved and their clear relation, specially when considering electric EEff initiatives.
The tree of fundamental objectives of the Regulator is similar to that of the Agency, since both address the societal perspective, except for the operational objectives. The Regulator has the purpose of balancing the need to assure adequate revenues to the regulated utilities and the protection of consumers from
monopolistic power. The trees of the companies balance the objectives related to the net value of energy services and the ancillary benefits and costs of the implementation of EEff initiatives.
Figure 1 – Tree of fundamental objectives of an Energy Agency.
The choice of some aggregation levels needs additional explanations:
The reduction of atmospheric pollution emissions due to energy efficiency initiatives is even more difficult to quantify than environmental impacts from supply side options due to the variable mix of generation that may apply for the avoided energy consumption. A common way of quantifying those impacts is to apply a fixed emission level to the total kWh of avoided generation (CPUC, 2001b, 2003). As these average emission levels are also controversial and there is no need to change the measurement units, the avoided kWh can be the proxy measure of
CO2 NOx SOx Particulate matter Atmospheric Emissions External dependence Generation costs Minimize consumption impacts Lost habitats Animal mortality risk Threatened species Impacts on animal life
(cap. expansion)
Loss of value of real estate Mortality risk due to accidents Impacts on human life
(cap. expansion) Reliability Capacity costs Minimize impacts related to demand Welfare Employment / Economy benefits Impacts in other resources Ancillary benefits Total implementation costs Societal objectives Minimize budget share Evaluation capability Market Transformation Maximize
compatibi-lity with strategic objectives Operational objectives Maximize initiative's implementation benefits EE
the reduction of atmospheric pollution. The reduction of the dependence of foreign resources and even the reduction in generation costs share the same philosophy and can also be aggregated in this attribute.
A similar explanation applies to the reduction of animal and human impacts of capacity expansion. It is quite difficult to assess the consequences of building new generation plants or power lines in terms of animal life and even human life in a complete and reliable manner and it is almost impossible to predict how an energy efficiency initiative will reduce these costs. There is however one certainty: these cost reductions will be a function of the avoided capacity. The use of the avoided capacity (in MW or other unit of power) can then be a reliable proxy for these benefits as well as of the energy system reliability improvements and avoided capacity costs. The remaining criteria needing explanation are:
Improvements in welfare : Ancillary benefits of energy efficiency measures may include improvements
in comfort, eventually resulting in health benefits and even reduction of deaths (Davis et al., 2000; Clinch and Healy, 2001). These benefits are independent of the health benefits resulting from a cleaner air which are already considered at the emission reduction level.
In evaluations it is sometimes common to assess the “take-back” or rebound effect, defined as the amount of energy savings that are lost due to an increase in the use of energy services as a result of the bill reduction. These lost savings should be discounted to the predicted energy savings but they also represent an increase in welfare that should be considered explicitly.
The complex and multiple source nature of this criterion suggests it should be used on a qualitative basis. There were, however, a few attempts to quantify and even to value such impacts (Clinch and Healy, 2001).
Employment/Economy benefits : The energy efficiency initiatives may have a positive or negative
impact in terms of employment creation and domestic product. For instance, it depends on the reduction of sales of a local end-use manufacturer which cannot follow the new standard, or the creation of new Energy Service Companies to participate in the implementation of energy efficiency initiatives, among other possibilities. The difficult computation of quantitative data may suggest the use of a qualitative scale but in certain cases these impacts have been computed through simulation (Nicolls et al., 1994). There are also several studies regarding post evaluation of employment/economy benefits from Energy
Efficiency initiatives that may be used as a reference (Association for the Conservation of Energy, 2000; Geller et al., 1992; Wade et al., 2000).
Benefits in other resources : Some initiatives may affect on a positive or negative way other resources
such as water supply. The variable nature and probable difficulty of assessment forces this criterion to be measured in a qualitative way. The most common example regards water consumption. Initiatives that address domestic water consumption like the spreading of low flux shower-heads, with the aim of reducing energy consumption, also contribute to reduce the potable water depletion.
Total implementation costs to society : The sum of the net additional costs to the participant and the
costs that result from the implementation and monitoring of the initiatives are direct costs to the society. The bill reductions to participants are cancelled with sales reduction to companies and the avoided costs are already considered through energy and capacity savings. Therefore, these are simply the
implementation and monitoring costs. A null or negative result would mean that the initiative has no economic cost or saves money regarding what would cost the alternative “business-as-usual” (e.g. if an unknown and more efficient end-use was also cheaper than the known alternative, a situation with a low probability of occurrence). This criterion is to be measured in monetary terms.
Budget share : The agency has a limited budget. The share allocated to each initiative is certainly a
matter of concern to the Agency decision makers. This can be measured in absolute terms on monetary units, or in relative terms in percentage, depending on the sensibility of the decision-makers. It can also be measured in qualitative terms if one wants to allow different financing schemes which may split the investment in several years.
Evaluation capability : The ability to do a post-evaluation of the initiatives is important to be able to
verify the efficacy of the initiative and to demonstrate the goodness of the investment. Some initiatives are impossible to evaluate reliably (information initiatives) and others are easily auditable. This criterion needs a qualitative judgement.
Market transformation : Some initiatives have persistent results, transforming the market on a
permanent basis but others only affect a limited number of consumers and perhaps only as long as they last. The performances in this criterion are evaluated qualitatively.
Strategic objectives : Having to comply with external (energy policy) or internal guidelines, the agency
and the regulator need to assess each initiative according with these strategic objectives. The companies have a similar objective to express the adequacy of the initiative to the company’s primary objectives, e.g.
if the new business area created by an initiative meets an objective of diversification or, contrarily, goes against the objective of focusing on the core business. Again, this is a criterion which can only be assessed on a qualitative basis.
Implementation
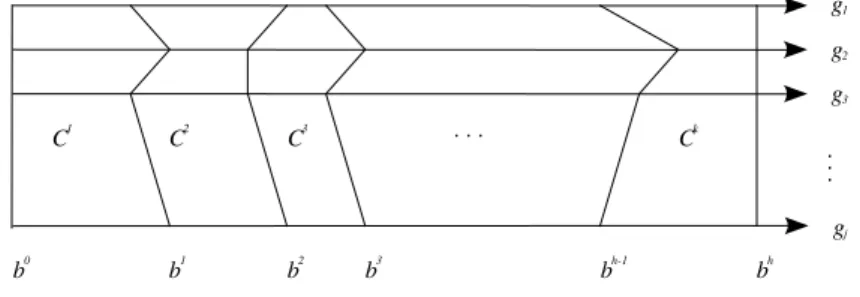
The choice of a method to implement the multi-criteria evaluation of EEff initiatives resulted, as already stated, from the understanding of its desirable properties in this context. The ELECTRE TRI method (Yu, 1992) belongs to the ELECTRE family of multi-criteria methods developed by Bernard Roy and his co-workers (Roy, 1991; 1996). This specific method is dedicated to the sorting problem: to assign each alternative to one of a set of pre-defined ordered categories according to a set of evaluation criteria. The categories (Cx) are defined by specifying their boundaries (by) by means of reference profiles, in terms of
performance in each criterion, as shown in figure 2.
Figure 2 – Definition of categories Ch with reference profiles bh.
The assignment of each action to one category is done by comparing its performances in each criterion to the performances of the reference profiles. The procedure assigns each action to the highest category such that its lower bound blw is outranked by a. The outranking relation is decided by comparing a credibility index, computed using the differences in performances and the criterion weights, with a cutting level ([0.5,1]) which defines the “majority requirement”. For further details about ELECTRE TRI see Yu (1992) and Mousseau et al. (1999). The software package IRIS 2.0 (Dias and Mousseau, 2003) was selected to provide decision support for the models developed. This software implements a methodology developed by Dias et al. (2002), based on the ELECTRE TRI method, but accepting uncertainty in the input parameters. Its main characteristics include:
b0 b2 b3 bh b1 C2 C3 . . . Ck C1 bh-1 g1 g2 g3 gj . . .
Acceptance of imprecision regarding the criterion weights and the cutting level through the definition of intervals for each parameter, or the definition of linear constraints (e.g., stating that one criterion has more weight than another one).
Acceptance of classification examples, i.e., actions for which the decision-maker has indicated a category or an interval of categories. This is translated by the software into constraints to the parameters that ensure these results are reproduced.
Inference of a central combination of parameters through the maximization of the minimum slack, when the constraints are consistent. For each action, it is shown which category represents this central combination, and the other possible classifications that respect the imposed
constraints.
Inference of a combination of parameters that will limit the violation of the constraints in the case of inconsistency, minimizing the maximum deviation. It is also possible to find the constraint subsets, which must be removed to restore consistency.
Case study
Quantitative data
A data set was created for testing the proposed methodology with different kinds of initiatives, implementation types, target consumers, and promoting entities.
The existence of public databases with evaluation data of DSM/EEff programmes enabled the use of actual data regarding costs and savings, which were then adapted with current values for the Portuguese market. Most data were obtained from the INDEEP database, a result from the IEA DSM project (http://dsm.iea.org).
The INDEEP database contains data from more than 200 DSM/EEff programmes, implemented in several countries, since the 1980s to recent years, although with a variable quality. The selection of the set of initiatives to use as case studies had to comply with the following conditions:
1. Existence of savings data: energy and / or peak demand. 2. Existence of implementation cost data.
3. To be a recent implementation as it minimizes money value adjustments.
5. To focus on electric energy.
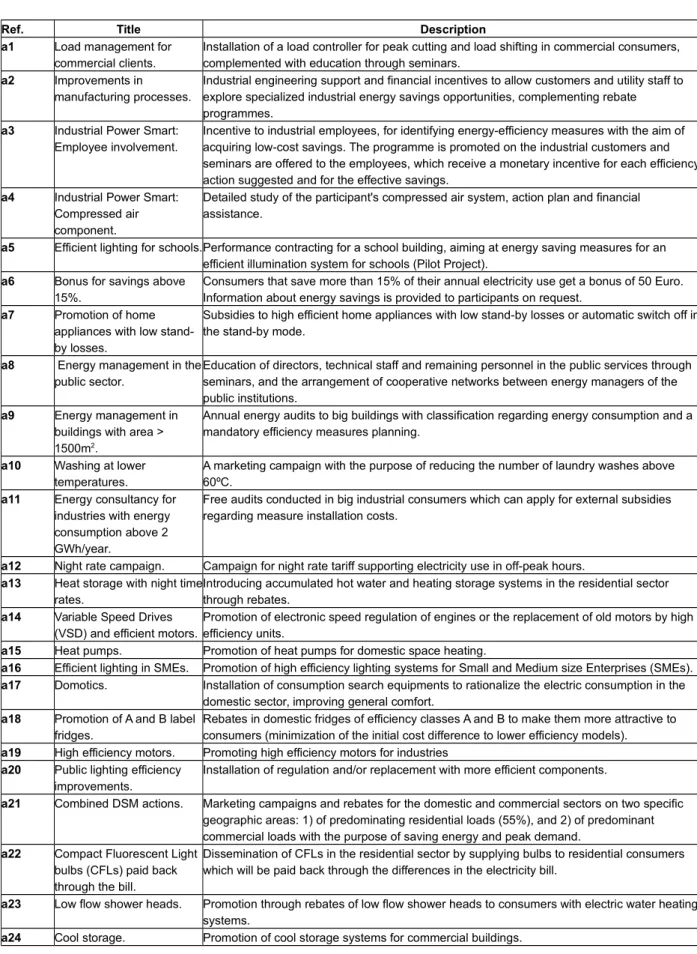
6. To have enough diversity of programmes and to address the objectives already referred to. Table 1 – Selected DSM/EEff Initiatives
Ref. Title Description
a1 Load management for commercial clients.
Installation of a load controller for peak cutting and load shifting in commercial consumers, complemented with education through seminars.
a2 Improvements in manufacturing processes.
Industrial engineering support and financial incentives to allow customers and utility staff to explore specialized industrial energy savings opportunities, complementing rebate programmes.
a3 Industrial Power Smart: Employee involvement.
Incentive to industrial employees, for identifying energy-efficiency measures with the aim of acquiring low-cost savings. The programme is promoted on the industrial customers and seminars are offered to the employees, which receive a monetary incentive for each efficiency action suggested and for the effective savings.
a4 Industrial Power Smart: Compressed air component.
Detailed study of the participant's compressed air system, action plan and financial assistance.
a5 Efficient lighting for schools.Performance contracting for a school building, aiming at energy saving measures for an efficient illumination system for schools (Pilot Project).
a6 Bonus for savings above 15%.
Consumers that save more than 15% of their annual electricity use get a bonus of 50 Euro. Information about energy savings is provided to participants on request.
a7 Promotion of home appliances with low stand-by losses.
Subsidies to high efficient home appliances with low stand-by losses or automatic switch off in the stand-by mode.
a8 Energy management in the public sector.
Education of directors, technical staff and remaining personnel in the public services through seminars, and the arrangement of cooperative networks between energy managers of the public institutions.
a9 Energy management in buildings with area > 1500m2.
Annual energy audits to big buildings with classification regarding energy consumption and a mandatory efficiency measures planning.
a10 Washing at lower temperatures.
A marketing campaign with the purpose of reducing the number of laundry washes above 60ºC.
a11 Energy consultancy for industries with energy consumption above 2 GWh/year.
Free audits conducted in big industrial consumers which can apply for external subsidies regarding measure installation costs.
a12 Night rate campaign. Campaign for night rate tariff supporting electricity use in off-peak hours.
a13 Heat storage with night time rates.
Introducing accumulated hot water and heating storage systems in the residential sector through rebates.
a14 Variable Speed Drives (VSD) and efficient motors.
Promotion of electronic speed regulation of engines or the replacement of old motors by high efficiency units.
a15 Heat pumps. Promotion of heat pumps for domestic space heating.
a16 Efficient lighting in SMEs. Promotion of high efficiency lighting systems for Small and Medium size Enterprises (SMEs).
a17 Domotics. Installation of consumption search equipments to rationalize the electric consumption in the domestic sector, improving general comfort.
a18 Promotion of A and B label fridges.
Rebates in domestic fridges of efficiency classes A and B to make them more attractive to consumers (minimization of the initial cost difference to lower efficiency models).
a19 High efficiency motors. Promoting high efficiency motors for industries
a20 Public lighting efficiency improvements.
Installation of regulation and/or replacement with more efficient components.
a21 Combined DSM actions. Marketing campaigns and rebates for the domestic and commercial sectors on two specific geographic areas: 1) of predominating residential loads (55%), and 2) of predominant commercial loads with the purpose of saving energy and peak demand.
a22 Compact Fluorescent Light bulbs (CFLs) paid back through the bill.
Dissemination of CFLs in the residential sector by supplying bulbs to residential consumers which will be paid back through the differences in the electricity bill.
a23 Low flow shower heads. Promotion through rebates of low flow shower heads to consumers with electric water heating systems.
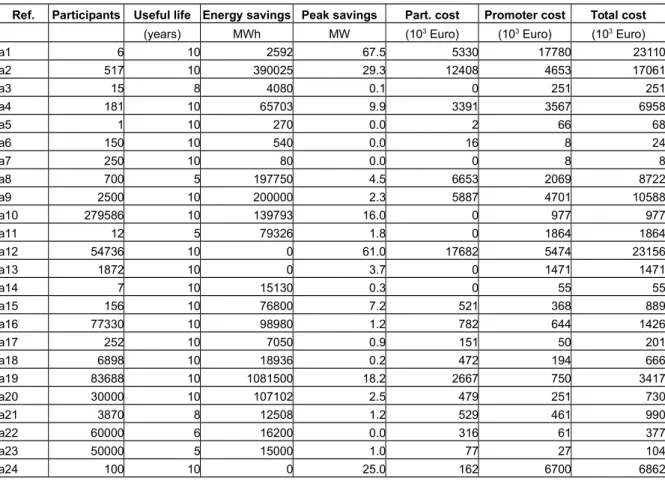
Table 2 – Main quantitative data for the selected initiatives
Ref. Participants Useful life Energy savings Peak savings Part. cost Promoter cost Total cost
(years) MWh MW (103 Euro) (103 Euro) (103 Euro)
a1 6 10 2592 67.5 5330 17780 23110 a2 517 10 390025 29.3 12408 4653 17061 a3 15 8 4080 0.1 0 251 251 a4 181 10 65703 9.9 3391 3567 6958 a5 1 10 270 0.0 2 66 68 a6 150 10 540 0.0 16 8 24 a7 250 10 80 0.0 0 8 8 a8 700 5 197750 4.5 6653 2069 8722 a9 2500 10 200000 2.3 5887 4701 10588 a10 279586 10 139793 16.0 0 977 977 a11 12 5 79326 1.8 0 1864 1864 a12 54736 10 0 61.0 17682 5474 23156 a13 1872 10 0 3.7 0 1471 1471 a14 7 10 15130 0.3 0 55 55 a15 156 10 76800 7.2 521 368 889 a16 77330 10 98980 1.2 782 644 1426 a17 252 10 7050 0.9 151 50 201 a18 6898 10 18936 0.2 472 194 666 a19 83688 10 1081500 18.2 2667 750 3417 a20 30000 10 107102 2.5 479 251 730 a21 3870 8 12508 1.2 529 461 990 a22 60000 6 16200 0.0 316 61 377 a23 50000 5 15000 1.0 77 27 104 a24 100 10 0 25.0 162 6700 6862
The main quantitative data obtained from the databases (table 2) were used to compute the remaining quantitative estimates needed for the set of selected initiatives, based on the Portuguese electric tariffs, assuming a probable distribution by type of electric customers (voltage level). The useful life considered for the savings calculations is limited to ten years assuming that this would be the maximum accepted by the different entities to minimize the risk in estimates.
Qualitative data
A significant number of criteria for the defined evaluation models had no estimates in the evaluation databases. Although there are methods for estimating some of these impacts, like the employment impact of EEff initiatives, most of them can only be assessed through qualitative scales. For addressing this problem it is necessary to define measurement scales for each criterion and a reliable process of
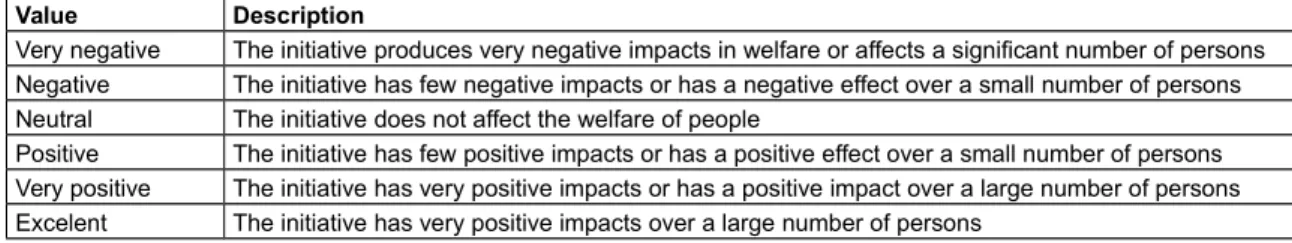
evaluating the performance of each initiative according to each scale. Our approach consisted in querying a set of individuals, with a strong knowledge in the field, for their evaluations according to the scales provided for each criterion. One example of such a scale is shown in table 3 for the impact over welfare defined as “effects of EEff initiatives on the welfare of people, excluding consequences already
considered as the effects of pollution”. Examples include comfort at home and at the workplace, capacity of enjoying energy services unavailable before (e.g. due to high energy bills), time or space
inconveniences, aesthetics, etc.
Table 3 – Qualitative scale of measurement of the “Impact over welfare”
Value Description
Very negative The initiative produces very negative impacts in welfare or affects a significant number of persons Negative The initiative has few negative impacts or has a negative effect over a small number of persons Neutral The initiative does not affect the welfare of people
Positive The initiative has few positive impacts or has a positive effect over a small number of persons Very positive The initiative has very positive impacts or has a positive impact over a large number of persons Excelent The initiative has very positive impacts over a large number of persons
To note that although the original data for the selected initiatives indicate which ones were implemented by “agencies” and which ones were implemented by utilities, our test considered that each one could be implemented by both types of entities, implying that all the performances over the qualitative criteria were measured for each initiative.
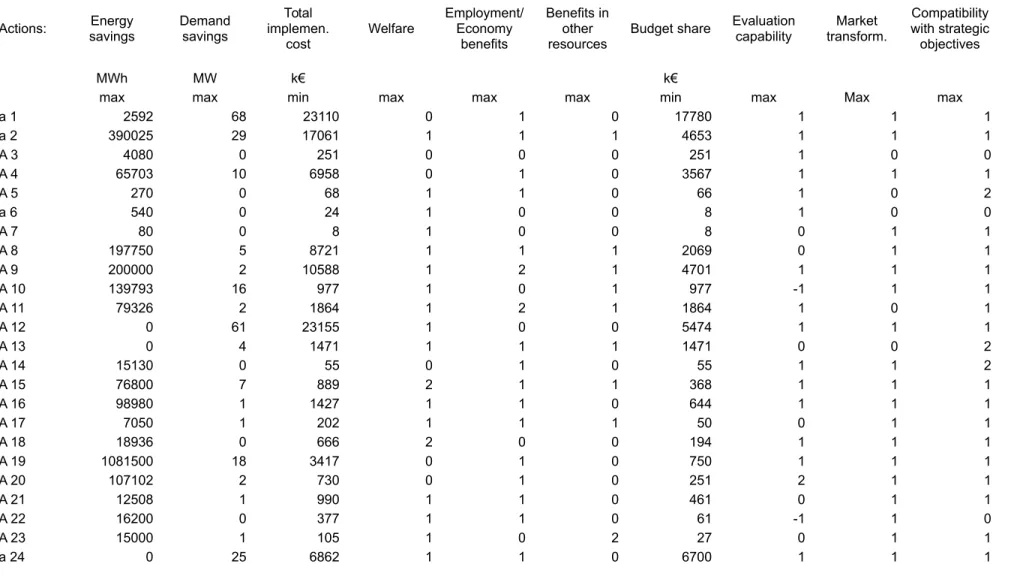
Table 4 – Example inputs to the evaluation model of the agency
Actions: savingsEnergy Demandsavings implemen.Total cost
Welfare Employment/Economy benefits
Benefits in other resources
Budget share Evaluationcapability transform.Market Compatibilitywith strategic objectives
MWh MW k€ k€
max max min max max max min max Max max
a 1 2592 68 23110 0 1 0 17780 1 1 1 a 2 390025 29 17061 1 1 1 4653 1 1 1 A 3 4080 0 251 0 0 0 251 1 0 0 A 4 65703 10 6958 0 1 0 3567 1 1 1 A 5 270 0 68 1 1 0 66 1 0 2 a 6 540 0 24 1 0 0 8 1 0 0 A 7 80 0 8 1 0 0 8 0 1 1 A 8 197750 5 8721 1 1 1 2069 0 1 1 A 9 200000 2 10588 1 2 1 4701 1 1 1 A 10 139793 16 977 1 0 1 977 -1 1 1 A 11 79326 2 1864 1 2 1 1864 1 0 1 A 12 0 61 23155 1 0 0 5474 1 1 1 A 13 0 4 1471 1 1 1 1471 0 0 2 A 14 15130 0 55 0 1 0 55 1 1 2 A 15 76800 7 889 2 1 1 368 1 1 1 A 16 98980 1 1427 1 1 0 644 1 1 1 A 17 7050 1 202 1 1 1 50 0 1 1 A 18 18936 0 666 2 0 0 194 1 1 1 A 19 1081500 18 3417 0 1 0 750 1 1 1 A 20 107102 2 730 0 1 0 251 2 1 1 A 21 12508 1 990 1 1 0 461 0 1 1 A 22 16200 0 377 1 1 0 61 -1 1 0 A 23 15000 1 105 1 0 2 27 0 1 1 a 24 0 25 6862 1 1 0 6700 1 1 1
Evaluation model parameters
Any multi-criteria evaluation model usually needs a set of parameters that represent the preferences of the decision makers and are the basis for producing meaningful results. The ELECTRE TRI method needs, as referred to previously, the definition of the categories in which the initiatives will be classified, by the specification of the associated reference profiles; the definition of the criterion weights; the definition of the cutting level (); and a set of indifference (qj), preference (pj) and optional veto (vj) thresholds for each criterion and reference profile.
The first two types of thresholds represent the acceptance of imprecision by considering indifferent two actions when their performances in each criterion j differ less than a specified amount qj, and by
considering that the transition from indifference to preference is not sharp but changes linearly from qj to
pj.
To reduce the data requirements, the indifference and preference thresholds were fixed as 1% and 10% of the performance ranges for each category (upper bound – lower bound). A possible improvement to this approach would be the use of the 95% and 5% percentiles to define the range instead of the maximum and minimum. In this way the indifference and preference thresholds should be less sensitive to outliers, but this was not tested in this case.
The remaining parameters were obtained by querying a set of five experts in EEff, acting as consultants for the potential decision makers. For the test data represented in this paper, the same five experts supplied information for the 4 different perspectives, as they represent consultants that could be used by any of the entities represented. The supplied parameters were then aggregated as explained in the next section.
Since the purpose of the classification is the decision about implementing each initiative, the following categories were defined: “To discard” (No), “To implement” (Yes), and two intermediate categories (“Maybe yes” and “Maybe not”).The group of experts was then asked for:
1. The criterion weights. Due to their nature, ELECTRE methods are insensitive to the scales in which each criterion is measured, hence the setting of weights is easier than for other kinds of methods. The query asked for a distribution of 100 “votes” among the different criteria. 2. The optional veto thresholds. The respondents were asked whether there are unacceptable
performances in any criterion that should prevent any initiative of being classified as “to implement” or that should force it “to be discarded”, independently of all the other criteria (i.e., even if it is very good in all the other criteria).
Values for the reference profiles, namely the lower bound for the category “Yes” and the upper bound for the category “No”.
The results of this query were aggregated, resulting in the definition of three reference profiles, defining the four categories, with the reference profile that separates the two intermediate categories being the mean of the other two. The weights were not aggregated, keeping the five sets of weights provided by the respondents. The software package IRIS allows the introduction of uncertainty in the weights (as well as in the cutting level). This feature reduces the data requirements and increases the confidence in the results, as explained in the following section.
Main results
The evaluation process started with the introduction of the performance data for the 24 initiatives according to the different criteria, the aggregated reference profiles and associated thresholds, and the weights, in the IRIS software. The cutting level was constrained to the interval [0.51, 0.67], these bounds corresponding to a simple majority requirement and a two thirds majority. The process was repeated for each set of weights, corresponding to each of the five experts, and for each perspective of evaluation (Agency, Regulator, Distribution utilities, Competitive supply companies).
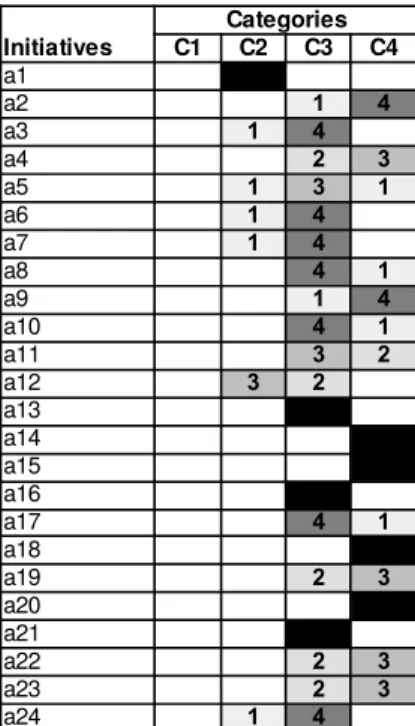
The results of this first step were aggregated, presenting the central estimate provided by IRIS (the classification that results from the central combination of admissible values for the parameters) for the different sets of weights for each perspective, as illustrated in figure 3 for the case of the Energy Agency. In this figure, the different grades of shade represent the degree of agreement among the respondents,
from white (none) to black (complete), with intermediate cases also represented by the numbers inside. The categories are represented by the columns: C1 – No; C2 – Maybe not; C3 – Maybe yes; C4 – Yes .
Categories Initiatives C1 C2 C3 C4 a1 0 5 0 0 a2 0 0 1 4 a3 0 1 4 0 a4 0 0 2 3 a5 0 1 3 1 a6 0 1 4 0 a7 0 1 4 0 a8 0 0 4 1 a9 0 0 1 4 a10 0 0 4 1 a11 0 0 3 2 a12 0 3 2 0 a13 0 0 5 0 a14 0 0 0 5 a15 0 0 0 5 a16 0 0 5 0 a17 0 0 4 1 a18 0 0 0 5 a19 0 0 2 3 a20 0 0 0 5 a21 0 0 5 0 a22 0 0 2 3 a23 0 0 2 3 a24 0 1 4 0
Figure 3 - Results of the use of different weights: Perspective of the Energy Agency.
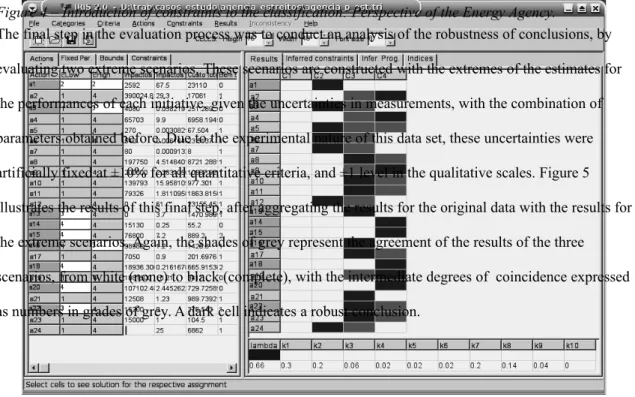
The second step was to reproduce these results with IRIS, allowing the weights to vary between the minimum and the maximum values obtained in the querying process for each criterion, and introducing constraints to the resulting classifications. The result of this process is a set of weights and a cutting level which satisfies all the constraints, representing the aggregated view of the group of experts, and which can be used for further analysis.
Figure 4 illustrates the introduction of constraints to the classifications according to the level of
agreement of results shown in figure 3. For instance, action a1 is restricted to category 2, since all sets of weights led to that result, action a2 is restricted to category 3 or 4 since all sets of weights led to this interval of categories, and so on. The constraints are shown in the Elow and Ehigh cells on the left side. The darker cells on the right side represent the proposed classification by IRIS, corresponding to the central combination of parameters shown at the bottom right. The grey cells on the right side represent the other possible classifications, corresponding to admissible combinations of parameters given the
Figure 4 – Introduction of constraints to the classification: Perspective of the Energy Agency.
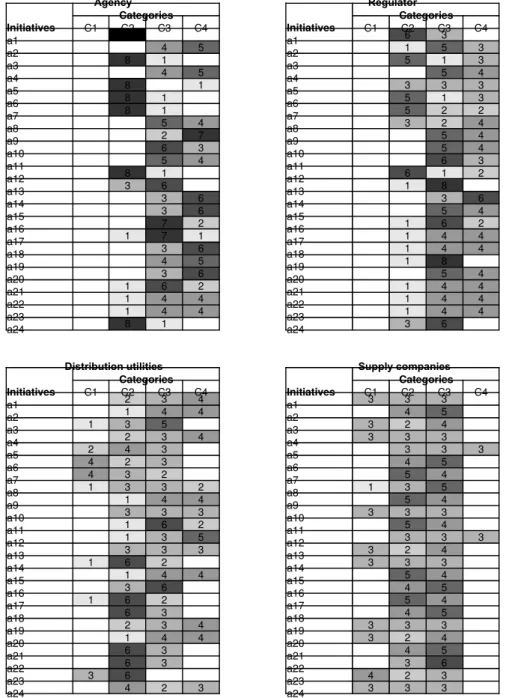
The final step in the evaluation process was to conduct an analysis of the robustness of conclusions, by evaluating two extreme scenarios. These scenarios are constructed with the extremes of the estimates for the performances of each initiative, given the uncertainties in measurements, with the combination of parameters obtained before. Due to the experimental nature of this data set, these uncertainties were artificially fixed at ±10% for all quantitative criteria, and ±1 level in the qualitative scales. Figure 5 illustrates the results of this final step, after aggregating the results for the original data with the results for the extreme scenarios. Again, the shades of grey represent the agreement of the results of the three scenarios, from white (none) to black (complete), with the intermediate degrees of coincidence expressed as numbers in grades of grey. A dark cell indicates a robust conclusion.
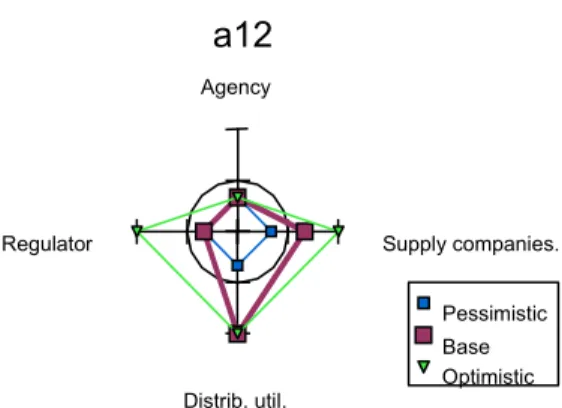
An interesting analysis can be performed by a simultaneous view of the results on the four perspectives. In this case it is possible to realise if one initiative is attractive to all the actors or just some of them. In figure 6, the four axes represent the four perspectives, and are scaled from 1 (Category “No”) in the centre to 4 (Category “Yes”) in the extremes, and the inner circle represents the boundary between the two intermediate categories. The example illustrated in this figure shows a case where the initiative has low interest for the public entities (the lines for the base case and the pessimistic scenarios are completely inside the circle, meaning they have a result of “probably not” or worse), but a high interest for the utilities.
Figure 5 – Robustness of results: presentation of the three scenarios.
Agency Regulator Categories Categories Initiatives C1 C2 C3 C4 Initiatives C1 C2 C3 C4 a1 0 9 0 0 a1 0 6 3 0 a2 0 0 4 5 a2 0 1 5 3 a3 0 8 1 0 a3 0 5 1 3 a4 0 0 4 5 a4 0 0 5 4 a5 0 8 0 1 a5 0 3 3 3 a6 0 8 1 0 a6 0 5 1 3 a7 0 8 1 0 a7 0 5 2 2 a8 0 0 5 4 a8 0 3 2 4 a9 0 0 2 7 a9 0 0 5 4 a10 0 0 6 3 a10 0 0 5 4 a11 0 0 5 4 a11 0 0 6 3 a12 0 8 1 0 a12 0 6 1 2 a13 0 3 6 0 a13 0 1 8 0 a14 0 0 3 6 a14 0 0 3 6 a15 0 0 3 6 a15 0 0 5 4 a16 0 0 7 2 a16 0 1 6 2 a17 0 1 7 1 a17 0 1 4 4 a18 0 0 3 6 a18 0 1 4 4 a19 0 0 4 5 a19 0 1 8 0 a20 0 0 3 6 a20 0 0 5 4 a21 0 1 6 2 a21 0 1 4 4 a22 0 1 4 4 a22 0 1 4 4 a23 0 1 4 4 a23 0 1 4 4 a24 0 8 1 0 a24 0 3 6 0
Distribution utilities Supply companies
Categories Categories Initiatives C1 C2 C3 C4 Initiatives C1 C2 C3 C4 a1 0 2 3 4 a1 3 3 3 0 a2 0 1 4 4 a2 0 4 5 0 a3 1 3 5 0 a3 3 2 4 0 a4 0 2 3 4 a4 3 3 3 0 a5 2 4 3 0 a5 0 3 3 3 a6 4 2 3 0 a6 0 4 5 0 a7 4 3 2 0 a7 0 5 4 0 a8 1 3 3 2 a8 1 3 5 0 a9 0 1 4 4 a9 0 5 4 0 a10 0 3 3 3 a10 3 3 3 0 a11 0 1 6 2 a11 0 5 4 0 a12 0 1 3 5 a12 0 3 3 3 a13 0 3 3 3 a13 3 2 4 0 a14 1 6 2 0 a14 3 3 3 0 a15 0 1 4 4 a15 0 5 4 0 a16 0 3 6 0 a16 0 4 5 0 a17 1 6 2 0 a17 0 5 4 0 a18 0 6 3 0 a18 0 4 5 0 a19 0 2 3 4 a19 3 3 3 0 a20 0 1 4 4 a20 3 2 4 0 a21 0 6 3 0 a21 0 4 5 0 a22 0 6 3 0 a22 0 3 6 0 a23 3 6 0 0 a23 4 2 3 0 a24 0 4 2 3 a24 3 3 3 0
Figure 6 – Simultaneous view of the results on all the perspectives, for one initiative.
For illustrative purposes, if the California cost-benefit tests (CPUC, 2001) had been used, their results could be the ones expressed in table 4 (depending on the values used for marginal costs and externalities). A true comparison cannot be made due to the different foundations of both approaches, but there are a few remarks that can be expressed.
The first remark regards the difficulty in finding the equivalent perspective. The Agency and the Regulator address the societal perspective, but the former has its own constraints and objectives not addressed in the Societal Cost test. The Regulator must also consider the impact on rates expressed through the Ratepayer Impact Measure (RIM) test and usually is more concerned with the Total Resource Cost than with its societal variant. The distribution companies have to deal also with two different perspectives, the reduction in costs vs. the impact on rates. The Supply companies, being unable to recover costs through rates, need to consider the RIM test as a measure of their costs and also the Participant test (not shown), indicating the attractiveness of the initatives as a marketing tool. The combination of different B/C or VAL results is not clear and the lack of consideration of several impacts, due to the impossibility of measuring them in monetary units results in a poor decision aid.
There are several contradictions between the results, as in initiatives a4, a9, a12 and a24 for the Agency and the societal cost-benefit test, or initiative a6 on the Distribution utility perspective and the Utility Cost Test. As an example, for the perspective of the Agency, initiative a12 is robustly classified in the category “Maybe not”, however, its cost-benefit results in the societal perspective contradicts this classification, indicating both the Benefit/Cost ratio and the Net Present Value of benefits that its benefits outweight its costs by a considerable amount. These contradictions result from the differences of both approaches: Cost-Benefit analysis has
Agency Regulator Distrib. util. Supply companies.
a12
Pessimistic Base Optimisticcompensation effects; ELECTRE TRI has veto effects, hence a bad performance in one criterion may impose a veto to any good classification even if the performances in all the other criteria are excellent. There are impacts which are not considered in the cost-benefit approach and last but not the least, the cost-benefit approach doesn’t reflect the relative importance of each impact to the decision maker. Instead it uses values which sometimes only reflect the way some impacts can be measured in currency unit and not their actual value.
The uniqueness of the results of the cost-benefit analysis may lead to a false confidence. The opacity of the calculations gives no place for questioning. The multi-criteria approach has the capability of capturing the natural uncertainty associated with the decision maker's preferences. Therefore, the knowledge of the admissible outputs as a result of imprecise inputs contributes to creating confidence and making the results understandable.
Table 5 – Results from the application of the California tests of cost-benefit analysis.
Societal Cost Total Resource Cost
Ref B/C NPV (k€) Ref B/C NPV (k€) a1 0,75 -5798,17 a1 0,75 -5857,55 a2 1,56 9616,87 a2 1,04 682,38 a3 0,88 -31,14 a3 0,49 -127,78 a4 0,83 -1200,31 a4 0,61 -2705,4 a5 0,21 -53,41 a5 0,12 -59,6 a6 1,2 4,66 a6 0,67 -7,71 a7 0,52 -3,83 a7 0,29 -5,66 a8 1,29 2507,66 a8 0,72 -2421,79 a9 0,99 -151,58 a9 0,55 -4733,08 a10 11,21 9973,68 a10 7,93 6771,38 a11 2,42 2640,6 a11 1,36 663,18 a12 1,37 8654,29 a12 1,37 8654,29 a13 1,94 1378,63 a13 1,94 1378,63 a14 14,66 753,98 a14 8,38 407,39 a15 6,32 4728,13 a15 4,34 2968,84 a16 3,63 3755,99 a16 2,04 1488,61 a17 2,86 374,82 a17 2,06 213,32 a18 1,48 322,21 a18 0,83 -111,57 a19 16,95 54510,42 a19 9,7 29735,97 a20 8,09 5170,32 a20 4,72 2716,87 a21 0,91 -93,37 a21 0,61 -389,65 a22 2,27 477,38 a22 1,21 80,4 a23 9,02 838,33 a23 5,44 464,42 a24 1,94 6447,6 a24 1,94 6447,6
Utility Ratepayer Impact Measure
Ref B/C NPV (k€) Ref B/C NPV (k€)
a1 1,74 23047,07 a1 0,5 -31173,95
a2 6,7 25787,68 a2 0,73 -11477,17
a4 2,11 5845,32 a4 0,57 -5701,19 a5 0,21 2,94 a5 0,16 -71,85 a6 3,66 21,23 a6 0,55 -22,05 a7 0,51 2,28 a7 0,29 -10,16 a8 5,41 9177,96 a8 0,7 -4747,79 a9 2,17 7991,94 a9 0,59 -7137,43 a10 13,98 11868,19 a10 0,96 -527,32 a11 2,41 3761,01 a11 0,78 -1275,96 a12 11,47 58202,29 a12 1,72 26385,36 a13 4,3 5380,88 a13 0,84 -1198,63 a14 14,59 685,33 a14 0,85 -144,08 a15 18,46 5671,59 a15 0,77 -2069,07 a16 7,87 4075,22 a16 0,64 -2802,65 a17 14,5 639,82 a17 1 0,15 a18 4,96 753,06 a18 0,58 -704,53 a19 76,94 49974,74 a19 0,94 -3550 a20 23,92 5038,42 a20 0,78 -1668,79 a21 2,31 859,24 a21 0,66 -555,06 a22 13,26 628,66 a22 0,58 -594,9 a23 37,33 840,59 a23 0,73 -369,33 a24 3,93 18746,84 a24 0,44 -33706,1
Concluding remarks
This paper presents a proposal for a multi-criteria evaluation of initiatives, avoiding the need for converting all the impacts of the initiative to currency units, and incorporating the actual preferences of decision makers in the analysis.
The first advantage refers to the inclusion of impacts usually not considered due to the difficulty or impossibility of being measured in monetary units. The second one deals with enabling the decision maker to base his/her decision on his/her own values, instead of using the conversion rules hidden in the monetisation formulae. These advantages provide more confidence in the decision suggested, also due to the absence of compensation effects (a good performance in one criterion does not hide a poor
performance in another) and to the possibility of conducting an analysis to assess the robustness of the decisions regarding the uncertainty of the input data.
A process of dealing with multiple views for the parameter data was also outlined, making use of the possibilities offered by the IRIS software, namely the capability of accepting imprecision in the input data.
The application of the proposed methodology to a set of initiatives, for testing purposes allowed us also to propose ways of dealing with the need for a considerable amount of data, for setting the parameters of the decision models. The definition of a decision maker’s preferences is usually not an easy process, and many would prefer relying on others’ values as a way of avoiding this step. However, the capability of using imprecision in inputs and the analysis of the robustness of decisions are certainly useful aids for making this process less painful and creating confidence in the results. The use of different views, using for instance a group of experts, is a practical way for obtaining the parameters needed.
In opposition to the cost-benefit approach in which the decision makers usually have no intervention in the definition of the technical parameters, our approach offers them all the information, encourages their involvement in the whole process, improves the knowledge about the EEff initiatives and their own preferences for making sounder decisions, and provides a sense of ownership of the evaluation model. Developments currently underway include: – the measurement of the impacts that in this work were mostly assessed using qualitative scales; – the interaction with multiple decision makers and the
aggregation of their information; – a specific software tool to include the procedures of aggregation of multiple preference information and the analysis of the robustness of conclusions.
References
Association for the Conservation of Energy, 2000. Energy efficiency and jobs: UK issues and case studies. Report, Energy Saving Trust.
CEC&CPUC, 1983. Standard Practice for Cost-Benefit Analysis of Conservation and Load Management Programs. California Public Utilities Commission and California Energy Commission.
CEC&CPUC, 1987. Standard Practice Manual: Economic Analysis of Demand-Side Management Programs. California Public Utilities Commission and California Energy Commission.
Clinch, J. P., Healy, J. D., Jan. 2001. Cost-benefit analysis of domestic energy efficiency. Energy Policy 29 (2), 113–124.
CPUC, 2001a. California Standard Practice Manual : Economic Analysis of Demand-Side Programs and Projects. California Public Utilities Commission.
CPUC, 2001b. Energy Efficiency Policy Manual. California Public Utilities Commission, version 1. CPUC, 2003. Energy Efficiency Policy Manual. California Public Utilities Commission, version 2. Davis, D. L. et al, 2000. Ancillary benefits and costs of greenhouse gas mitigation. In: Ancillary Benefits and Costs of Greenhouse Gas Mitigation. Intergovernmental Panel on Climate Change (IPCC), OECD. Dias, L.C., V. Mousseau, 2003. IRIS: A DSS for Multiple Criteria Sorting Problems” Journal of Multi-Criteria Decision Analysis 12, 285-298.
Dias, L., Mousseau, V., Figueira, J., Clímaco, J., 2002. An aggregation/disagregation approach to obtain robust conclusions with ELECTRE TRI. European Journal of Operational Research 138, 332–348. Eto, J., Prahl, R., Raab, J., Schlegel, J., 1998. Proposed recommendations to CBEE on program classification, cost effectiveness, capability of transforming markets, and market assessment and evaluation. http://cpuc.ee.support.net/library/guide2-4.doc (last consulted in 18/12/2002)
European Commission, 1999b. ExternE: Externalities of Energy - National Implementation. Directorate-General XII.
Geller, H., DeCicco, J., Laitner, S., 1992. Energy efficiency and job creation. Report ED922, American Council for an Energy Efficienct Economy.
Hobbs, B. F., Horn, G. T. F., 1997. Building public confidence in energy planning: a multimethod MCDM approach to demand-side planning at BC gas. Energy Policy 25 (3), 357–375.
Krewitt, W., 2002. External costs of energy - do the answers match the questions? looking back at 10 years of ExternE. Energy Policy 30, 839–848.
Mousseau, V., Slowinski, R. and Zielniewicz, P., 1999. A user-oriented implementation of the ELECTRE-TRI method integrating preference elicitation support. Computers & Operations Research, 27, 757-777. Neves, L. M. P., Martins, A. G., Antunes, C. H., Dias, L. C., 2004. Using SSM to rethink the analysis of energy efficiency initiatives. Journal of the Operational Research Society 55, 968–975.
Neves, L. P., Martins, A. G., Antunes, C. H., Dias, L. C., 2005. Building a Decision Model to Appraise Energy Efficiency Initiatives. Research Report No. 1/2005. INESC Coimbra
Nicolls, A. K., LaMontagne, J., Jones, R. E., Shankle, S. A., 1994. Estimating the impacts of federal efforts to improve energy efficiency: The case of buildings. Tech. rep., the U.S. Department of Energy, presented at The World Oil & Gas Industrial 16th North American Conference: In the 21st Century, Dallas, Texas, November 1994.
Pagliano, L., Alari, P., Irrek, W., Leprich, U., Ruggieri, G., Thomas, S., 2001. Price regulation to remove EEff-DSM disincentives and pressure for increased energy sales in monopoly segments of restructured electricity and gas markets. the Multiple Drivers Target (MDT) tariff scheme. In: European Council for an Energy Efficient Economy Summer Study.
Roy, B. (1991). The outranking approach and the foundations of ELECTRE methods, Theory and Decision 31, 49-73.
SRCi, Fev. 1996. European B/C Analysis Methodology (EUBC) - A Guidebook For B/C Evaluation of DSM and Energy Efficiency Services Programmes. A Project Advisory Committee and SRC International ApS, prepared for the European Commission (DG XIIV).
Sundqvist, T., 2004. What causes the disparity of electricity externality estimates? Energy Policy 32, 1753–1766.
Wade, J., Wiltshire, V., Scrase, I., 2000. National and local employment impacts of energy efficiency investment programmes. Final report to the european commission, Association for the Conservation of Energy.
Yu, W., April 1992. ELECTRE TRI: Aspects méthodologiques et manuel d’utilisation. Document du LAMSADE 80, Université Paris-Dauphine.
Acknowledgements
This research has been partially supported by FCT and FEDER under Project Grants POCI/ENR/57082/2004 and POCI/EGE/58371/2004