EXPLAINING THE IMPACT OF MUTUAL FUND FAMILY SIZE ON THE FLOW-PERFORMANCE RELATIONSHIP: INTERNATIONAL EVIDENCE
XIAYUE LIU
Dissertationsubmitted as partial requirement for the conferral of Master in Finance
Supervisor:
Prof.
António Manuel Corte Real de Freitas Miguel,
ISCTE Business School, Department of FinanceI
Abstract
In this paper, we use data from 34 countries around the world to study the shape of the flow-performance relationship. More particularly, we study the impact of fund family size on the flow-performance sensitivity. We use mutual fund industry development variables and financial development variables as proxies for investor‟s sophistication in order to explain differences in how mutual fund investors react to fund‟s past performance when these belong to large fund families. The results show that, in more sophisticated markets, investors react more to past performance when funds belong to large fund families by selling more bottom performers and buying less top performers.
JEL code: G15, G23
Keywords: Equity mutual funds, Flow-performance relationship, Fund family size, Investor sophistication
II
Resumo
Neste estudo, usamos dados de 34 países em todo o mundo para estudar a sensibilidade dos fluxos monetários à performance dos fundos de investimento. Mais particularmente, estudamos o impacto de o fundo pertencer a uma família de maior dimensão, medida pelos seus ativos líquidos, na sensibilidade dos investidores à sua performance passada. Usamos variáveis de desenvolvimento da indústria de fundos de investimento e variáveis de desenvolvimento dos mercados financeiros como indicadores para a sofisticação dos investidores, tendo como objetivo explicar as diferenças na forma como estes reagem ao desempenho histórico do fundo, quando este pertence a famílias com mais ativos. Os resultados mostram que, em mercados mais desenvolvidos, os investidores reagem mais à performance se os fundos pertencerem a grandes famílias, desinvestindo mais se o desempenho do fundo for baixo e investindo menos quando é elevada.
Código JEL: G15, G23
Palavras chave: Fundos de investimento, Relação fluxo-performance, Dimensão do fundo, Sofisticação dos investidores
Ⅲ
Acknowledgements
I express my acknowledgements to everyone who helped me to accomplish this master thesis, especially to my supervisor Professor Antonio Freitas Miguel, for his orientation, guidance and helpful feedback from the start to the finish of this study.
I would also like to thank people who are the most important in my life, my dear parents and my boyfriend, for their continuous support and patience during good and bad times. Last but not least, financial support from Fundação para a Ciência e Tecnologia is greatly acknowledged (PTDC/IIM-FIN/1500/2014).
Ⅳ Index of content Abstract ... Ⅰ Resumo ... Ⅱ Acknowledgements ... Ⅲ Index of content ... Ⅳ 1. Introduction ... 1 2. Literature review ... 2
3. Data and Methodology ... 6
3.1 Sample description ... 6
3.2 Methodology and Variables Construction ... 10
3.2.1 Fund flow ... 10
3.2.2 Performance measurement ... 11
3.2.3 Additional fund-level control variables ... 13
3.2.4 Country-level variables... 17
3.2.5 Measuring the fund flow-performance relationship ... 21
3.2.6 The impact of fund family size to flow-performance sensitivity across countries ... 23
4. Empirical results ... 24
4.1 The impact of having big fund family size on flow-performance sensitivity ... 24
4.2 Big fund family size, investor sophistication and flow-performance sensitivity 29 5. Robustness tests ... 32
6. Conclusion ... 32
Appendix I: Variables definitions ... 36
Ⅴ
Panel B: Country characteristics ... 37
Appendix II: Robustness ... 38
Index of tables Table 1. Number of funds and total net asset at the end of 2015 ... 9
Table 2. Fund-level control variables ... 15
Panel A. Fund level variables averaged across quarters by country ... 15
Panel B. Pairwise correlation of fund-level variables ... 16
Table 3. Country level variables averaged across countries ... 20
Table 4. The flow- performance relationship across all countries, non-US, and US ... 26
Panel A. Linear approach ... 26
Panel B. Three-piecewise linear approach ... 27
Table 5. The impact of development using a three-piecewise linear approach. (For four-factor alpha) ... 30
Panel A. Mutual fund industry development ... 30
Panel B. Financial development ... 31
Table 6. The flow-performance relationship using raw returns and one-factor alpha .. 38
Panel A. Measuring the flow-performance relationship using a linear approach 38 Panel B. Measuring the flow-performance relationship using a three-piecewise linear approach ... 39
Table 7. The impact of development using raw returns and one-factor alpha ... 39
Panel A. The impact of development using a three-piecewise linear approach for raw returns. ... 40
Ⅶ
Panel B. The impact of development using a three-piecewise linear approach for one-factor alpha. ... 41 Table 8. Additional country-level variables ... 42 Panel A. Summary statistics ... 42 Panel B. The impact of development using a three-piecewise linear approach (for four-factor alpha). ... 43
List of acronyms
EFAMA - European Fund and Asset Management Association ICI - Investment Company Institute
1
1. Introduction
Overall, the mutual fund industry has grown dramatically for decades as more and more investors have put their savings into mutual funds. By the end of 2017, the world mutual fund industry managed financial assets has increased by more than 800 percent over the previous twenty years; the value of total net assets under management hits $49.3 trillion of U.S. dollars in 2017, including 21.8 trillion from equity funds (see annual report of European Fund and Asset Management Association (EFAMA, 2017) and the Investment Company Institute (ICI, 2017)), comparing to $6.1trillion in 1996. In terms of number of the mutual funds, there are a total of 114,131 mutual funds around the world at the end of 2017.
How the performance of equity mutual funds relates to fund characteristics has been a prevalent subject in the mutual fund literature which explain differences in performance with fund characteristics, e.g., fund size, age, fees and expenses, fund family, style, and fees (see, e.g. Carhart 1997, and Chen et al., 2004). Ferreira et al. (2012) show that differences in fund performance can also be explained with county-level characteristics, namely economic, and financial development and institutional variables.
As for the relation between fund flow and performance, in the U.S., Brennan and Hughes (1991), and Kim (2010) argue that the shape of this relationship is linear, while Chevalier and Ellison (1997) and Sirri and Tufano (1998) document a non-linear relation between flows and performance. Ferreira et al. (2012) use an international sample to show that the flow-performance relationship varies across countries.
This dissertation uses an international sample of mutual funds to study the impact of mutual fund family size on the flow-performance relationship. The first step is to determine the shape of the flow-performance relationship in each country and across countries. Secondly, we analyze if fund family size affects the flow-performance relationship in the different country in our sample. Finally, we aim to explain if there are differences across countries in the family size effect. More particularly, we will focus on whether the level of investor‟s sophistication in the country explains these differences.
2
To build a framework of our paper, we make some hypotheses by combining research objective and conclusions of the relevant literature. Firstly, the size of the fund family is expected to affect the flow-performance relationship. Secondly, in consideration of investors from more developed markets are better able to make objective judgment, we admit larger families tend to have greater influence on less sophisticated investors; besides, in less developed countries, investors are more vulnerable in different situations and will react more to past performance of funds, larger mutual fund families are expected to increase the convexity of the flow-performance relationship, they tend to buy more winners and sell less losers.
The main results show that when funds belong to large fund families, investors in more sophisticated markets react more to past performance by selling more losers and buying less winners.
To some extent, the conclusions in this paper are a reference for both worldwide fund managers, when rebalancing their portfolios, and worldwide fund investors, when making their investments. To the best of our knowledge we are the first to study the effect of fund family size on the flow-performance relationship using a worldwide mutual fund database.
The thesis is structured as follows. Section 2, presents the literature review and the main hypothesis, Section 3 presents the data and methodology, Section 4 shows the empirical results, Section 5 presents robustness tests and Section 6 concludes.
2. Literature review
There are numerous papers that demonstrate that past performance of mutual funds is a critical determinant of decision-making by investors. The very first papers are Spitz (1970) and Smith (1978). Spitz (1970) uses twenty US mutual funds over an eight-year period from 1960 to 1967 as samples. His study concludes the positive relationship between net cash inflows and net performance of mutual funds. Smith (1978) is also one of early scholars who paid attention to the flow-performance relationship. He used fund performance rankings to show that net new money is positively correlated to risk-adjusted fund performance.
3
Recent studies include Ferreira et al. (2012), Huang et al. (2007), Kim (2010) and Spiegel and Zhang (2013). However, the general shape of fund flow-performance relationship remains controversial. Some literature shows a linear relationship (e.g., Kim, 2010; Spiegel and Zhang, 2013), while others conclude that the shape of flow-performance relationship is convex (e.g., Ferreira et al., 2012; Huang et al., 2007). The convex fund flow-performance relationship suggests that investors tend to respond asymmetrically to past fund performance, i.e., a strongly performing fund will attract new money inflow but when performance is poor, the cash outflow is relatively weak.
Fund family has also been widely studied in the mutual fund literature. According to Nanda, Wang, and Zheng (2004), mutual funds may benefit a lot from the family structure for good reasons, such as larger scale capital, more financing channels and more established institution. Their data sample covers U.S. open-end mutual funds over the period from 1992 to 1998 and the results show that more than 80% of mutual funds are members of fund families. Using data from U.S. domestic actively managed mutual funds from 1991 to 2001, Gaspar, Massa, and Matos (2006) show that in terms of the number of different equity mutual funds, more than 90% of all funds belong to fund families, and over 98% of all assets under management in all U.S. equity funds are managed by these families. From here we see that to have a more comprehensive understanding of equity mutual funds, it is important to have a deeper understanding of mutual fund family and the inherent connection between the fund and its family.
Since a fund family includes all funds managed by the same fund management company, there are several potential factors that can be used to explain the differences between single fund from the same family and fund families.
The diversity of mutual funds is one of important concerns that investors pay attention to. Massa (2003) shows that performance-related characteristics of funds are not the only factors affecting investor‟s decision. The heterogeneity among funds in the same family, in other words category proliferation of mutual funds, is another cause to attract new cash inflows to fund families, since investors can switch across different funds from the same family at low or even no cost. Another conclusion of this paper is that the degree of product differentiation, i.e., the dispersion in the fees, the performance of the fund family
4
negatively affects performance of funds and positively affects fund proliferation. Mamaysky and Spiegel (2002) and Siggelkow (2003) show fund management companies provide funds with different investment strategy and style for investors depending on whether they are more or less risk-prone, and fund families attempt to attract more inflows and generate high profits by enhancing their fund‟s differentiation.
Mutual fund families have considerable capacity to affect the performance of their funds, especially the fund families with larger size. Guedj and Papastaikoudi (2004) show that mutual funds with better performance that belong to larger family have more resources available to persist their high profits owing to unevenly allocation of their fund family. Their results also indicate that the preferential treatment will transfer wealth from funds performing worse to the good ones by using the management fees collected from all its funds. Therefore, the potential investor discrimination is not a rare phenomenon. Gaspar, Massa, and Matos (2006) find that the performance gap between similar funds from the same family and their results show that fund family may allocate more resources to bottom ranking funds in the family to maintain a higher performance persistence. This distortion explains why funds with high fees or high past performance consistently over-perform the others funds belonging to the same family.
Spillovers effect of a star fund in mutual fund families is deemed to be a reason why fund flows do not only depend on funds past performance, but they are also influenced by others funds included in their fund family. Verbeek and Huij (2007) investigate the spillover effects in mutual fund families generated by funds with high marketing expenses that make the entire family more visible to investors. The results of their tests show that other family members with low marketing expenses benefit from having a star mutual fund in the same family. These funds tend to have stronger cash inflows after positive returns and smaller outflows after negative returns in comparison with funds from families paying lower marketing expenses. Gallaher, Kaniel, and Starks (2006) study the relationship between inflows of fund and fund families‟ management. Their results show that the cash flows to the fund family is impacted nonlinearly by fund families‟ strategic decision, for instance, the level of advertising. To some extent more advertising have significant positive effect on family‟s cash flows. This study also shows
5
that advertising expenditures are positively related to family size, larger fund families has more advantages than smaller families in branding and advertising efforts, since they tend to have more total management fees and higher cash flows.
Funds can benefit a lot from their large size families, especially families with great reputation and resources caused by their scale and appropriate branding strategies. Li and Liu (2010) analyze the reputation stretching phenomenon using newly issued China mutual funds data from 2004 to 2010, and find that managers with high reputation will attract more cash inflows to funds and create spillover effect in their fund families. Moreover, investor‟s returns improve significantly by investing on new funds with a high reputation manager.
Chen et al. (2004) demonstrates that larger fund families tend to benefit from economies of scale for their average lower trading commissions and lending fees. Additionally, big families have more medium to get valid information and experience to create a new fund with low cost, which makes them more attractive to investors, therefore easily improving their cash inflows.
Large fund family size is widely regarded as a critical factor for scale economies; although this does not always translate into benefits for investors. Using French mutual funds data, Tran-Dieu (2015) shows that funds tend to transfer most of economies of scale in portfolio management and distribution services. In other words, only slight scale economies are passed on to investors by decreasing total costs while the total fund net assets increase.
On the other hand, after analyzing eight large mutual fund families, Latzko (2001) show that the phenomenon of economies of scale only exists in two fund families. For the eight mutual fund families, the “other” administrative expenses are, on average, considered as reliable sources of scale economies, nevertheless, these account for only a small part of total costs. Latzko (2001) also demonstrates that management and distribution fees both tend to be subject to diseconomies of scale in large mutual fund families. Bhojraj, Cho, and Yehuda (2010) show that the previously remarkable recorded performance of large fund families was not caused by their analytical skill to pick stock or cost economies of scale, instead, the principal reason is the favored access. Their results support the
6
liquidity hypothesis, which indicates that larger funds are asked for higher requirements for effective information mining and delving ability. Therefore, comparing with small funds, funds with large size tend to generate lower realistic returns.
Ferreira et al. (2012) show that funds with better performance tend to be managed by larger companies, but they also find mixed evidences of the relationship between net flows and fund family size using a worldwide sample. To be specific, fund family size is positively related with flows, but outside the U.S. the results are not significant. Their results also indicate that the shape of flow-performance relationship is less convex in more developed countries. They use differences in economic development, financial development, and mutual fund industry development to explain differences in the flow-performance shape across countries.
We have three hypotheses in this paper, including Hypothesis 1: Mutual fund family size explains the flow-performance relationship (e.g., Nanda, Wang, and Zheng, 2004; Guedj, and Papastaikoudi, 2004); Hypothesis 2: The impact of mutual fund family size on the flow-performance relationship varies across countries, and Hypothesis 3: In less developed countries, since investors are more likely to regard large fund family as a better characteristic and overrate them, their convexity of the flow-performance relationship will be increased by larger mutual fund families(e.g., Ferreira et al., 2012). 3. Data and Methodology
3.1 Sample description
Our data on equity mutual funds are from the Lipper Hindsight database, which collects their data directly from fund management companies and includes both active and dead funds. This means that our dataset is survivorship-bias free. The initial sample contains 1,160,877 equity funds from 34 countries, covering the period from 1999 to 2015, including both domestic equity funds and international equity funds.
To check the coverage of our dataset, the comprehensive nature of the Lipper Hindsight database would be demonstrated by comparing its contents with EFAMA, 2016 aggregate statistics. At the end of 2015, EFAMA reported 34,060 equity funds and $13.47 trillion U.S. dollars total net assets (TNA) of equity funds summed across all
7
share classes, while the Lipper database reported 25,266 equity funds and $12.84 trillion U.S. dollars of TNA of equity funds, which means that our initial sample represents 74.2% of the number of equity funds reported in EFAMA. Regarding the total net assets value, the coverage of our dataset is 95.3%.
Although multiple share classes are listed separately in Lipper dataset, they have the same returns before expenses and loads, the same manager and the same holdings. To avoid counting the same fund twice, we eliminate it from the initial database. We impose a few additional filters for better focusing on actively managed equity funds. First, indexing-tracking funds, exchange trade funds, closed-end funds, funds-of-funds and offshore funds are excluded. Second, in our equity funds sample the fund sizes and the returns are calculated using quarterly data and monthly data respectively. For assuring enough time series observations to calculate risk-adjusted performance measures we impose a minimum of 24 continuous monthly observations of fund returns.1 Third, in order to reinforce the persuasive power of our results for different countries, a minimum of ten funds per quarter in each country is required. Finally, our observations of funds are required to have data on size (TNA), family size, age, total expense ratio and loads (front end and back-end loads), which leads to a final sample of 26,197 open-ended actively managed equity funds from 34 countries spanning the period 1999 to 2015.
Both across countries stock market run-up period (in 2003 and 2009) and the global financial crisis in 2007-2008 are included in our period. Thus we are able to draw more meaningful conclusions using this representative time window since it contains different stock market situations.
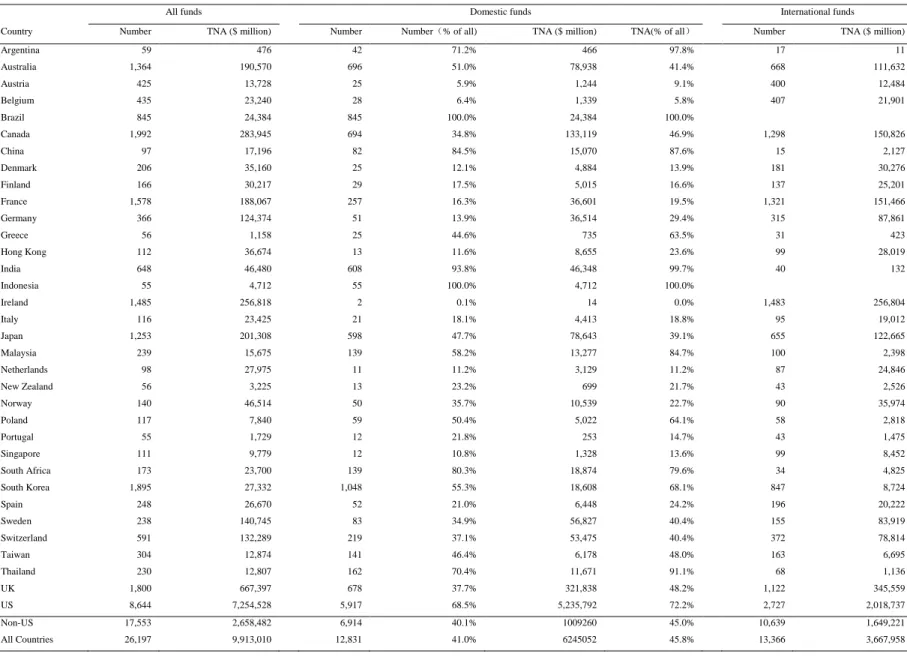
Table 1 presents the number of funds and the TNA under management (fund value sum of all share classes in USD millions) of our sample by country at the end of 2015. Non-U.S. and all countries totals are also presented. We split the sample into domestic and international funds. According to Lipper, a fund is recognized as a domestic fund if it invests in its domicile country or, as an international fund if geographical focus of the investment is different from the fund domicile country.
1
8
There are altogether 26,197 mutual equity funds and 9.91 trillion USD of assets under management in the sample at the end of 2015. The number of funds and TNA managed across countries are quite different (see columns (2)-(3)). More concretely, the U.S. is the country with the highest number of mutual funds and the largest TNA managed. At the end of 2015, 8,644 mutual equity funds and 7.25 trillion USD of TNA, account for 33.0% of the total number of funds and 73.2% of the TNA managed in our sample, respectively. Canada, South Korea and the United Kingdom account for 7.6%, 7.2% and 6.9% of the total number of mutual equity funds, respectively. As for the TNA managed, apart from the U.S., the United Kingdom, Canada and Ireland are the countries that dominate the top of the table. The total assets under management in the United Kingdom is approximately 0.67 trillion USD, accounting for 6.7% of the total TNA in our database. Canada and Ireland represent 2.9% and 2.6% of the total TNA, respectively.
Regarding funds‟ geographic investment styles, columns (4)-(7) present the number of funds and TNA for domestic and, columns (8)-(9) present the number of funds and TNA for international funds. Domestic funds account for 41.0% of the number of funds and 45.8% of the TNA in the total sample. Domestic funds are dominant in countries such as Brazil, Indonesia and India as these countries have relatively few international funds. In comparison, the domestic funds only account for 0.1% of the total number of funds and nearly 0% of the total TNA in Ireland. The other countries with higher percentage of international funds are Austria, Belgium, and Singapore; in these countries, international funds represent 94.1%, 93.6% and 89.2% of the total number of equity funds and 90.9%, 94.2% and 86.4% of the TNA, respectively.
9
Table 1. Number of funds and total net assets at the end of 2015
All funds Domestic funds International funds
Country Number TNA ($ million) Number Number(% of all) TNA ($ million) TNA(% of all) Number TNA ($ million)
Argentina 59 476 42 71.2% 466 97.8% 17 11 Australia 1,364 190,570 696 51.0% 78,938 41.4% 668 111,632 Austria 425 13,728 25 5.9% 1,244 9.1% 400 12,484 Belgium 435 23,240 28 6.4% 1,339 5.8% 407 21,901 Brazil 845 24,384 845 100.0% 24,384 100.0% Canada 1,992 283,945 694 34.8% 133,119 46.9% 1,298 150,826 China 97 17,196 82 84.5% 15,070 87.6% 15 2,127 Denmark 206 35,160 25 12.1% 4,884 13.9% 181 30,276 Finland 166 30,217 29 17.5% 5,015 16.6% 137 25,201 France 1,578 188,067 257 16.3% 36,601 19.5% 1,321 151,466 Germany 366 124,374 51 13.9% 36,514 29.4% 315 87,861 Greece 56 1,158 25 44.6% 735 63.5% 31 423 Hong Kong 112 36,674 13 11.6% 8,655 23.6% 99 28,019 India 648 46,480 608 93.8% 46,348 99.7% 40 132 Indonesia 55 4,712 55 100.0% 4,712 100.0% Ireland 1,485 256,818 2 0.1% 14 0.0% 1,483 256,804 Italy 116 23,425 21 18.1% 4,413 18.8% 95 19,012 Japan 1,253 201,308 598 47.7% 78,643 39.1% 655 122,665 Malaysia 239 15,675 139 58.2% 13,277 84.7% 100 2,398 Netherlands 98 27,975 11 11.2% 3,129 11.2% 87 24,846 New Zealand 56 3,225 13 23.2% 699 21.7% 43 2,526 Norway 140 46,514 50 35.7% 10,539 22.7% 90 35,974 Poland 117 7,840 59 50.4% 5,022 64.1% 58 2,818 Portugal 55 1,729 12 21.8% 253 14.7% 43 1,475 Singapore 111 9,779 12 10.8% 1,328 13.6% 99 8,452 South Africa 173 23,700 139 80.3% 18,874 79.6% 34 4,825 South Korea 1,895 27,332 1,048 55.3% 18,608 68.1% 847 8,724 Spain 248 26,670 52 21.0% 6,448 24.2% 196 20,222 Sweden 238 140,745 83 34.9% 56,827 40.4% 155 83,919 Switzerland 591 132,289 219 37.1% 53,475 40.4% 372 78,814 Taiwan 304 12,874 141 46.4% 6,178 48.0% 163 6,695 Thailand 230 12,807 162 70.4% 11,671 91.1% 68 1,136 UK 1,800 667,397 678 37.7% 321,838 48.2% 1,122 345,559 US 8,644 7,254,528 5,917 68.5% 5,235,792 72.2% 2,727 2,018,737 Non-US 17,553 2,658,482 6,914 40.1% 1009260 45.0% 10,639 1,649,221 All Countries 26,197 9,913,010 12,831 41.0% 6245052 45.8% 13,366 3,667,958
10
3.2 Methodology and Variables Construction
In order to measure the relationship between fund performance and flows, we regress fund flows on fund performance together with a set of control variables. In this section we discuss all variables in the regression and we explain why they are considered determinants of the flow-performance relationship.
3.2.1 Fund flow
To study the impact of mutual fund family size on the flow-performance relationship, in our regression we set fund flow as the dependent variable. Fund flows are the new money growth rate as the net growth in total net assets (TNA), it reflects the new external money flowing into the pool excluding the impact of raw return rate generated by managing fund assets.
Following Chevalier and Ellison (1997) and Sirri and Tufano (1998), we use the same standard procedure to deal with fund flows, besides, Ber and Ruenzi (2006) show that this expression for fund flows is a good proxy for actual fund flows.
Fund flow for fund i in country c at quarter t is calculated as:
(1)
Where TNAi,c,t is the total net asset value in local currency of fund i in country c at the
end of quarter t, and Ri,c,t is fund i‟s net raw return from country c in quarter t.
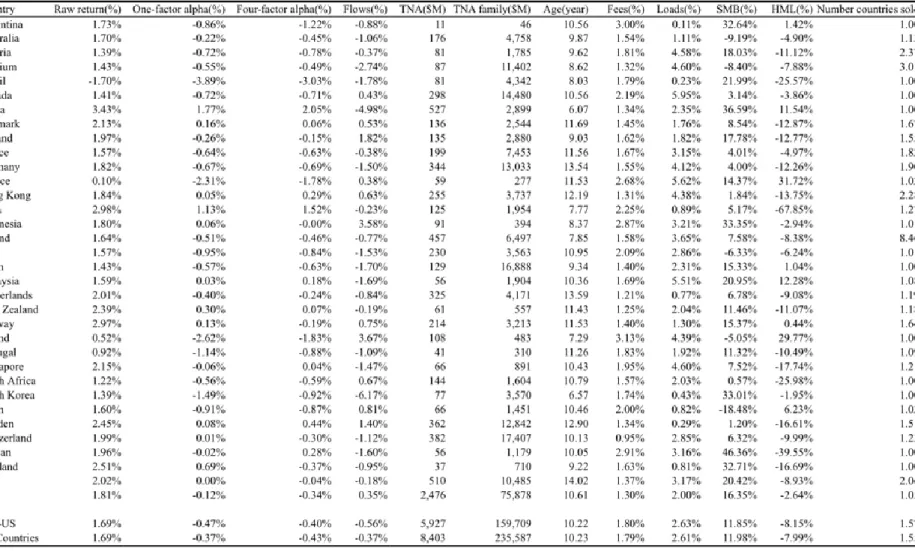
Table 2, Panel A, presents descriptive statistics of fund level variables averaged across countries. From the table, we can see that South Korea and China have the lowest average quarterly flows across funds during the sample period (-6.17% and -4.98%, respectively), while Poland and Indonesia enjoy the highest money growth rate (3.67% and 3.58%, respectively). The country with highest amount of total net assets under management in equity funds all over the world, the U.S., registered an average quarterly
11
fund flow of 0.35%. Across all countries, the average fund flow is -0.37% per quarter. Flows are winsorized at the bottom and top 1% level of the distribution by country to avoid the impact from extreme values.
3.2.2 Performance measurement
We use raw returns and risk-adjusted returns to measure fund performance. The raw returns are gross of taxes and net of total expenses (annual fees and other expenses). Risk-adjusted performance is calculated using two different methods, Jensen‟s alpha and four-factor alpha, i.e., Carhart (1997) model. Jensen‟s alpha is used to measure the abnormal return of a security or portfolio of securities over the theoretical expected return, and is given by:
αj = Rit − [Rft + βitM ∗ (RMt − Rft)] (2)
Where Rit is the realized return based on the fund i in time t and t-1. The Rft is the return
of the risk-free rate for each country or region in time t. RMt is the market return for each
country or region in time t. βitM is the beta of the fund i.
The Jensen‟s alpha is calculated in different ways for domestic and international funds. For domestic funds, first all stocks included in the DataStream/World scope database are used to construct the monthly benchmark factors for each individual country. The market return RMt is calculated using the value-weighted average return in US dollars of all
stocks in each country in each month. Then the previous 36 months of funds‟ excess returns are regressed on the domicile factors, using interbank middle interest rates for each country as risk-free rates Rft and then store the estimated betas βitM.2 Each quarter
alpha is the difference between excess returns and the predicted return, which is calculated based on estimated betas. The fund is performing better (worse) than the benchmark if a positive (negative) alpha exists.
2
12
For international funds, Jensen‟s alpha is calculated considering the investment region of funds (Europe, Asia–Pacific, North America, and Emerging Markets). The regression is the same as domestic funds, except the domestic market excess returns is replaced by regional market excess returns. For the funds that invest globally alpha is calculated using the global market factor.
The calculation of Carhart four-factor model (four-factor alpha) is similar with Jensen‟s alpha; it adds market, size, value, and momentum factors as explanatory variable in the regression equation, given by:
Rit = αj + β0iRMt + β1SMBt + β2HMLt + β3UMDt + ϵ 1t (3)
αj and RMt have the same meaning as in the equation of Jensen‟s alpha; SMBt (small
minus big) is the average return on the small portfolios minus the average return on the large portfolios; HMLt (high minus low) is the average return on high book-to-market
stocks portfolio minus the average return on low book-to-market stocks portfolios; UMDt
(momentum) is the average return on past 12-month winners portfolio minus the average return on past 12-month losers portfolio.
Previous 36 months of net fund returns are used to estimate the time series regression of monthly excess returns based on the fund‟s factor portfolios. The next step is to compare the difference between the expected return and realized return of fund and use this to estimate the fund abnormal return or alpha in each quarter, as explained before. Like Jensen‟s alpha, Four-factor alpha is also calculated in different ways for domestic and international funds, using alike approaches. See Ferreira et al. (2013) for further details on alphas calculation.
Table 2, Panel A, presents averages of fund performance by country, like fund flows, performance measures are also winsorized at the bottom and top 1% level of the distribution by country to avoid the influence from extreme values.
13
Brazil is the only country with an average negative raw return of -1.7%, while China has the highest average raw return of 3.43%, followed by India and Norway, reaching 2.98% and 2.97% respectively. However, the risk-adjusted performance provides us a better representation of the skill of the fund manager. With regards to Jensen‟s alphas, managers in China and India have the highest one-factor alpha (1.77% and 1.13%, respectively). Brazil has the lowest average one-factor alpha (-3.89%). Similarly, four-factor alphas are higher in China (2.05%) and India (1.52%), and lowest in Brazil (-3.03%).
Overall, the average raw return, Jensen‟s alphas and four-factor alphas per quarter across all countries in our sample is 1.69%, -0.37% and -0.43%, respectively.
3.2.3 Additional fund-level control variables
There are a number of variables that affect the fund flow-performance relationship and, as we mentioned previously. Sirri and Tufano (1998) show that Fund family size, measured by the total net assets (TNA) of the fund family, affect the flow-performance relationship. Sirri and Tufano (1998) also show that, the fund size measured by total net assets also influences fund flow. In our regression, both fund size and fund family size are measured by TNA in US dollars.
Since fund fees have always been a controversial factor in the related topic, Huang et al. (2007) show that there is a negative relation between fund fees and fund flow, however Chen et al. (2004) demonstrate that there is no significant relation between fund fees and fund flow. Ferreira et al. (2012) find that fund age has a negative effect on fund performance in non-US countries. They also show that loads and the number of countries where a fund is sold might have a different impact on the fund flow across different countries. Therefore, we take into account fund fees, fund age, loads, and the number of countries a fund is sold in our regression model. To eliminate the influence from extreme values, we winsorize fund fees and loads at the bottom and top 1% level of the distribution by country.
Following Ferreira et al. (2012), to take the fund style into account, we include the average return on small portfolios minus the average return on large portfolios (SMB)
14
and the average return on value portfolios minus the average return on growth portfolios (HML) as fund level control variables.
Table 2, Panel A, presents summary statistics for fund-level non-performance-related variables by country averaged across fund quarters. The presented numbers are consistent with our expectations Funds in more developed countries are older and have a larger size on average. The United Kingdom and Netherlands are the countries with the oldest funds, while U.S. has larger fund size and fund family size than other countries. Switzerland charges the lowest fees while Poland presents the highest fees across all the countries. Regarding loads, Canadian funds charge more and in Argentina and Brazil funds tend to not charge loads. Unlike countries such as Brazil, Indonesia and India that only invest in their own markets, Ireland and Belgium have the greatest number funds selling in other countries, approximately 8.5 and 3.0 respectively.
Table 2, Panel B, shows the result of pairwise correlation matrix between fund-level variables, the level of significance is presented in parenthesis. Since the correlation coefficients are relatively low, we can conclude that multicollinearity among variables is not driving our results and these variables may be included together in our regressions.
15
Table 2. Fund-level control variables
16
Panel B. Pairwise correlation of fund-level variables
1 2 3 4 5 6 7 8 9 10 11 12 Raw return 1.0000 One-factor alpha 0.4296* 1.0000 (0.00) Four-factor alpha 0.3690* 0.8021* 1.0000 (0.00) (0.00) Flows 0.0593* 0.0701* 0.0467* 1.0000 (0.00) (0.00) TNA 0.0421* 0.0613* 0.0390* 0.068* 1.0000 (0.00) (0.00) (0.00) (0.00) TNA family 0.0268* 0.0349* 0.0189* 0.0297* 0.5782* 1.0000 (0.00) (0.00) (0.00) (0.00) (0.00) Age -0.0060* 0.0092* 0.0096* -0.0485* 0.1930* 0.0885* 1.0000 (0.00) (0.00) (0.00) (0.00) (0.00) (0.00) Fees -0.0121* -0.0363* -0.0279* -0.0206* -0.3647* -0.3111* -0.0404* 1.0000 (0.00) (0.00) (0.00) (0.00) (0.00) (0.00) (0.00) Loads -0.0043* -0.0035* -0.0065* -0.0100* -0.0360* 0.0054* 0.0245* 0.3064* 1.0000 (0.00) (0.00) (0.00) (0.00) (0.00) (0.00) (0.00) (0.00) SMB 0.0200* -0.0104* -0.0043* -0.0121* -0.0428* -0.0499* -0.0380* 0.0860* -0.0235* 1.0000 (0.00) (0.00) (0.00) (0.00) (0.00) (0.00) (0.00) (0.00) (0.00) HML -0.0197* 0.0185* -0.0111* 0.0160* 0.0174* 0.0144* 0.0319* -0.0873* -0.0045* -0.1751* 1.0000 (0.00) (0.00) (0.00) (0.00) (0.00) (0.00) (0.00) (0.00) (0.00) (0.00) Number countries sold 0.0048* 0.0036* 0.0060* 0.0092* 0.0502* -0.0134* -0.0076* 0.0266* 0.1129* -0.0178* -0.0189* 1.0000 (0.00) (0.00) (0.00) (0.00) (0.00) (0.00) (0.00) (0.00) (0.00) (0.00) (0.00) P-values in parentheses, * reports the level of significance at 5%..
17
3.2.4 Country-level variables
Following Ferreira et al. (2012), additionally to fund characteristics, country-level characteristics are also included as important determinant factors of mutual fund performance. For instance, a country‟s level of financial development has a positive impact on fund performance. Our first hypothesis is that the size of the fund family is one of the decision criteria when investing in mutual funds, and therefore affects the flow-performance relationship. Because larger families tend to be widely known, we would expect it to be particularly determinant for less sophisticated investors. This is our second hypothesis. If this is the case, in less developed countries, i.e., countries with less developed financial markets and mutual fund industries, and where the mutual investors are on average less sophisticated, larger mutual fund families are expected to increase the convexity of the flow-performance relationship. Meaning that in these countries investors will buy more funds from larger families when they perform well and sell less these funds when they perform poorly. This is our third hypothesis.
To differentiate investors‟ sophistication, we follow Ferreira et al. (2012) and include different proxies of financial development and mutual fund industry development level as country-level variables. Financial literacy and emerging market are used to proxy for financial development, while Herfindahl index and number of management companies for equity funds of each country be used as the proxies for mutual fund industry development across countries.
Data on financial literacy is from Lipper Hindsight database and measures the percentage of adults who has the ability to manage personal finance matters in an efficient market. Following Almenberg and Save-Soderbergh (2011) and Caurkubule and Rubanovskis (2014), high level of financial literacy is conducive to financial well-being of individuals and society, since more financial literate people tend to participate more in the financial markets and perform better when they making their own investment decisions. Thus, we consider it as a powerful symbol of financial development. After integrating the features of financial literacy with our prior assumptions, we expect that when funds‟ family are larger investors from countries with lower level of financial literacy will react to past performance by buying more winners and selling less losers.
18
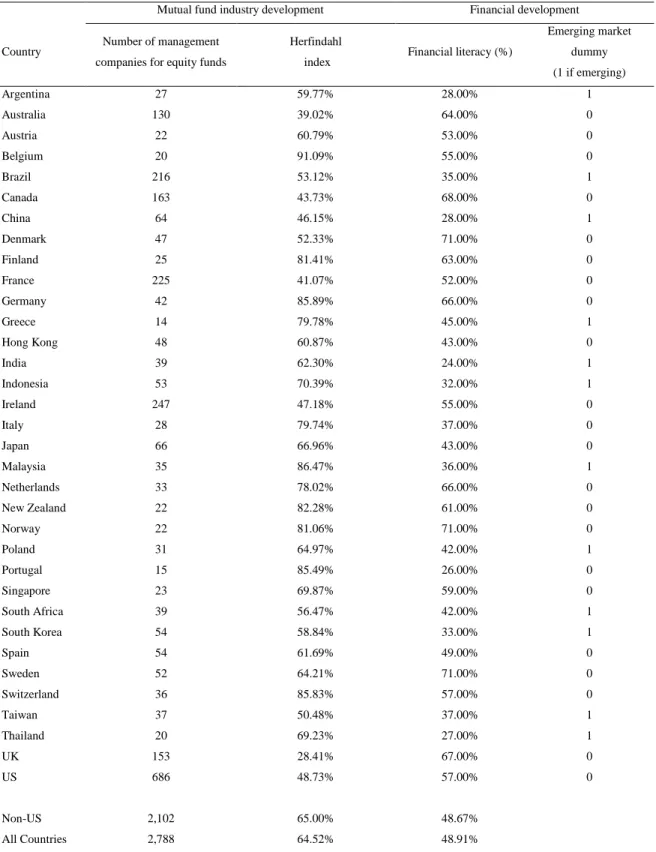
Table 3 presents country level variables averaged across countries. As shown in Column (3), Denmark, Norway and Sweden are at the top with a score of 71%. On the contrary, India (24%), Portugal (26%) and Thailand (27%) are the countries with the lowest scores, indicating a less sophisticated financial market.
Following the MSCI Barra criteria, a dummy variable (emerging market dummy) is also used to proxy for the level of financial development, which equals one if the country is an emerging market country. Kiran, Yavuz and Güriş (2009) demonstrate that long-run association exists between financial development and economic growth, furthermore, they are positively relative to some extent. Emerging markets tend to have higher trading costs, the annual average transaction costs are expected to be lower in more financially developed markets, also implying more unsophisticated financial markets in emerging country.
More details about country-level variable of emerging market dummy are presents in Table 3, Column (4).
Hirshman-Herfindahl Index, better known as the Herfindahl index, is calculated by squaring the market shares of all company in a particular industry and then summing the squares. Following Rhoades (2006), it has been widely adopted as a statistical measure index by some authorities such as the Department of Justice and the Federal Reserve in the analysis of the competitive effects of industry mergers since it was developed independently by the economists Hirschman (1945) and Herfindahl (1950). Other things equal, concentration in a market with lower Herfindahl index will be low, in other words, the competition among firms will be stronger. In our study, a lower Herfindahl index suggests a higher level of mutual fund industry development as the result of long-term competitions.
We also use the number of fund management companies in the country as a measure of mutual fund industry development. Countries with more mutual fund management firms are considered to have higher level development.
Table 3, Columns (1) and (2) present the number of equity funds management companies and Herfindahl index across different countries, respectively. The U.S. is the country with higher number of funds management companies, followed by Ireland and France, while Greece and Portugal have the lowest number of fund management firms. With
19
regard to Herfindahl index, the United Kingdom shows the strongest competitive market by scoring the lowest Herfindahl index of 28.41%, while Belgium has the highest Herfindahl index (91.09%) among all countries.
20
Table 3. Country level variables averaged across countries
Mutual fund industry development Financial development
Country Number of management
companies for equity funds
Herfindahl
index Financial literacy (%)
Emerging market dummy (1 if emerging) Argentina 27 59.77% 28.00% 1 Australia 130 39.02% 64.00% 0 Austria 22 60.79% 53.00% 0 Belgium 20 91.09% 55.00% 0 Brazil 216 53.12% 35.00% 1 Canada 163 43.73% 68.00% 0 China 64 46.15% 28.00% 1 Denmark 47 52.33% 71.00% 0 Finland 25 81.41% 63.00% 0 France 225 41.07% 52.00% 0 Germany 42 85.89% 66.00% 0 Greece 14 79.78% 45.00% 1 Hong Kong 48 60.87% 43.00% 0 India 39 62.30% 24.00% 1 Indonesia 53 70.39% 32.00% 1 Ireland 247 47.18% 55.00% 0 Italy 28 79.74% 37.00% 0 Japan 66 66.96% 43.00% 0 Malaysia 35 86.47% 36.00% 1 Netherlands 33 78.02% 66.00% 0 New Zealand 22 82.28% 61.00% 0 Norway 22 81.06% 71.00% 0 Poland 31 64.97% 42.00% 1 Portugal 15 85.49% 26.00% 0 Singapore 23 69.87% 59.00% 0 South Africa 39 56.47% 42.00% 1 South Korea 54 58.84% 33.00% 1 Spain 54 61.69% 49.00% 0 Sweden 52 64.21% 71.00% 0 Switzerland 36 85.83% 57.00% 0 Taiwan 37 50.48% 37.00% 1 Thailand 20 69.23% 27.00% 1 UK 153 28.41% 67.00% 0 US 686 48.73% 57.00% 0 Non-US 2,102 65.00% 48.67% All Countries 2,788 64.52% 48.91%
21
3.2.5 Measuring the fund flow-performance relationship
To test the fund flow-performance relationship, we run two different approaches. We start by using a linear approach and we move on and also use a three piecewise-linear approach. Regarding whether fund family size affects flow-performance relationship, we create a dummy variable, which is equal to one for funds with family size above median in the country-year.
For the linear approach, we run the following regression, where we regress flows on fund past performance rank, the dummy fund family size and a set of control variables:
Flowi,c,t = a + bi,c*performance ranki,c,t-1 + ci,c*dummy fund family sizec,t-1 +
di,c*control variablesi,c,t-1+ε2,t (4)
Where i is the fund, c is the fund‟s responding country and t is the time period. We measure fund performance using raw returns and risk-adjusted returns (one and four-factor alpha). Performance rank in each country-quarter is calculated based on last year performance. All fund-level control variables discussed in Section 4.3 are included in the regression models. Considering that U.S. is the country with the largest fund TNA managed and the maximum number of funds, we run the regression test for all countries in our sample, for non-U.S. countries and just for the U.S. respectively. We include fund type, time, and country fixed effects when we include more than one country in our regressions. P-values are heteroskedasticity robust and clustered by fund or by country when the regression includes one or more than one country, respectively.
To see how investors react to larger family size funds, we add the interaction between dummy variable large family size and past performance rank in the equation:
Flowi,c,t = a + bi,c*performance ranki,c,t-1 + ci,c*dummy fund family sizec,t-1 +
di,c* performance ranki,c,t-1*dummy fund family sizec,t-1 +
22
Then we run the regression in equation (5) for all countries, non-U.S. countries, and for the U.S. separately.
Different studies have shown that the flow-performance relationship is not perfectly linear (e.g., Ferreira et al., 2012; Huang et al., 2007). To study if the flow-performance sensitivities for different levels of performance differ, we adopt the three-piecewise linear approach by sorting and grouping the funds according to their past performance into different parts: bottom quintile (LOW), three middle quintile (MID) and top quintile (HIGH). Firstly, we run the origin regression equation and get the slopes of flow-performance relationship for different parts, the second step is to see if the difference between them is significant or not. If the linear flow-performance relationship hypothesis is valid, the slope of three groups should not be statistically different. Otherwise flow-performance relationship is convex. The regression equation is the same as we use for prior linear approach except that we also calculate the slopes for LOW, MID and HIGH:
Flowi,c,t = a + bi,c*low performance ranki,c,t-1 + ci,c*mid performance ranki,c,t-1 +
di,c*high performance ranki,c,t-1 + ei,c*dummy fund family sizec,t-1 +
fi,c*control variablesi,c,t-1+ε2,t (6)
To study how fund family size affects the flow-performance sensitivity at different levels of performance, we need to rerun the regression process, using the equation is established with interaction between dummy variable for large family size and past performance rank. Thus, we run the regression equation below using bottom quintile, middle quintile and top quintile separately to get the slopes of different ranks and make statistical comparison:
Flowi,c,t = a + bi,c*low performance ranki,c,t-1 + ci,c*mid performance ranki,c,t-1 +
di,c*high performance ranki,c,t-1 + ei,c*dummy fund family sizec,t-1 +
fi,c* low performance ranki,c,t-1*dummy fund family sizec,t-1 +
gi,c* mid performance ranki,c,t-1*dummy fund family sizec,t-1 +
hi,c* high performance ranki,c,t-1*dummy fund family sizec,t-1 +
23
We also run the regression in equation (7) for all countries, non-U.S. countries, and for the U.S. separately, similarly to what we do using the linear approach.
The results of estimating the flow-performance relationship using the linear approach and three piecewise-linear approach are presented in Section 4. To confirm the existence of convexity, a Wald test between low performance rank and high-performance rank are used to check the shape of flow-performance relationship.
3.2.6 The impact of fund family size on the flow-performance sensitivity across countries
Ferreira et al. (2012) show that differences in the flow-performance sensitivities across countries can be explained by differences in investor‟s sophistication and differences in participation costs across countries. They find that less sophisticated investors tend to have higher convexity in their flow-performance relationship.
As described in Section 3.2.4, we use number of management companies for equity funds and Herfindahl index to classify the degree of mutual fund industry development in different countries. Regarding financial development, financial literacy, and emerging market dummy are included as proxies for development.
To analyze the impact of funds with larger family size on the flow-performance sensitivity for more developed markets and less developed markets, we split the sample into two subsamples for each country-level variable: below median and above median. Since the U.S. is the country managing more than half of the total net assets in our database, we also run the regression for the above median subsample (or, in the case of the Herfindahl index) for the below median subsample excluding U.S. funds.
In this section, we use the three-piecewise approach to run the linear regression equation of the flow-performance relationship, through this method we can observe the differences between slopes after interacting with fund family size for the lowest quintile, middle quintiles and the top quintile more clearly.
Consistent with the literature, our hypothesis is that, comparing to less developed or less competitive markets, in more developed or more competitive markets, investors react
24
more to past performance when funds belong to large families, by selling more losers and buying less winners.
4. Empirical results
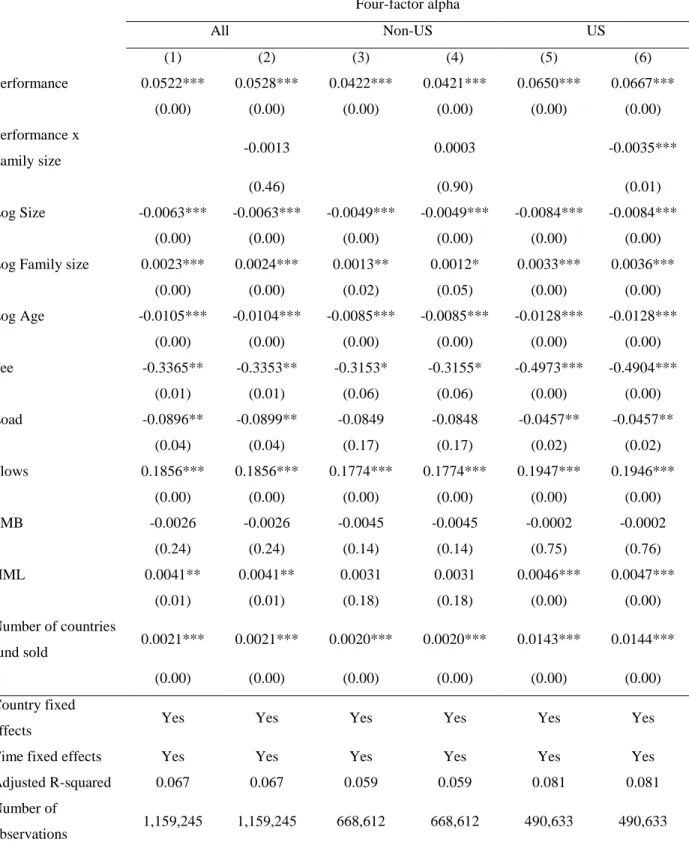
The regression results are presented in Table 4. Table 4, Panel A presents the results for the linear approach, while Panel B shows the results for the three-piecewise approach. In Table 5 we take country-level variables into consideration3
4.1 The impact of large fund families on the flow-performance sensitivity
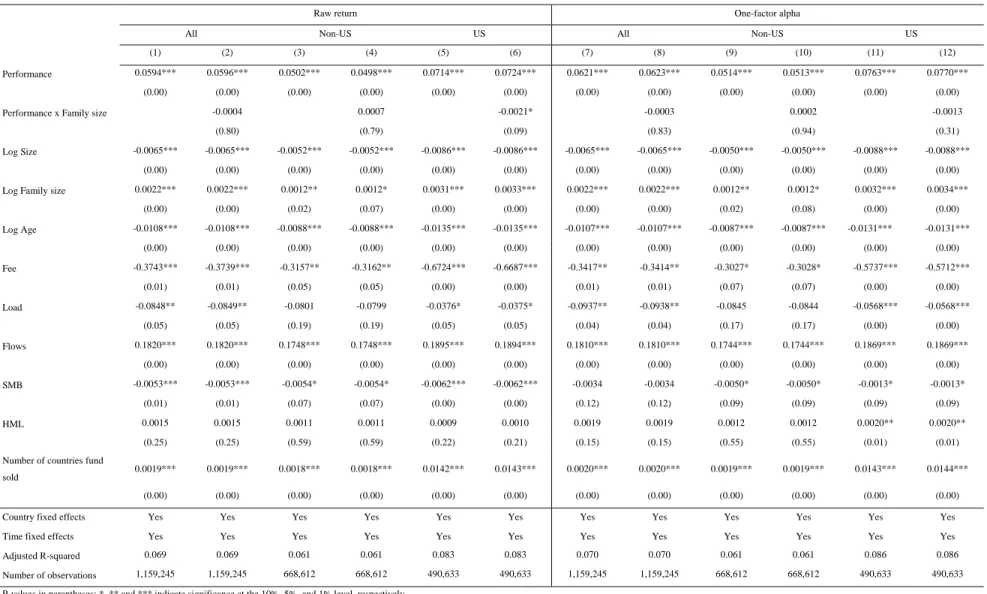
The results in Table 4, Panel A show that fund flows are always positively related to fund performance and that the three performance measure methods of fund performance we used draw the same conclusion. To put summarize, investors tend to put their money into funds with better past performance.
Interacting the dummy variable of big fund family size with fund performance, the results in Column (6) shows that the influence of belonging to a big fund family size is only statically significant in U.S. funds, which is also confirmed by the results using raw returns as the performance rank measurement. To be more specific, U.S. investors react less to past performance if the fund belongs to a largest fund family. For non-U.S. funds, the effect of having a large fund family is never statically significant (Column (4)). The coefficients for others fund-level variables are generally consistent with conclusions from previous research (e.g., Ferreira et al., 2012). With regards to fund size and fund age, all coefficients are negative while all estimated regression coefficients of log fund family size are positive in our sample; suggesting that in aggregate a fund with smaller size will attract more money, in addition, investors tend to invest more money in younger funds. The negative relationship between fund flows and fund fees are statistically significant in all specifications (consistent with Huang et al. (2007)). We can also see that in Columns (5) and (6), fund loads affect fund flows negatively in the U.S., while outside the U.S.,
3
We present the regression results using four-factor alpha as performance measurement, while the outcomes of raw return and one-factor alpha in the same processing mode are shown in the robustness tests section.
25
fund loads are not significantly related to fund flows. There is no statistically relation between SMB and fund flows. From columns (5) and (6), the results show that in the U.S., the HML factor has a positive impact on fund flows. Moreover, the coefficient of the number of countries the fund is sold indicates that the fund flows increases with the number of countries it sold.
Table 4 Panel B, shows the impact of having a large fund family size on the flow-performance sensitivity using three-piecewise approach.
26
Table 4. The flow- performance relationship across all countries, non-US, and US Panel A. Linear approach
Four-factor alpha All Non-US US (1) (2) (3) (4) (5) (6) Performance 0.0522*** 0.0528*** 0.0422*** 0.0421*** 0.0650*** 0.0667*** (0.00) (0.00) (0.00) (0.00) (0.00) (0.00) Performance x Family size -0.0013 0.0003 -0.0035*** (0.46) (0.90) (0.01) Log Size -0.0063*** -0.0063*** -0.0049*** -0.0049*** -0.0084*** -0.0084*** (0.00) (0.00) (0.00) (0.00) (0.00) (0.00)
Log Family size 0.0023*** 0.0024*** 0.0013** 0.0012* 0.0033*** 0.0036***
(0.00) (0.00) (0.02) (0.05) (0.00) (0.00) Log Age -0.0105*** -0.0104*** -0.0085*** -0.0085*** -0.0128*** -0.0128*** (0.00) (0.00) (0.00) (0.00) (0.00) (0.00) Fee -0.3365** -0.3353** -0.3153* -0.3155* -0.4973*** -0.4904*** (0.01) (0.01) (0.06) (0.06) (0.00) (0.00) Load -0.0896** -0.0899** -0.0849 -0.0848 -0.0457** -0.0457** (0.04) (0.04) (0.17) (0.17) (0.02) (0.02) Flows 0.1856*** 0.1856*** 0.1774*** 0.1774*** 0.1947*** 0.1946*** (0.00) (0.00) (0.00) (0.00) (0.00) (0.00) SMB -0.0026 -0.0026 -0.0045 -0.0045 -0.0002 -0.0002 (0.24) (0.24) (0.14) (0.14) (0.75) (0.76) HML 0.0041** 0.0041** 0.0031 0.0031 0.0046*** 0.0047*** (0.01) (0.01) (0.18) (0.18) (0.00) (0.00) Number of countries fund sold 0.0021*** 0.0021*** 0.0020*** 0.0020*** 0.0143*** 0.0144*** (0.00) (0.00) (0.00) (0.00) (0.00) (0.00) Country fixed
effects Yes Yes Yes Yes Yes Yes
Time fixed effects Yes Yes Yes Yes Yes Yes
Adjusted R-squared 0.067 0.067 0.059 0.059 0.081 0.081
Number of
observations 1,159,245 1,159,245 668,612 668,612 490,633 490,633
27
Panel B. Three-piecewise linear approach
Four-factor alpha
All Non-US US
(1) (2) (3) (4) (5) (6)
Low t-1 0.0393*** 0.0323** 0.0371 0.0221 0.0376*** 0.0385***
(0.01) (0.03) (0.11) (0.33) (0.00) (0.00)
Low x Family size 0.0153 -0.0349*** -0.0020
(0.20) (0.00) (0.72)
Mid t-1 0.0396*** 0.0408*** 0.0298*** 0.0343*** 0.0529*** 0.0510***
(0.00) (0.00) (0.00) (0.00) (0.00) (0.00)
Mid x Family size -0.0026 -0.0101*** 0.0036
(0.55) (0.00) (0.16)
High t-1 0.1584*** 0.1837*** 0.1402*** 0.1548*** 0.1832*** 0.2202***
(0.00) (0.00) (0.00) (0.00) (0.00) (0.00)
High x Family size -0.0532*** -0.0307 -0.0764***
(0.00) (0.14) (0.00)
Log Size -0.0062*** -0.0063*** -0.0048*** -0.0049*** -0.0083*** -0.0084***
(0.00) (0.00) (0.00) (0.00) (0.00) (0.00)
Log Family size 0.0023*** 0.0021** 0.0013** 0.0008 0.0033*** 0.0035***
(0.00) (0.01) (0.02) (0.22) (0.00) (0.00) Log Age -0.0104*** -0.0104*** -0.0084*** -0.0084*** -0.0129*** -0.0128*** (0.00) (0.00) (0.00) (0.00) (0.00) (0.00) Fee -0.3914*** -0.3939*** -0.3428** -0.3468** -0.6710*** -0.6752*** (0.01) (0.01) (0.04) (0.04) (0.00) (0.00) Load -0.0913** -0.0905** -0.0878 -0.0858 -0.0385** -0.0382** (0.04) (0.04) (0.16) (0.18) (0.05) (0.05) Flows 0.1843*** 0.1842*** 0.1765*** 0.1765*** 0.1926*** 0.1924*** (0.00) (0.00) (0.00) (0.00) (0.00) (0.00) SMB -0.0035 -0.0035 -0.0050* -0.0051* -0.0015* -0.0015* (0.12) (0.12) (0.10) (0.09) (0.05) (0.05) HML 0.0043** 0.0042** 0.0031 0.0030 0.0050*** 0.0050*** (0.01) (0.01) (0.18) (0.19) (0.00) (0.00)
Number of countries fund
sold 0.0020*** 0.0020*** 0.0019*** 0.0019*** 0.0142*** 0.0141***
(0.00) (0.00) (0.00) (0.00) (0.00) (0.00)
Country fixed effects Yes Yes Yes Yes Yes Yes
Time fixed effects Yes Yes Yes Yes Yes Yes
Adjusted R-squared 0.067 0.068 0.059 0.059 0.082 0.082
Number of observations 1,159,245 1,159,245 668,612 668,612 490,633 490,633
Wald test
βHigh=βLow(p-value) 0.0000 0.0000 0.0000
28
Regarding Table 4, Panel B, the numbers in Columns (1), (3), and (5) concerning the relationship between different fund performance rank and fund flows show that investors indeed have a nonlinear response to funds with different levels of performance, as Ferreira et al. (2012) demonstrate. All coefficients of high performance rank are bigger than low performance rank, meaning that investors are more responsive to top performing funds. More concretely, investors tend to put their money into funds with good performance but sell relative fewer funds when they perform poorly. The results of Wald tests show that the differences between the sensitivity of flow-performance relationship for funds with low and high performance are statistically significant. This conclusion holds across the different specifications and no matter the performance measure we use.
From the results in Table 4, Panel B, we can see that the effect of having a large fund family size on fund flow-performance relationship is only statistically significant for on-U.S. funds in the low and middle fund performance rank (Column (4)) and for funds in U.S. with high level of fund performance (Column (6)). Indicating that in outside the U.S., investors tend to sell fewer funds when they perform poorly if they have a big fund family size, while in the U.S. investors react less to top performers when these funds belong to large families.
29
4.2 Fund family size, investor sophistication and flow-performance sensitivity
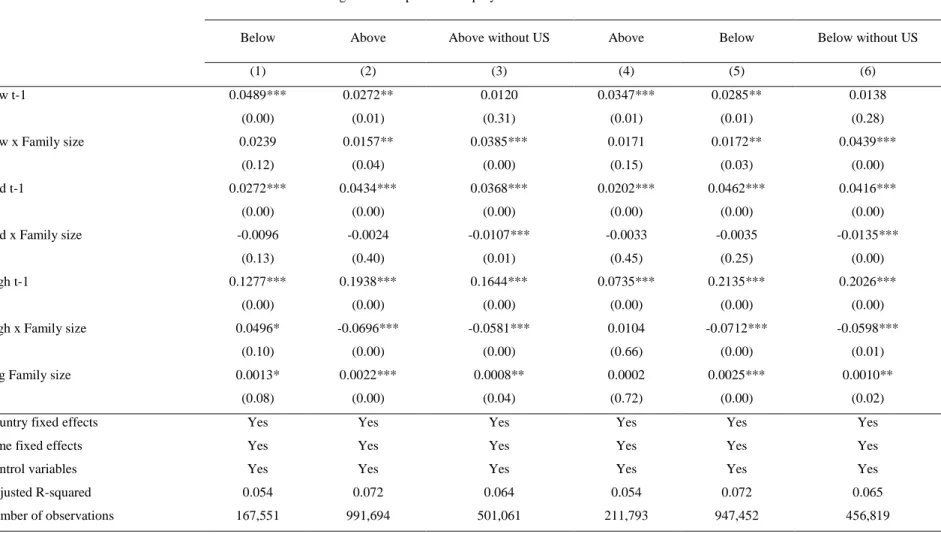
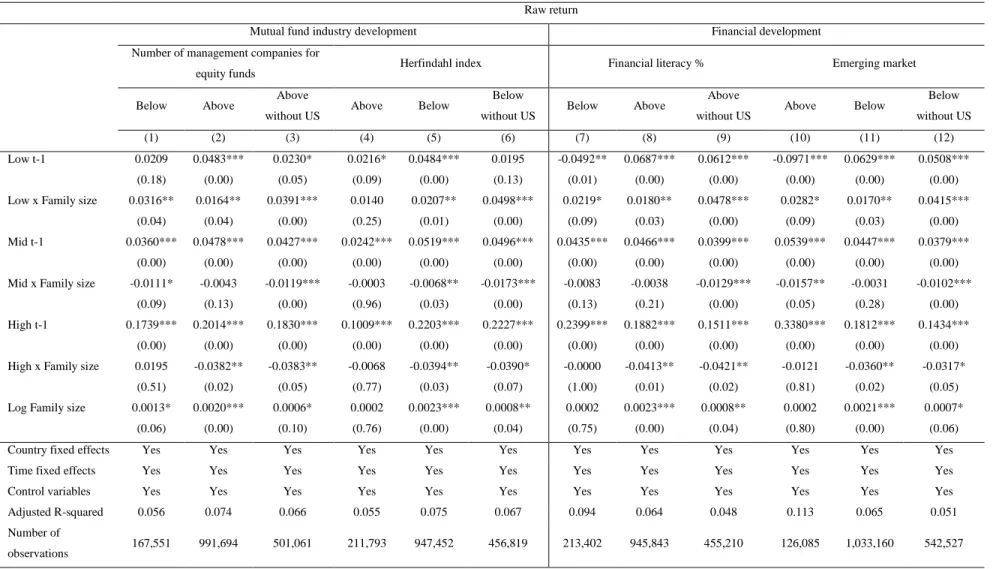
Table 5 presents the impact of having a large fund family size on the convexity of the flow-performance relationship for more sophisticated markets and less sophisticated markets. As mentioned before, we use proxies of financial development and mutual fund industry development level, including number of management companies for equity funds, Herfindahl index, financial literacy and emerging market to measure the level of development and sophistication of the market. In our analysis, more sophisticated markets have higher than median number of management companies, and financial literacy; for Herfindahl index, countries below median are the ones with more sophisticated markets. Being a non-emerging market also implies having a higher level of development.
As the results in Table 5 show, the regression coefficients of interaction between dummy large fund family size and fund performance is always statistically significant for the subsample of more sophisticated countries, even if we exclude the U.S. The conclusion is that sophisticated investors sell more bottom performers and buy less top performers if the fund is part of a large fund family. The regression results for the more developed countries subsample including U.S. is similar except that the effect is only statistical significant for funds with low performance rank and high performance rank.
Our hypothesis is that, in less developed markets, investors would sell fewer losers from larger families and buy more funds when they perform well. However, the result indicates that in less sophisticated markets there is no significant difference on how investors react to paste performance for funds with different fund family size.
Additionally, the conclusions remain quite similar when raw return and one-factor alpha are used as the performance measurement if we keep all the other situations the same. The analysis of supplemental country-level variables which representing mutual fund industry development level are shown in Section 5 as robustness tests.
30
Table 5. The impact of development using a three-piecewise linear approach Panel A. Mutual fund industry development
Mutual fund industry development
Number of management companies for equity funds Herfindahl index
Below Above Above without US Above Below Below without US
(1) (2) (3) (4) (5) (6)
Low t-1 0.0489*** 0.0272** 0.0120 0.0347*** 0.0285** 0.0138
(0.00) (0.01) (0.31) (0.01) (0.01) (0.28)
Low x Family size 0.0239 0.0157** 0.0385*** 0.0171 0.0172** 0.0439***
(0.12) (0.04) (0.00) (0.15) (0.03) (0.00)
Mid t-1 0.0272*** 0.0434*** 0.0368*** 0.0202*** 0.0462*** 0.0416***
(0.00) (0.00) (0.00) (0.00) (0.00) (0.00)
Mid x Family size -0.0096 -0.0024 -0.0107*** -0.0033 -0.0035 -0.0135***
(0.13) (0.40) (0.01) (0.45) (0.25) (0.00)
High t-1 0.1277*** 0.1938*** 0.1644*** 0.0735*** 0.2135*** 0.2026***
(0.00) (0.00) (0.00) (0.00) (0.00) (0.00)
High x Family size 0.0496* -0.0696*** -0.0581*** 0.0104 -0.0712*** -0.0598***
(0.10) (0.00) (0.00) (0.66) (0.00) (0.01)
Log Family size 0.0013* 0.0022*** 0.0008** 0.0002 0.0025*** 0.0010**
(0.08) (0.00) (0.04) (0.72) (0.00) (0.02)
Country fixed effects Yes Yes Yes Yes Yes Yes
Time fixed effects Yes Yes Yes Yes Yes Yes
Control variables Yes Yes Yes Yes Yes Yes
Adjusted R-squared 0.054 0.072 0.064 0.054 0.072 0.065
Number of observations 167,551 991,694 501,061 211,793 947,452 456,819 P-values in parentheses; *, ** and *** indicate significance at the 10%, 5%, and 1% level, respectively.
31
Panel B. Financial development
Financial development
Financial literacy % Emerging market
Below Above Above without US Above Below Below without US
(7) (8) (9) (10) (11) (12)
Low t-1 -0.0334* 0.0490*** 0.0534*** -0.0651** 0.0457*** 0.0456***
(0.07) (0.00) (0.00) (0.01) (0.00) (0.00)
Low x Family size 0.0163 0.0165** 0.0460*** 0.0258 0.0152** 0.0391***
(0.23) (0.04) (0.00) (0.15) (0.04) (0.00)
Mid t-1 0.0316*** 0.0430*** 0.0356*** 0.0432*** 0.0405*** 0.0325***
(0.00) (0.00) (0.00) (0.00) (0.00) (0.00)
Mid x Family size -0.0064 -0.0017 -0.0114*** -0.0134 -0.0010 -0.0088**
(0.28) (0.56) (0.01) (0.12) (0.70) (0.02)
High t-1 0.2103*** 0.1778*** 0.1280*** 0.3051*** 0.1692*** 0.1203***
(0.00) (0.00) (0.00) (0.00) (0.00) (0.00)
High x Family size -0.0046 -0.0677*** -0.0525*** -0.0459 -0.0584*** -0.0362**
(0.88) (0.00) (0.01) (0.31) (0.00) (0.04)
Log Family size 0.0004 0.0024*** 0.0009** 0.0003 0.0023*** 0.0007**
(0.50) (0.00) (0.03) (0.69) (0.00) (0.04)
Country fixed effects Yes Yes Yes Yes Yes Yes
Time fixed effects Yes Yes Yes Yes Yes Yes
Control variables Yes Yes Yes Yes Yes Yes
Adjusted R-squared 0.091 0.062 0.045 0.109 0.063 0.049
Number of observations 213,402 945,843 455,210 126,085 1,033,160 542,527
32
5. Robustness tests
We have presented the results of the impact of having a large fund family size on the flow-performance sensitivity, in Section 4.1, and the effect of having a large fund family size on the convexity of the flow-performance relationship between markets with different stages of development, in Section 4.2, using four-factor alpha as our performance measure, to show robustness of our results we run the same results using raw returns and one-factor alpha. The results are presented in Appendix I, Tables 6 and 7 and are consistent with our previous findings.
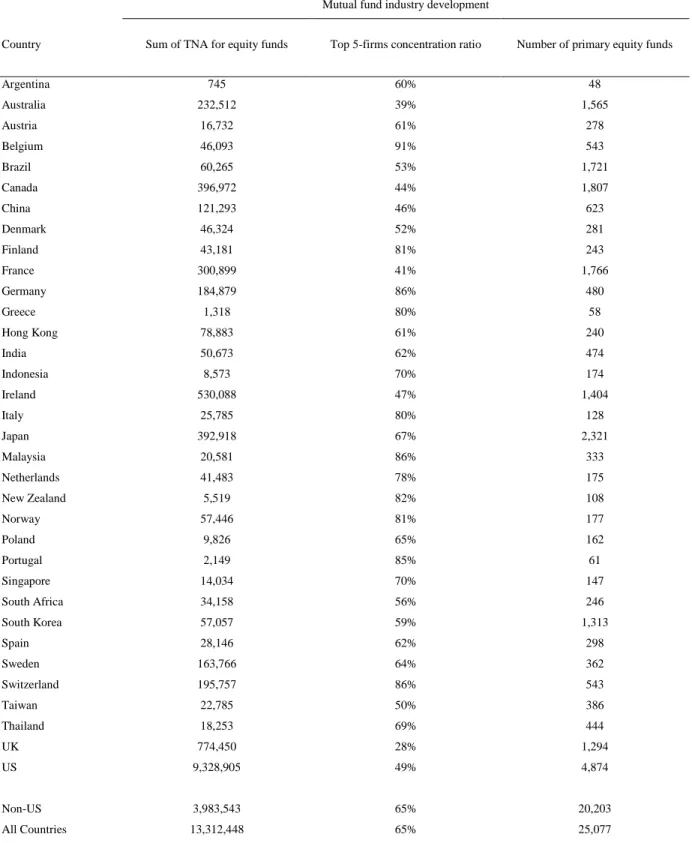
We also run additional tests for the results in Section 4.2. More precisely, we use the sum of TNA equity funds in the country, the number of equity funds in the country and the sum of the market share of the top 5 management companies in the country as proxies for development in the mutual fund industry. The summary statistics regarding these variables and the results of the corresponding regression results, using four-factor alpha as performance measure, are presented in Table 8 Panel A and Panel B, respectively. Overall, all the results of robustness tests are consistent with the conclusions we drew from our main testes.
6. Conclusion
To the best of our knowledge we are the first to study the effect of fund family size on the flow-performance relationship using a worldwide mutual fund database. Consisting with previous research, we show the convexity of the flow-performance relationship by revealing the non-linear relation between fund flows and fund performance. To explain differences on the flow-performance sensitivity to funds belonging to larger fund families across countries, we use country-level variables that proxy for the level of the mutual fund industry development and the level of financial development in different countries. We show that having a large family size increases the sensitivity of the flow-performance relationship to poor performance and decreases of the flow-performance relationship to winners. In markets with higher level of mutual fund industry development and financial development, investors react more to past performance if funds have larger family size by selling more bottom performers and buying less top performers.
33
References
Almenberg, J., & Save-Soderbergh, J. 2011. Financial literacy and retirement planning in Sweden. Netspar Discussion Paper No. 01/2011-018.
Ber, S., & Ruenzi, B. S. 2006. On the usability of synthetic measures of mutual fund net-flows. Cfr Working Papers.
Bhojraj, S., Cho, Y.-J., & Yehuda, N. 2010. Mutual fund size, fund family size and mutual fund performance: the role of selective disclosure and regulation FD. Johnson School Research Paper 1-34.
Brennan, M., & Hughes, P. 1991. Stock Prices and the supply of information. Journal of Finance, 46: 1665-1691.
Carhart, M. 1997. On persistence in mutual fund performance. Journal of Finance, 52(1), 57-82.
Caurkubule, Z., & Rubanovskis, A. 2014. Pension system development and the sustainability of the principle of generation solidarity. Entrepreneurship & Sustainability Issues, 1(3), 173-186.
Chen, J., Hong, H., Huang, M., & Kubik, J. 2004. Does fund size erode performance? Liquidity, organizational diseconomies, and active money management, American Economic Review 94, 1276–1302.
Chevalier, J., & Ellison, G. 1997. Risk Taking by Mutual Funds as a Response to Incentives. Journal of Political Economy, 105(6), 1167-1200.
Ferreira M., A. Keswani, A. Miguel, & S. Ramos. 2012. The flow-performance relationship around the world. Journal of Banking and Finance, 36: 1759-1780.
Ferreira M., A. Keswani, A. Miguel, & S. Ramos. 2013. The determinants of mutual fund performance: a cross-country study. Review of Finance, 17(2), 483-525.
Gallaher, S., R. Kaniel, & L. Starks. 2006. Madison avenue meets wall street: mutual-fund families, competition, and advertising. Working paper, University of Texas, Austin.
34
Gaspar, J.-M., M. Massa, & P. Matos. 2006, „Favoritism in mutual fund families? evidence on strategic cross-fund subsidization‟, Journal of Finance, Vol. 61, No. 1 (February), pp. 73–104.
Guedj, I., & Papastaikoudi, J. (2004). Can mutual fund families affect the performance of their funds? Social Science Electronic Publishing.
Herfindahl, O. C. 1950. Concentration in the steel industry. Working paper, Columbia University.
Hirschman, A. O. 1945. National power and structure of foreign trade. Unpublished doctoral dissertation, University of California.
Huang, J., Wei, K., & Yan, H. 2007. Participation costs and the sensitivity of fund flows to past performance. The Journal of Finance, 62(3), 1273-1311.
Kim, M. 2010. Changes in mutual fund flows and managerial incentives. Working paper, University of Southern California.
Kiran, B., Yavuz, N. C., & Güriş, B. 2009. Financial development and economic growth: a panel data analysis of emerging countries. International Research Journal of Finance & Economics, Annual Reviews.
Latzko D. A. 2001. The sources of scale economies within large mutual fund families. Working paper, Pennsylvania State University, Toronto.
Li, X., & Liu, Z. 2010. Stretching fund family and manager reputation: Evidence from China. In 2010 2nd International Conference on Computational Intelligence and Natural Computing, CINC 2010, pp. 53–56.
Spiegel, M., & Mamaysky, H. 2001. A Theory of Mutual Funds: Optimal Fund Objectives and Industry Organization. Working paper, Yale School of Management. Massa, M. 2003. How do family strategies affect fund performance? When performance-maximization is not the only game in town. Journal of Financial Economics, 67:249-304