Manuscript ID: 989 DOI: 10.18462/iir.icr.2019.0989
Experimental tests using deactivation of coolant fluid
circulation to mitigate frost formation on the heat exchanger
surface
Pedro PANOIAS
(a), Pedro D. SILVA
(a,b), Luís C. PIRES
(a), Pedro D.
GASPAR
(a,b), José NUNES
(c)(a) University of Beira Interior, Rua Marquês d’Ávila e Bolama, 6201-001, Covilhã, Portugal,
dinho@ubi.pt
(b) C-MAST - Centre for Mechanical and Aerospace Science and Technologies, Covilhã, Portugal,
dinis@ubi.pt
(c) Agriculture School, Polytechnic Institute of Castelo Branco, Quinta da Senhora de Mercoles,
6001-909 Castelo Branco, Portugal, jnunes@ipcb.pt
ABSTRACT
The use of cold for conservation of food products requires large consumption of electricity. In order to obtain lower temperatures than those available in the same space, the evaporator coils, generally operate at temperatures lower than the freezing point of the water. The ice formed on the surface is detrimental both to the thermal and the energetic level of the refrigeration system. Thus, ice removal is critical to reestablish the desired operating conditions.
This paper presents a refrigeration apparatus setup composed by two heat exchangers connected in parallel. The coolant fluid circulation is deactivated during short periods of operation, and the ice formation on the coil surface is analyzed. The results show that this strategic deactivation of coolant fluid circulation proved to be a viable operating condition since allowed an extension of the refrigeration system operation with a stable cooling power and so better thermal efficiency.
Keywords: Ice Formation, Experimental Test, Refrigeration Systems, Ice Mitigation.
1. INTRODUCTION
The improvement of the energy efficiency in the refrigeration equipment is the main motivation for the accomplishment of this work. Cooling systems for comfort or food preservation are increasingly used today. With the massive use of cooling systems, it is increasingly urgent and necessary to study its most important element, the heat exchanger, since it is responsible for cooling the flowing fluid, because its surface with fins is revealed as the most effective way to transfer heat through convection (Amini et al., 2014). The wet air upon contact with the fins begins a process of deposition of droplets which, after a while, eventually solidify and form ice. The cooling process is becoming less efficient as time progresses, as the air passage becomes partially blocked (Seker et al., 2004).
Although there is a growing number of studies in this area, ice formation continues to be a problem that makes the use of these types of systems inefficient, since too many periods are devoted to defrosting, which causes the considerably oscillations in temperature of the space to be cooled. Thus, a greater need for energy consumption will occur to maintain the desired temperature value. A non-stationary complex mechanism is defined during the process of ice formation on the outer surface of the heat exchanger coils, involving spatial and temporal variations of heat and mass transfer rates (Jiang et al., 2013). The formation of ice and the increase in size of the crystals lead to a loss of performance of the cooling system, since the joining of the ice crystals will have an insulating effect blocking the passage of air in the exchanger (Liu et al., 2005).
According to Al-Essa and Al-Zgoul (2012), in the food storage sector, deposition of ice occurs in the coils, since the coils operate at temperatures below 0ºC. In heat exchangers consisting of serpentines with fins, the ice deposited in the space between the fins block the passage of air. The deposition process will decrease the energy absorbed by the refrigerant which, according to Yang
(2010), will result in a decrease in cooling capacity between 30% and 57%. It is therefore relevant to find solutions that mitigate the formation of ice in heat exchangers. In this paper the effect of deactivating the operation of an evaporator at key moments during its operation in order to mitigate the formation of ice on its surface is studied.
2. MATERIAL AND METHODS
2.1 Experimental
The experimental prototype is shown in Fig. 1 and include a heat exchanger bank that consists in two finned-tube compact heat exchangers used in previous work (Carrilho et al., 2017), each one with dimensions 110×216.8×205 mm3, 16 tube (3/8 in) rows, 44 fins and heat exchange area of
572×103 mm2. During the tests the first heat exchanger (upstream) is always working and the
second one is momentary deactivated as soon as ice formation is visually detected in its surface.
Figure 1: Experimental prototype and diagram of equipment connections
Additionally Fig. 1 shows the experimental prototype assembly. A cooling chiller (MTA, EVO031) is responsible for lowering the temperature of the water solution with glycol (60%-40%) to the desired values, and this is achieved by circulating the fluid between the tank where it is stored and the interior of the chiller. A submersible pump (Hydor, Seltz 40) was placed inside the tank to maintain the circulation of the water-glycol solution inside the tubes of the exchangers. An air conditioning unit (PA Hilton, A573) provides fresh air throughout the heat exchanger bank. Air temperature and relative humidity were measured both at the inlet and outlet of the heat exchanger bank using a digital hygrometer (Rotronic, HygroLog NT2). The temperatures on the heat exchanger surface as well at fluid entrance and exit of heat exchangers were measured with T-type thermocouples and a Temperature Datalogger (Pico, TC08). The airflow flow velocity was measured with a hot wire anemometer (Testo, 425). The collection of images of ice formation on the surface of the exchangers throughout the tests was performed with a video camera (GoPro, H5).
2.2 Mathematical Formulation
The evaluation of the heat exchanger cooling power is obtained throughout an energy balance to the air side. The set of equations that allows this evaluation is present in the following (ASHRAE, 2011). The saturation pressure of the vapor was initially calculated by the formula,
ln(𝑝𝑤𝑠) =𝐶𝑇8+ 𝐶9+ 𝐶10𝑇 + 𝐶11𝑇2+ 𝐶12𝑇3+ 𝐶13ln(𝑇) Eq. (1) Where C8=-5800.22, C9=1.391449, C10=-0.04864, C11=4.18E-05, C12=-1.4E-08 and C13=6.545967.
Using the above result and the air relative humidity (𝜙), the partial pressure of the water vapor is given by Eq. (2).
With the previous result and total pressure value (p) it is possible to calculate the absolute humidity using Eq. (3):
𝜔 = 0.621945𝑝−𝑝𝑤𝑝𝑤 Eq. (3) The enthalpy of moist air is evaluated from:
ℎ = ℎ𝑑𝑎+ 𝜔ℎ𝑔 Eq. (4) Where the enthalpy of dry air (hda) is given by:
ℎ𝑑𝑎 ≅ 1.006T Eq. (5) In this equation T is the dry bulb temperature, in Celsius. The enthalpy of water vapor (hg) is
evaluated from:
ℎ𝑔 ≅ 2501 + 1.86 T Eq. (6) In this way, the final equation is obtained, and the enthalpy of the moist air is calculated by:
ℎ = 1.006T + 𝜔(2501 + 1.86T) Eq. (7) The cooling power, Q, is given by:
Q = 𝑚̇(ℎ1− ℎ2) Eq. (8) With the enthalpy of the moist air evaluated before (h1) and after (h2) the heat exchanger bank. The
air mass flow rate is given by:
𝑚̇ = 𝑉̇ ×1𝑣 Eq. (9) And the volumetric air flow rate is evaluated from:
𝑉̇ = v ×𝜋×𝑑4 Eq. (10) Where d represents the hydraulic diameter of the channel and v the air velocity. The specific volume of the moist air is calculated from Eq. (11).
𝜈 = 0.287042(T + 273.15)(1+1607858𝜔)𝑝 Eq. (11)
3. RESULTS AND DISCUSSION
A preliminary reference test was carried out using the experimental setup. In this reference test both heat exchangers were working, meaning that both heat exchangers were feed, in parallel, by the water-glycol solution. Table 1 shows the parameters for the reference test. This reference test was performed to compare the behavior of the heat exchangers bank for two different operating conditions in which the first (upstream) heat exchanger is always operating but the second one suffers two different interruption cycles. The results are analyzed separately in the following sections.
Table 1. Reference test parameters
Test HR (%) Tamb (ºC) Patm (hPa) Duration (min)
Reference 38.2% 25.9 1014.1 115
3.1 Performance Analysis for the First Operating Condition
In this first operating condition the second heat exchanger suffers an interruption of 3 minute every 15 minutes of operation. Additionally, two different air relative humidity values at inlet of the heat exchanger bank were used. Table 2 summarizes the parameters for this operating condition.
Table 2. Parameters for the test cycle 15-3
Test HR (%) Tamb (ºC) Patm (hPa) Duration (min)
B1 30 23.8 1013.3 125
B2 50 23.3 1013.7 134
B1 and B2 test results for the air temperature at the heat exchanger bank outlet and the corresponding cooling power are shown in Fig. 2 together with reference test results. After the first interruption, it is possible to observe the stability of the system to the temperature recorded during the 15 minutes of activity period. As for the temperatures recorded during the 3-minute pause, it is observed that the higher the RH value of the test, the higher the temperature recorded in the area after the cooling section. There is a slight difference in the maximum temperature values recorded in the 3-minute pause. In the reference test the temperature decreases during the first 50 minutes, when the accumulated ice begins to disturb the air flow. From that moment the temperature increases until reaching values similar as those obtained during the interruption of the circulation of the fluid in tests B1 and B2. That means that the defrost method used ensures lower temperatures over time.
Figure 2: Air temperature outlet (left) and cooling power (right) of B1 and B2 tests
In Fig. 3 (left) and Fig. 4 (left), we can observe that there is a significant accumulation of ice at the final of the operation time, before the interruption.
Figure 3: Ice accumulated in the exchanger at 105 min (left) / Ice accumulated after pause at 108 min (right) for test B1
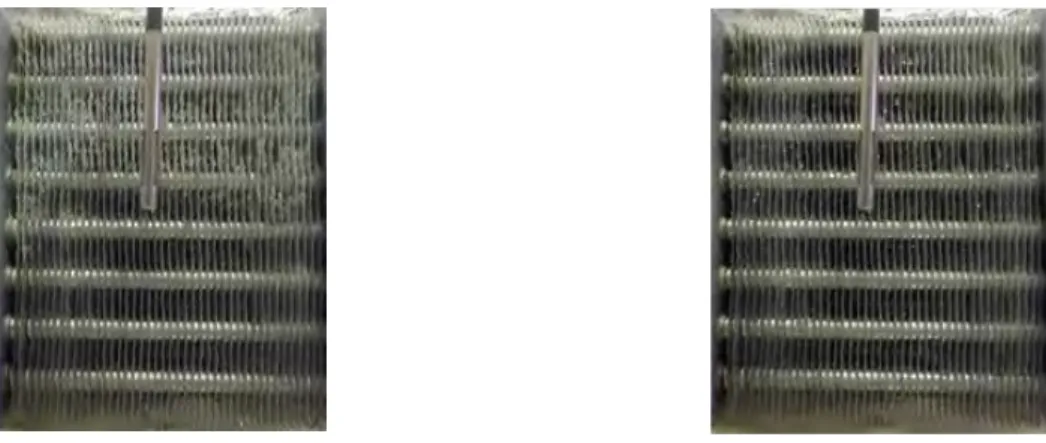
Figure 4: Ice accumulated in the exchanger at 112 min (left) / Ice accumulated after pause at 115 min (right) for test B2
However, after the interruption all the accumulated ice has been melted, Fig. 3 (right) and Fig. 4 (right), and the heat exchanger is again available for cooling as shown by the corresponding cooling power curve in Fig. 2 (right). In addition to the greater stability that can be verified, it is also verified that the system can keep the temperatures lower for longer, maintaining similar cooling power levels (see Fig. 2, right). This is due to the fact that the interruption time is enough to melt the formed ice and ensure good air flow conditions during the operation time of the refrigeration system.
3.2 Performance Analysis for the Second Operating Condition
Table 3 shows the parameters for the second operating condition. The second operating condition had as objective to verify how the increase of the circulation time of the fluid in the exchanger, maintaining the time of interruption, would affect the performance. So, the tests were performed for 30 minutes of operation of the second heat exchanger followed by 3 minute pause.
Table 3. Parameters for the test cycle 30-3
Test HR (%) Tamb (ºC) Patm (hPa) Duration (min)
B3 50 23.2 1014.7 113
Fig. 5 shows the air temperature and cooling power recorded during the test together with the reference test values. As can be observed the recorded temperature reaches new minimums with the passage of time. It is possible to state that there is a certain tendency in the system to maintain the stability at the temperature which is recorded after the passage of air through the cooling zone. The cooling power presents a behavior better than that obtained to the reference test, and tends to maintain a quite similar value along the test.
Figure 5: Air temperature outlet (left) and cooling power (right) of B3 test
In Fig. 6 it can be seen that the amount of ice formed is significant, but it is noteworthy that the time of interruption of circulation of the water-glycol solution for the B7 test was not sufficient to melt all the ice accumulated at 92 minutes. However the use of 30 minutes of operation of the exchanger bank with a programmed pause of 3 minutes, becomes a good defrost solution. It guarantees a longer period of operation avoiding changes of temperature and maintains the cooling power values quite similar to those obtained in the beginning of the reference test, still in the absence of the ice formation effect, in which the exchanger bank operates continuously without interruption.
Figure 6: Ice accumulated in the exchanger at 92 min, before interruption (left) and ice accumulated at 95 min, after the interruption (right)
4. CONCLUSIONS
Refrigeration, in a domestic or industrial point of view, takes a very important role in society. Nowadays, a big portion of the refrigeration processes are taken into account in the food and drinks storage, and also in the cooling of closed spaces. The need to obtain lower temperatures implies that evaporator component operate at lower temperatures than the water freezing point, a fact which clearly favors the formation of ice on their surfaces. The ice formation is detrimental to the system at thermal and energy levels, reason why its mitigation or removal is essential to ensure the desired operating conditions. This paper proposes a strategy that consists in the deactivation, for short periods, of the circulation of coolant on the heat exchangers during the operation of the refrigeration system. The results of this experimental study showed that the strategic deactivation of the coolant fluid circulation proved to be a viable operating option since it allowed a prolongation of the effective operations of the refrigeration system. Additionally, the refrigeration cooling power was also maintained in an adequate range during the operating time.
This study is within the activities of Project “PrunusPós - Optimization of processes for the storage, cold conservation, active and/or intelligent packaging and food quality traceability in post-harvested fruit products”, project n.º PDR2020-101-031695, Partnership n.º 87, initiative n.º 175, promoted by PDR 2020 and co-funded by FEADER within Portugal 2020.
REFERENCES
Al-Essa, Al-Zgoul, B., 2012. Building up frost depending upon conditions of air cooler operation. Int. J. Mechanics and Applications 2 (2), 1-4.
Amer, M., Wang, C., 2017. Review of defrosting methods. Renewable and Sustainable Energy Reviews 73, 53-74.
Amini, M., Pishevar, A., Yaghoubi, M., 2014. Experimental study of frost formation on a fin- and-tube heat exchanger by natural convection. Int. J. Refrigeration 46, 37-49.
ASHRAE, 2011. HVAC Applications. In: ASHRAE Handbook Collection; American Society of Heating, Refrigerating and Air Conditioning Engineers, Atlanta.
Carrilho, D., Silva, P.D., Pires, L., Gaspar, P.D., Nunes, J., 2017. Quantification of the thermal resistance variation in evaporators surface due to ice formation. Energy Procedia 142, 4151-4156.
Jiang, Y., Dong, J., Qu, M., Deng, S., Yao, Y., 2013. A novel defrosting control method based on the degree of refrigerant superheat for air source heat pumps. Int. J. Refrigeration 36, 2278-2288.
Jiang, Y., Fu, H., Yao, Y., Yan, L., Gao, Q., 2013. Experimental study on concentration change of spray solution used for a novel non-frosting air source heat pump system. Energy and Buildings 68, 707-712.
Liu, Z., Wang, H., Zhang, X., Meng, S., Ma, C., 2005. An experimental study on minimizing frost deposition on a cold surface under natural convection conditions by use of a novel anti- frosting paint. Part I. Anti-frosting performance and comparison with the uncoated metallic surface. Int. J. Refrigeration 29, 229-236.
Seker, D., Karatas, H., Egrican, N., 2004. Frost formation on fin-and-tube heat exchangers. Part I - Modeling of frost formation on fin-and-tube heat exchangers. Int. J. Refrigeration 27, 367-374.