Gang of Four: the Next Portuguese Unicorn
Carolina Gouveia de Figueiredo Gonçalves
Dissertation submitted as partial requirement for the conferral of Master in Finance
Supervisor:
Prof. Rui Meireles dos Anjos Alpalhão, Visiting Associate Professor, ISCTE Business School
G
an
g
o
f F
o
u
r:
t
h
e
N
ex
t
P
o
rt
u
g
u
es
e U
n
ico
rn
C
a
ro
li
na
G
o
u
v
ei
a
d
e F
ig
ue
ired
o
G
o
nç
a
lv
es
Abstract
Lately, the theme of Unicorns, new companies that reach a $ 1 billion valuation, has been the subject of discussion. There are many opinions regarding their evaluations and their future. In countries like United States of America, China and India, the number of Unicorns continues to grow and in Portugal 3 startups have already reached this status. In this ever-changing technological world, investors want more than ever to be one step ahead, so they want to predict who will be the future Unicorn. Based on this premise and based on the Portuguese scenario, we predict who will be the future Portuguese Unicorn, given the analogies between the 3 current Portuguese unicorns and a sample of 4 Portuguese startups. This study and its results may be useful to investors, entrepreneurs and financial advisors.
JEL classification: G00; G170
Resumo
O tema dos Unicórnios, novas empresas que atingem uma avaliação de 1 bilião de dólares, tem sido alvo de discussão nos últimos tempos. Muitas são as opiniões relativamente às avaliações e ao futuro das mesmas. Em países como os Estados Unidos da América, China e a Índia o número de Unicórnios não para de crescer e em Portugal 3 startups já atingiram este estatuto.
Neste mundo tecnológico e em constante mudança os investidores querem, cada vez mais, estar um passo à frente, deste modo querem prever qual será o futuro Unicórnio. Partindo desta premissa e com base no cenário de Portugal, prevemos qual será o futuro Unicórnio português, tendo em conta analogias entre os 3 atuais unicórnios portugueses e uma amostra de 4 startups portuguesas. Este estudo e os respectivos resultados poderão ser úteis a investidores, empreendedores e consultores financeiros.
Classificação JEL: G00; G170
Agradeço aos meus pais e ao meu irmão pelo apoio incondicional e pelo
esforço que fizeram durante toda a minha vida académica.
Ao Paulo um obrigado pela motivação durante todo este ano.
Agradeço também ao meu supervisor que teve sempre disponível e
proporcionou que esta dissertação fosse possível da maneira que a imaginei.
Contents
Chapter 1 ____________________________________________________________ 1 Introduction _________________________________________________________ 1 Chapter 2 ____________________________________________________________ 3 Literature Review _____________________________________________________ 3 1. Definition _________________________________________________________________________________ 3 2. Funding Rounds _____________________________________________________________________________ 6 3. Unicorn Growth _____________________________________________________________________________ 8 4. Valuation _____________________________________________________________________________________ 8 5. Prediction of the Future - Analogous Forecasting ________________________________________ 9 Chapter 3 ___________________________________________________________ 11 Data _______________________________________________________________ 11 1. Portuguese Unicorns ___________________________________________________________________ 11 1.1. Farfetch _________________________________________________________________________________________ 11 1.2. Outsystems _____________________________________________________________________________________ 12 1.3. Talkdesk ________________________________________________________________________________________ 132. Potential Portuguese Unicorns ___________________________________________________________ 14
2.1. Zaask ____________________________________________________________________________________________ 14 2.2. Uniplaces _______________________________________________________________________________________ 14 2.3. Codacy __________________________________________________________________________________________ 15 2.4. Unbabel _________________________________________________________________________________________ 16 Chapter 4 ___________________________________________________________ 17 Methodology ________________________________________________________ 17 1. Model Description _____________________________________________________________________ 17
1.1. Analogous Forecasting and Measures of Similarity for Two Functions __________ 17 1.2. Transformation the time series ________________________________________________________ 18
2. Methodology Application and Analysis ______________________________________________ 22
2.1. Calibrating _________________________________________________________________________________ 24 2.2. Adjusting the Length _____________________________________________________________________ 29 2.3. Valuation Forecast – Multiplication Factor ___________________________________________ 33
Chapter 5 ___________________________________________________________ 37 Concluding Remarks _________________________________________________ 37 References __________________________________________________________ 39
List of Graphs
Graph 1 - Categories of European Unicorns. Source: Atomico ___________________ 4 Graph 2 - Evolution of Unicorns in Europe. Source: Atomico ___________________ 6 Graph 3 - Funding Rounds Unicorns ______________________________________ 23 Graph 4 - Funding Rounds Startups _______________________________________ 24 Graph 5 -Funding Rounds of Unbabel and the Modified Funding Rounds of similar Unicorn (Talkdesk) ____________________________________________________ 27 Graph 6 - Funding Rounds of Codacy and the Modified Funding Rounds of similar Unicorn (Outsystems) __________________________________________________ 27 Graph 7 - Funding Rounds of Zaask and the Modified Funding Rounds of similar Unicorn (Farfetch) ___________________________________________________________ 28 Graph 8 - Funding Rounds of Unilaces and the Modified Funding Rounds of similar Unicorn (Talkdesk) ____________________________________________________ 28 Graph 9 - Funding Rounds of Codacy and the Modified Funding Rounds of similar Unicorn (Farfetch) ____________________________________________________ 32 Graph 10 - Funding Rounds of Zaask and the Modified Funding Rounds of similar Unicorn (Farfetch) ____________________________________________________ 32 Graph 11 - Forecasts Valuations Evolutions of Codacy and Zaask _______________ 36
List of Tables
Table 1 - Farfetch funding rounds. Source: Crunchbase _______________________ 12 Table 2 - Outsystems funding rounds. Source: Crunchbase _____________________ 13 Table 3 - Talkdesk funding rounds. Source: Crunchbase _______________________ 13 Table 4 - Zaask funding rounds. Source: Crunchbase _________________________ 14 Table 5 - Uniplaces fundign rounds. Source: Crunchbase _____________________ 15 Table 6 - Codacy funding rounds. Source: Crunchbase _______________________ 15 Table 7 - Unbabel funding rounds. Source: Crunchbase _______________________ 16 Table 8 – Data of 3 Unicorns (Farfetch, Ousystems and Taldesk)________________ 22 Table 9 - Data of 4 Startups (Codacy, Unbabel, Uniplaces and Zaask) ____________ 23 Table 10 - Calculation of Calibrating Coefficients ___________________________ 25 Table 11 - Calibrating Funding Rounds Series for Similar Companies ____________ 26 Table 12 - Forecasts Funding Rounds after using the calibration ________________ 29 Table 13 - Calculation of Matching Parameters ______________________________ 30
Table 14 - Adjusting the length of Funding Rounds for similar Companies ________ 31 Table 15 - Forecasts Funding Rounds after using the adjusting the length _________ 33 Table 16 - Valuations Predictions after Forecasts Funding Rounds ______________ 34 Table 17 - Valuations Predictions after Forecasts Funding Rounds ______________ 35
List of Figures
Figure 1 - Portuguese Unicorns Logos _____________________________________ 11 Figure 2 – Startups logo in study _________________________________________ 14
List of abbreviations and acronyms
CEO – Chief Executive Officer
ICT – Information and Communication Technology IPO – Initial Public Offering
PE – Private Equity US – United States VC – Venture Capital
Chapter 1
Introduction
Nowadays, the number of start-ups is higher than ever, and the main causes are information and communication technology (ICT) and social media (Kerai, 2017). Additionally, startups are seen as the boosters of value creation, economic growth and employment generation.
In the last 20 years, the internet improved the technological sector, and with the dot.com era a new wave of “highly valued private technological companies”, the so-called unicorns (Grillo, 2016, Kerai, 2017), has started.
The studies about this new concept of start-up companies, unicorns, and their valuation emerged after Aileen Lee’s article in Tech Crunch (Lee, 2013). It was the first association of a mythological figure (unicorn) with the rarity of reaching the $1 billion mark. Moreover, in this first study it was reported that around 0.07 percent of venture-backed companies achieved valuations above one billion dollars.
Unicorns are young companies with very high growth rates, and they are taking the attention of many investors in risk capital. However, it is difficult to value high-growth companies because their valuations are associated with growth prospects (Gobel, 2016). Furthermore, the risk capital inflows increase valuation levels (Zorgiebel, 2016), i.e., the money invested in each funding round tends to improve the valuations. In the same way, the increase of the company’s valuation is a consequence of the entry of an investor in the first phase that will allow the entry of more risk capital. However, the skeptics posit about the legitimacy of the unicorn’s valuations (Bralett, 2015).
Unicorns are not a rarity anymore, they exist all around the world, especially in markets like India, China, and the United States (Grillo, 2016). Moreover, Europe is accelerating the production of unicorns, and Portugal is not an exception. Nowadays, Portugal is home to three unicorns. The first born was Farfetch, in 2015, and in 2018 Outsystems and Talkdesk achieved the unicorn status in the private market. Thus, many investors keep an eye on Portuguese start-ups in order to predict the future Portuguese unicorn. However, the big question is “Who will be the next unicorn?”.
The remaining structure of this dissertation is the following: Chapter 2 presents the literature. Chapter 3 expose the description and explanation of the Portuguese unicorns and the startups’ data that will be analyzed as well as the preparation of the data. Chapter 4 outlines the model description, application of the model, reports the empirical results and the analyzation of the results. Finally, Chapter 5 summarizes and concludes.
Chapter 2
Literature Review
In this chapter, we will understand the unicorn phenomenon based on the literature about this topic that will be discussed as follows: First, a general overview of what are unicorn companies. Second, how the venture capital funding rounds work. Third, an overview of unicorn growth. Fourth, the valuations of unicorns and the drivers for Venture Capital investors. Finally, the prediction of future unicorns with an analogous forecasting basis borrowed from Szozda (2010).
1. Definition
A unicorn is a startup1 company with an equal or higher billion-dollar valuation, Aileen Lee (2013). It is not listed on the Stock Exchange (Brown & Wiles, 2015). Normally, the term is used to refer to startups based in the tech sector with a high market capitalization (Simon, 2016).
Lee, the founder of Cowboy Ventures, wanted to share the findings, but not before choosing an adequate name. “I played with different words like ‘home run,’ ‘megahit,’ and they just all sounded kind of ‘blah.’ So I put in ‘unicorn’ because they are -- these are very rare companies in the sense that there are thousands of startups in tech every year, and only a handful will wind up becoming a unicorn company. They’re really rare.” Lee said in an interview.
To Gornall and Strebulaev (2015), unicorns are companies that achieve a valuation equal or above $ 1 billion in one of its funding rounds, at least. On the other side, to Ochoa, Salas and Nunes (2016) unicorns are companies with a valuation above 1$ billion, which is calculated using the different funding rounds.
According to Simon (2016), the unicorns are young companies (less than 10 years old) with very high growth rates and generally operate in more than one country. These companies serve non-target customers and market niches because they offer innovative services and products. In other words, unicorns are changing the way the customers
1 Startup is a company created to develop a product or a service, under uncertainty conditions (Ries, 2011)
consume new services and products, such as Airbnb transformed the way that consumers rent houses (Fan, 2016).
Lee (2013, 2015) broke down the Unicorns in two categories: the consumer-oriented (companies where the primary customer is a consumer) and the enterprise-oriented companies. Moreover, the majority of the Unicorns are consumer-oriented and raise a lot of private capital. The two categories are subdivided among four business models:
➢ Consumer audience: Free for consumers, monetization through ads or leads ➢ E-commerce: The consumer pays through the internet or mobile.
➢ Software-as-a-service: User pay for cloud-based software. ➢ Enterprise software: Companies pay for larger scale software.
The unicorns are mostly software offering (Graph 1). However, some cases of hardware offering, like Carbon3D, exist.
Graph 1 - Categories of European Unicorns. Source: Atomico
Generally, the companies are created by experient founders, and the majority accompanies their companies for the long run (Lee, 2013). According to De Massis, Frattini and Quillico (2016) unicorns are “led by serial entrepreneurs” with experience. In 2013, Aileen Lee identified thirty-nine US-based companies that belong to the “unicorn club”. According to the update of Lee’s first paper (Lee, 2015), an increase to eighty-four US-based companies that were considered unicorns, was verified, around 115%. Besides
that, around 0.14 percent of venture-backed companies achieved valuations above one billion dollars.
Over the past years, the companies grew largely as anticipated, which triggered the coining of the Decacorn and the Hectacorn as special breeds of unicorns. Decacorns are startups that have achieved the ten-billion-dollar valuation, while Hectacorns, or super-unicorns, is the appropriate name for a company valued over one hundred billion dollars (Grillo, 2016).
To note, every major technology wave is the booster for the creation of new unicorns and more specifically for the creation of super-unicorns (Lee, 2013). The access of millions of users to new technologies, like the creation of smartphones and the explosion of social media, the growth of unicorns and consequently the gain of economies of scale2(Howe, 2017). In the 1990s, the dawn of the modern internet, raised the first unicorn of the history, Google Inc. While in 2000s, new social networks appeared, and Facebook was the super-unicorn of the decade (Grillo, 2016). More recently, the mobile web is contributing to the creation of more unicorns and investigators believe that it will be the reason for the rise of super-unicorn in the 2010s.
Nowadays, there are approximately 403 unicorns around the world (CB Insights) and 61 are European unicorns, these companies are no longer a rarity. Last year the record of new European unicorns was hit, with 17 new tech companies chieving the unicorn status (Graph 2).
2 “Economies of scale refer to reduced costs per unit that arise from increased total output of a product.” (Kenton, 2018 - Investopedia)
Graph 2 - Evolution of Unicorns in Europe. Source: Atomico
2. Funding Rounds
The Private Equity market became an important source of financing to companies with high-growth rates and the need for external financing. The Private Equity market can be divided into three subsets, the three Fs (family, friends, and fools), the business angels and the venture capitalists (Bender, 2014).
Venture Capital probably is the most relevant subset of the PE market and is an important source of financing for young companies. Sometimes is the only way for start-ups to feed its investments and continue to grow. According to De Massis, Frattini, and Quillico (2016) unicorns are VC backed companies.
According to Grillo (2016), when an entrepreneur creates a start-up, he owns one hundred percent of an idea that will be a company. Generally, this initial idea is financed by the entrepreneurs’ resources and by family and friends that do not know the business. Once the entrepreneur has the business idea defined and the company grows, he attracts investors that are interested in the business. This first big investment that a start-up receive is from business angels.
The first big investment is called “planting the seed” since it is an analogy for planting a seed for a tree and help the company in the first’s steps. The amount raised in the seed round is between $10k and $2M. Usually, this amount of money is spent in prototypes and market research.
When the company solidifies its business idea, it is important to continue growing up, but more capital is needed, so the company issues what is called a series A round. The amount raised in this round is used to develop the business and the product. The amount of money invested in this round is approximately $2M and $15M.
While in the seed round the investors invest in great ideas, in round A the investors are looking for companies with a strategy. Besides that, in the first round, the investors start to be involved in the business.
After the development moment the company needs to take the business to the next level. So, the company can access the second round of investment, the series B. The capital provided in this round is between $7M and $10M.
If all progresses according to plan and the success of the business is proven, the company improves its idea and starts to generate revenues. In this phase the investment is less risky, the investors want to be part of the business and this capital injected is called series C. Usually, the investors are hedge funds, private equity firms, investments banks, and large public equity investment funds.
Currently, the funding rounds are not limited to the rounds referred before, it can go beyond E+. The posterior rounds of C round have the purpose to prepare the companies for an IPO (initial public offering) and access public markets or they are acquired by other company, generally larger companies. This represents an exit strategy and it happens when the investors expect to recover the capital invested.
Nevertheless, the companies stay private longer, to have more access for a longer period to private equity capital (Erdogan, Kant, Miller, and Sprague, 2016). Since the private capital raise among the time that a company takes until an IPO is a determinant for success.
Furthermore, Lee (2013, 2015) found that it takes approximately seven years for unicorns to get a liquidity event3 . Enterprise companies take one year more than consumer companies to go public or be acquired by others.
3. Unicorn Growth
By looking at Unicorns growth, we are drawn to two growth models: the organic model and the inorganic model (Simon, 2016).
On one hand, the company grows according to an organic model, i.e., it grows through a volume of sales associated with an increasing output. The model follows market growth and it is the most common. On the other hand, the inorganic model is a growth associated with the acquisition of a new business, via acquisition, merger or takeovers.
Furthermore, start-ups that are financed by VC investors are growing faster in the last years, taking into account the called Time to Market Cap4 (Play Bigger Advisors 2016). According to the research, the “time to market cap” of firms founded between 2009 and 2013 is much higher than “time to market cap” founded between 2000 and 2003. This means that today firms are growing faster than firms founded a decade ago.
4. Valuation
Achieving Unicorn status is a competitive advantage over other firms since it brings recruiting and marketing benefits (Brown and Wiles, 2015). However, their valuation is a big concern for VC investors and other stakeholders. Since 91% of VC investors think that unicorns are overvalued (Gompers, Gornall, Kaplan, and Strebulaev, 2016) and the truth is that in average 48% of the reported unicorn post valuation is above its fair value (Gornall and Strebulaev, 2018). It means that the founders and late-stage investors inflate the reported valuations in order to achieve the unicorn status (Barlett, 2015).
Traditionally, companies are valued by past years’ performances. Conversely, valuations of unicorns are related to the funding rounds made by venture capital funds, which are called the post-valuations. This valuation is the main valuation metric used in the VC industry since they think it is a fair valuation and it is the result of the product of per share
3Liquidity event is an exit strategy, where founders and early investors cash out their ownership shares. (Kenton, 2018 - Investopedia)
4 Time to Market Cap is the time that takes to “reach certain market capitalization milestones”. (Play Bigger Advisors, 2016)
price of the last round and the total number of shares in all classes (Gornall and Strebulaev, 2018). However, it is a mistake to think that this formula works for VC-backed companies and reflects the company’s equity value. Therefore, the VC-VC-backed companies have shares with different terms, thus these shares have different values and the post valuation formula assume that we can use it among shares with the same values. Additionally, the VC investors agree with these overvaluations "in exchange for receiving enhanced preferred stock preferences" (Barlett, 2015). However, offering enhanced liquidation preferences will reduce the expected return of founders, comparing with the "true" startups’ valuation.
5. Prediction of the Future - Analogous Forecasting
Taking into account all the factors referred, VC investors want to make informed choices about startups in which they will invest, since they are looking for groundbreaking ideas, superior management expertise and a remarkable business model in order to make their investments a large success (Gobel, 2016). Thus, VC investors try to predict the next unicorn company, since “VCs might fear to miss the next Google, Facebook or Apple” (Zörgiebel, 2016). In order to predict future unicorn, it is important to define an appropriate forecasting methodology.
The use of analogies in forecasting is often used for decision support (Szozda, 2010). Forecasting by analogy is described as: "forecasting the future of a given variable by
using information about other variables, with similar but not simultaneous changes of time" (Cieslak, 2000).
According to Green and Armstrong (2007), the analogous forecasting model has five steps: “describing the target situation, selecting experts, identifying and describing analogies, rating similarity and deriving forecasts”.
The methodology that will be applied to predict the next Portuguese unicorn is based on Szozda (2010) that forecasts sales for new products with a short life cycle on a new country through an analogous forecasting method. Szozda’s method can be applied with a small data set, which is essential since the life cycles are too short to apply a standard time-series forecasting method, i.e., standard forecasting methods require historical data.
The goal of the research was to find which product introduced earlier to the market has the most similar sales figures to the new product. The measurement of similarity by Cieslak and Jasinski (1979) and the Euclidian Distance were used in the research. The first similarity measurement used in the study was the similarity of functions which was described by Cieslak and Jasinski (1979). It was used to check the similarity of the shape of compared objects. If the values of measurement are positive, the series has similar shapes (if one increases the other one will increase too). While the values of measurement are negative the series has opposite shapes. According to Diettmann (2002), the similarity is higher if the values of measure are closer to one.
The second similarity measurement used in the study was Euclidian Distance. It was used to check the similarity of the compared objects values. In order to have the most accurate comparison possible, the sales figures of the product introduced earlier in the market were modified by: “calibrating and/or adjusting the length of the figures being compared” (Szozda, 2010). Since these methodologies will increase the similarity between time series. Calibrating the figures changed the volume of sales being compared; while adjusting the length changes the unit of time being compared. The unit of time can be different, but need to be analogous (Szozda, 2010).
The methodology will be applied in order to find the next Portuguese unicorn. The study presented the effectiveness of analogous forecasting for products with a small life cycle and can be applied in other predictions. Since, “this forecast method allows the derivation of results with less than a 10% forecast error” (Szozda, 2010).
Chapter 3
Data
As mentioned before, the goal of this project is identifying the next Portuguese unicorn with the help of the current unicorns. So, a selection was made to define which companies could be part of the study.
1. Portuguese Unicorns
1.1. Farfetch
Farfetch is an e-commerce company, more specifically, it is an online luxury fashion platform. The company was founded by José Neves, a Portuguese entrepreneur, in 2007, when he realized the importance of giving an online presence to independent fashion boutiques. The initial idea was to aggregate all the brands and boutiques in just one platform.
Farfetch´s headquarters is in London and the main branches are in Porto, Lisbon, Braga, Guimarães, Los Angeles, Tokyo, New York, Shanghai, Hong Kong, São Paulo, and Dubai. The company operates in many international markets with the help of sites in local languages, such as Portuguese, Spanish, and English.
The beginning of the company was at the same time of the financial crisis. Additionally, the first investors (Advent Venture Partners) appeared only in 2010, with an investment of 4.5 million (Pimentel, 2018). After this initial funding round, Farfetch collected five rounds more, with a total value of 300 million dollars. With the 2015 round the company achieved the billion-dollar mark. In 2017, Farfetch had another funding round with a
value of $397 million, promoted by JD.com with the goal of Portuguese unicorn “attacking” the Chinese luxury fashion market. This last round turned JD.com into the biggest shareholder of Farfetch.
In 2018, Farfetch went public with an evaluation of 5.8 billion dollars and was the first Portuguese tech company listed in NYSE (New York Stock Exchange).
Announced Date Transaction Name Number of Investors Money raised (Million Dollars) Lead Investors
Sep 21, 2018 IPO 752,13 Public
Jun 21, 2017 Corporate round 1 397 JD.com
May 4, 2016 Series F 8 110 Eurazeo, IDG Capital,
Temasek Holdings
Mar 4, 2015 Series E 10 86 DST Global
May 1, 2014 Series D 6 66 Vitruvian Partners
Mar 3, 2013 Series C 4 20 Condé Nast
Jan 15, 2012 Series B 3 18 Index Ventures
Jul 9, 2010 Series A 1 4.5 Advent Venture
Partners
Table 1 - Farfetch funding rounds. Source: Crunchbase
1.2. Outsystems
Outsystems is a software company and is “the number one low-code platform for rapid application development” (Outsystems site). The company was founded in 2001, in Portugal, by Paulo Rosado (current CEO). Nowadays, Outsystems has headquarters in Atlanta (USA) and the branches are Lisbon, Proença-a-Nova, Braga, Boston, Utrecht, Londres, Dubai, Sydney, Tóquio, Hong-Kong, and Singapore.
The first investor appeared in 2005 with a 2.2 million dollars investment. In 2007, Armilar Venture Partners made an investment of 3.2 million dollars.
In 2011, Outsystems changed the core business in order to achieve more clients. The company started to sell subscriptions instead of perpetual licenses.
The first big funding round was in 2016, the amount invested was 55 million dollars by North Bridge Venture Partners & Growth Equity. In July 2018, Outsystems achieved the unicorn status with an investment of 360 million dollars from the KKR American fund and Goldman Sachs.
Announced Date Transaction Name Number of Investors Money raised (Million Dollars) Lead Investors
Jun 5, 2018 Private Equity Round
2 360 Goldman Sachs, KKR &
Co. (Kohlberg Kravis Roberts & Co.)
Feb 2, 2016 Series C 3 55 North Bridge Venture
Partners & Growth Equity
Jun 21, 2007 Series B 1 3.2 Armilar Venture Partners
Mar 8, 2005 Series B - 2.2 -
Mar 1, 2001 Seed Round 1 1 -
Table 2 - Outsystems funding rounds. Source: Crunchbase
1.3. Talkdesk
Talkdesk is a cloud contact center, it was founded in 2011 by Tiago Paiva (current CEO) and Cristina Fonseca. The founders wanted to “empower companies to continuously improve customer experience” (Taldesk site). The company has headquarters in San Francisco (USA) and offices in Lisbon and Porto.
The first investment was 50 thousand dollars when the founders went to San Francisco to present the idea and win a computer in a competition.
The first round was in 2014 by Storm Ventures and the money raised was 3 million dollars. In 2015 the company raised 21 million dollars in two rounds, the first was 15 million dollars from DJF and the second was 6 million dollars from Salesforce Ventures. In the last funding round, Talkdesk takes 100 million dollars, achieved a valuation of 1.225 million dollars and consequently became a unicorn. Talkdesk became the first CCaaS (contact center as a service) unicorn.
Announced Date Transaction Name Number of Investors Money raised (Million Dollars) Lead Investors
Oct 3, 2018 Series B 2 100 Viking Global
Investors
Oct 7, 2015 Series A 3 6 Salesforce
Ventures
Jun 9, 2015 Series A 2 15 DFJ
Sep 16, 2014 Seed Round 2 3 Storm Ventures
Oct 26, 2011 Angel Round 2 0.45 -
2. Potential Portuguese Unicorns
2.1. Zaask
Zaask is a platform for consumers to hire professional to perform a service. The company was created in 2012. In the beginning of the crisis, the founder, Luís Pedro Martins, wanted to give opportunities to unemployed persons.
Initially, the business model was for each service the company received a commission. However, Zaask found that some services were done, and they do not receive anything. So, in 2014, the startup recreated the business model, and the professionals start to buy packs.
The seed round had two rounds, i.e., with a total amount of 2.15 million dollars.
Announced Date Transaction Name Number of Investors Money raised (Million Dollars) Lead Investors Nov 29, 2017 Corporate Minority 0.59 SDC Investimentos
Jan 1, 2015 Seed Round 2 1.4 -
Jun 1, 2013 Seed Round 3 0.74 -
Table 4 - Zaask funding rounds. Source: Crunchbase
2.2. Uniplaces
Uniplaces was created with the aim of facilitating the accommodation process between students and owners. The goal is providing both an excellent service and consequently renewing an old-fashioned market.
The startup was created in 2013 by Mariano Kostelec, Ben Grech and Miguel Santo Amaro. Uniplaces became an international reference portal for booking university accommodation. The company has headquarters and the main office in Lisbon.
In 2012, Uniplaces was the first project to incubate in Startup Lisboa, for 18 months. In this period, they achieved the first funding round with an amount of 200 thousand dollars from a business angel group, Shilling Capital.
In 2015, was the first big funding round with a total value of 24 million dollars, made by Atomico fund. Announced Date Transaction Name Number of Investors Money raised (Million Dollars) Lead Investors
Nov 3, 2015 Series A 5 24 Atomico
Oct 8, 2014 Seed Round 4 2.2 Octopus
Ventures
Nov 11, 2013 Seed Round 3 0.72 Octopus
Ventures
Jul 1, 2012 Seed Round 3 0.2 Shilling
Capital
Apr 10, 2012 Grant 1 0.04 -
Table 5 - Uniplaces fundign rounds. Source: Crunchbase
2.3. Codacy
Codacy burned in 2012, when Jaime Jorge, was finishing his master thesis. The startup consists of a platform that allows developers to improve code quality and monitor technical debt, since the platform is dedicated to code review.
Codacy became known in the entrepreneurial ecosystem in 2014 when it won the Beta prize in Web Summit competition.
The first funding round was in 2013 with an amount of 500 thousand dollars. Two years later the startup raised 1.1 million dollars on the second funding round. In 2017, the company raised 5.1 million dollars in series A from EQT Ventures.
Announced Date Transaction Name Number of Investors Money raised (Million dollars) Lead Investors
Aug 17, 2017 Series A 5 5.1 EQT
Ventures
Oct 16, 2015 Seed Round 5 1.1 -
Nov 20, 2013 Seed Round 3 0.5 -
2.4. Unbabel
Unbabel was founded in 2013 by Bruno Prezado, Hugo Silva, João Graça, Sofia Pessanha and Vasco Pedro. The startup consists of a platform for human translation by combining human expertise and artificial intelligence.
In 2014, the startup raised 1.620 million dollars to develop and improve the platform. Two years later the company received an investment of 5 million dollars.
After 5 years of life, Unbabel raised in series B 23 million dollars.
Table 7 - Unbabel funding rounds. Source: Crunchbase Announced Date Transaction Name Number of Investors Money raised (Million Dollars) Lead Investors Jan 11, 2018 Series B 7 23 Oct 31, 2016 Series A 4 5
May 2, 2015 Seed round 4 1.5
Jan 3, 2015 Seed round 1 50K
Jul 18, 2014 Seed round 19 1.5M
Chapter 4
Methodology
The present chapter will illustrate the methodology applied to conclude which will be the future Portuguese unicorn from the data previously described.
The first subtopic includes the description of the model that was applied and in the second part shows the application and the results.
1. Model Description
We divided the prediction of the future unicorn in two main parts: i) analogous forecasting and measures of similarity for two functions, ii) transformation the times series, and iii) forecasting valuation – multiplication factor.
According the similarities between Unicorns and Startups it is possible to calculate the future values of funding rounds. Through the prediction it is calculated how many times startups takes to achieve the same values of Unicorns, so we predict which is the first of the four startups to achieve the unicorn status.
1.1. Analogous Forecasting and Measures of Similarity for Two
Functions
The analogies can find by measure of similarity of functions which is described by Cieslak and Jasinski (1979). The measure of similarity is applied according the following conditions:
A. The functions f and g are given
B. But the functions f and g are analyzed in ranges [a,b] and [c,d] then b-a=d-c C. In the range [a, b] points a < a1 <...<an < b are analyzed, and in the range [c, d]
points c < c1 <...< cn < d are analyzed
D. We distinguish pairs of lines going through points {ai, f(ai)} and {ai +1, f(ai + 1)} and {ci, g(ci)} and {ci + 1, g(ci + 1)},
E. 𝛼𝑖 is a measure of the angle created by two lines described in the last point.
𝑚𝑖 = {1 − 2 𝜋𝛼𝑖 −𝛼𝑖
𝜋
When functions have the same monotonicity When functions have different monotonicity
The angle 𝛼𝑖 is determined by using the following formula: 𝑡𝑔 𝛼𝑖 = (𝑓(𝑎𝑎𝑖+1) − 𝑓(𝑎𝑖) 𝑖+1− 𝑎𝑖 ) − ( 𝑔(𝑐𝑖+1) − 𝑔(𝑐𝑖) 𝑐𝑖+1− 𝑐𝑖 ) 1 + (𝑓(𝑎𝑎𝑖+1) − 𝑓(𝑎𝑖) 𝑖+1− 𝑎𝑖 ) ( 𝑔(𝑐𝑖+1) − 𝑔(𝑐𝑖) 𝑐𝑖+1− 𝑐𝑖 ) A similarity measure of functions f and g is determined by:
𝑚 = 1 𝑛∑ 𝑚𝑖
𝑛
𝑖=1
The similarity measure varies between -1 and 1.
If the values of measure are positive the series has similar shapes (if one increases the other one will increase too). While, the values of measure are negative the series has opposite shapes. According to Diettmann (2002), the similarity is higher if the values of measure is closer to one.
With the values of funding rounds, an analogous forecasting can be calculated. We will calculate the similarity of startups with the actual Portuguese unicorns and choose the startup that has the higher similarity with Portuguese unicorns.
1.2. Transformation the time series
In order the comparison be the most accurate as possible, we can change the amounts of the funding rounds of the startups by: “calibrating and/or adjusting the length of the figures being compared” (Szozda, 2010), in this case are the Portuguese unicorns. Since these methodologies will increase the similarity between time series. Calibrating the figures changes the amounts invested being compared; while adjusting the length changes the amount of time being compared.
(2)
1.2.1. Calibrating
Since the values of the variable (funding round) of startups can be lower or higher than the variable values of the Unicorns, those values need to be calibrated. Calibrating is done by applying the following procedure:
● Variable values of Unicorns and Startups in time series 𝑛 + 1, … , 𝑛 + 𝑘; ● Variable values for unicorns 𝑈1, … , 𝑈𝑘 are given;
● Variable values for startups 𝑆1, … , S − k for k>2, are given;
● Calibrating Coefficient 𝑤𝑘, for each k is calculated and it is choosing the lower one;
● It permits to change from time series (𝑈1, … , 𝑈𝑘) into (𝑉1, … , 𝑉𝑘), the calibrated values:
𝑉𝑖 = 𝑤𝑘. 𝑈𝑖, 𝑤𝑖𝑡ℎ 𝑖 = 1, … , 𝑘.
The calibrating coefficient can be higher or lower than 1, with the assumption it will be higher than zero.
To calculate the similarity is used the following formula:
𝑓𝑘 =
𝑑𝑘(𝑒) 𝑚𝑘
Where:
𝑚𝑘- is the measure of simalirity defined in the first point (formula (3)); 𝑑𝑘(𝑒)- Euclid Distance: 𝑑𝑘(𝑒) =∑ √(𝑠𝑖−1− 𝑣𝑖−1) 2+ (𝑠 𝑖 − 𝑣𝑖)2 𝑘 𝑖=2 𝑘 − 1
The calibrating coefficient 𝑤𝑘 is search for lowest value function.
The calculated calibrating coefficient 𝑤𝑘 is used to determine the variable forecast for
startups for 𝑘 + 1, … , 𝑘 + 𝑛:
𝑝𝑘+𝑖 = 𝑣̂𝑘+𝑖 = 𝑤𝑘 . 𝑢𝑘+𝑖 𝑤𝑖𝑡ℎ 𝑖 = 1, … , 𝑛
1.2.2. Adjusting the Length
The time that a startup takes to achieve the billion-dollar mark compared with other startups can lower or higher. So, the length of time needs to be adjusted.
(5) (4)
(6)
The unit of time can be different, but need to be analogous (Szozda, 2010). A matching parameter need to transform the time-series is 𝛿k. So, adjusting the length is completed
via following procedure:
• Modifying the time series for variable of Portuguese Unicorns (𝑣1, … , 𝑣𝑘) and the
time series for startups (𝑠1, … , 𝑠𝑘).
• For time series of Unicorns (𝑣1, … , 𝑣𝑘) the matching parameter is 𝛿k, and that
time series is transformed into the time series (𝑒1, … , 𝑒𝑟) where 𝑟 ≥ 𝑘.
• Similarity is calculated by function 𝑓𝑘 with formula defined above.
As well as seen in the calibrating section, the matching parameter 𝛿k is search for the lowest function value. In one hand, if the matching parameter is lower than 1 (𝛿k<1), it is assumed as a portion of unit of time. In the other hand, if the matching parameter is higher than 1 (𝛿k>1), it is given as a multiplication influence of unit of time.
Furthermore, the forecast for startups can be calculated if the matching parameter is different than zero (𝛿k ≠ 0) and the time series (𝑣1, … , 𝑣𝑘+𝑛) is transformed in (𝑒1, … , 𝑒𝑘+𝑛). So the forecast is equal to:
𝑝𝑘+𝑖 = 𝑒𝑘+𝑖 𝑤𝑖𝑡ℎ 𝑖 = 1, … , 𝑛.
1.2.3. Valuation Forecast – Multiplication Factor
Szozda permits us to calculate the future funding rounds for each startup. However, to predict the potential Portuguese unicorn we need to forecast the valuation of startups (Codacy, Unbabel, Uniplaces, Zaask).
The analogous forecasting methodology is based in similarities between the variables in study. Subsequently, we use the same scheme to forecast valuations.
It is known the amount invested in the funding rounds that turns the startups into Unicorns, and the percentage that these investors received for the investment made. Accordingly, the weighting calculation is the following:
• 𝑥 is the amount of money invested in the funding round;
• 𝑦 is the percentage in the company that this last investor will receive /represent in the company for the investment made;
• So 𝑘 will be:
𝑘 = 1 𝑦
After, we have the percentages (y) of the last investors, of the actual Portuguese Unicorns (Farfetch, Outsystems and Talkdesk) it is calculated a multiplication factor with support of weighted average. So, the formula of multiplication factor is:
𝐹 = ∑ 𝑥𝑖 ∗ 𝑘
𝑛 𝑖=1
∑𝑛 𝑥𝑖
𝑖=1
Where n is the number of unicorns that we have in the study.
Therefore, the forecast valuation for startups is the forecast of funding round multiplied by the multiplication factor. The valuations are calculated for each momentum and the first with $1 billion is the future unicorn.
(10) (9)
2. Methodology Application and Analysis
In this section is presented the application of methodology described in the previous section. The values of funding rounds of Portuguese Unicorns are known. As well, the four Portuguese startups that were selected in order to be analysed, where collected the same variable values in order to calculate the forecasts.
The unit of time used in our study is momentums, since the years of funding rounds were nominated as momentums (1, 2, 3, etc.).
According the data presented before, in chapter 3, we sum the funding rounds with the same domination, even if it was made in different years.
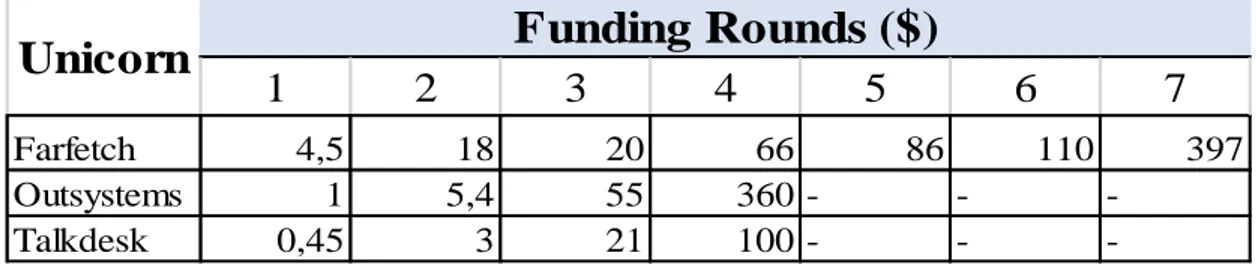
The following tables 8 and 9 present the data of analysed Portuguese Unicorns (Farfetch, Outsystems and Talkdesk) and startups (Codacy, Unbabel, Uniplaces and Zaask), and the graphs 3 and 4 are evolution of respective funding rounds of each Unicorn and Startup.
1
2
3
4
5
6
7
Farfetch 4,5 18 20 66 86 110 397 Outsystems 1 5,4 55 360 - -
-Talkdesk 0,45 3 21 100 - -
-Unicorn
Funding Rounds ($)
Graph 3 - Funding Rounds Unicorns
1
2
3
4
5
6
7
Codacy 1,6 5,1 - - - - -Unbabel 3,17 5 23 - - - -Uniplaces 0,04 2,12 24 - - - -Zaask 2,14 - - --Startups
Funding Rounds ($)
Table 9 - Data of 4 Startups (Codacy, Unbabel, Uniplaces and Zaask)
0 50 100 150 200 250 300 350 400 450 0 1 2 3 4 5 6 7 8 M on ey R ai sed ( m illi on d olla rs ) Momentuns
Graph 4 - Funding Rounds Startups
The calculations are made for each startup, since the calibrating coefficient and the matching parameter calculated change from startup to startup, like an individual application of the model and in the end the conclusion is made with the four together. In section 2.1 we applied the first transformation that is calibrating. Section 2.2 it is explained the adjusting the length. Section 2.3 explain the valuations forecasts by applying a multiplication factor.
2.1. Calibrating
Through the sequence presented in model description section, the first transformation is calibrating. Thus, next table (10) presents the calculations of calibrating coefficients.
0 5 10 15 20 25 30 0 1 2 3 4 5 6 7 8 M on ey R ai sed ( m illi on d olla rs ) Momentuns
Zaask - Startup Uniplaces - Startup Codacy - Startup Unbabel - Startup
W1 W2 W3 Farfetch 0,36 0,28 0,28 Outsystems 1,60 0,94 0,94 Talkdesk 3,56 1,70 1,70 Farfetch 0,70 0,28 1,15 0,28 Outsystems 3,17 0,93 0,42 0,42 Talkdesk 7,04 1,67 1,10 1,10 Farfetch 0,01 0,12 1,20 0,01 Outsystems 0,04 0,39 0,44 0,04 Talkdesk 0,09 0,71 1,14 0,09 Farfetch 0,48 0,48 Outsystems 2,14 2,14 Talkdesk 4,76 4,76
Funding Rounds ($)
CalibratingCoefficient - W*
Codacy
Unbabel
Uniplaces
Zaask
Table 10 - Calculation of Calibrating Coefficients
The best calibrating coefficient is the lower one with permissive that need to be higher than zero.
After the calibrating coefficients are calculated, we calculate the function values. To calculate the function values, we calculate the Euclidian Distance and measure the similarity between each Unicorn and startup, with help of equation (1) and (2).
The follow table represents the transformation of time series of Portuguese Unicorns, which is the base to forecast the values of startup.
1
2
3
4
5
6
7
Farfetch 0,28 1,28 5,10 5,67 18,70 24,37 31,17 112,48 0,05 Outsystems 0,94 0,94 5,10 51,94 340,00 0,24 Talkdesk 1,70 0,77 5,10 35,70 170,00 0,28 Farfetch 0,28 1,25 5,00 5,56 18,33 23,89 30,56 110,28 3,25 Outsystems 0,42 0,42 2,26 23,00 150,55 2,39 Talkdesk 1,10 0,49 3,29 23,00 109,52 1,69 Farfetch 0,01 0,04 0,16 0,18 0,59 0,76 0,98 3,53 4,29 Outsystems 0,04 0,04 0,22 2,20 14,40 8,45 Talkdesk 0,09 0,04 0,27 1,87 8,89 8,18 Farfetch 0,48 2,14 8,56 9,51 31,39 40,90 52,31 188,80 1,86 Outsystems 2,14 2,14 11,56 117,70 770,40 4,46 Talkdesk 4,76 2,14 14,27 99,87 475,56 4,96 Codacy Unbabel Uniplaces ZaaskSartup Unicorn
Calibrating Coefficient - W*Vk - Modified Funding Rounds
Function
Value
Zaask are compared to Farfetch (table 11). Additionally, Unbabel is compared to Talkdesk.
The results of calibrating for each startup are shown on the following graphs (5, 6, 7 and 8). Momentum 1 Momentum 2 Farfetch 1,28 5,1 Codacy 1,6 5,1 1,28 5,1 1,6 5,1 0 1 2 3 4 5 6 Fu nding R ou nds ( mil lion $)
Momentum 1 Momentum 2 Momentum 3
Talkdesk 0,49 3,29 23 Unbabel 3,15 5 23 0,49 3,29 23 3,15 5 23 0 5 10 15 20 25 Fundi ng R ound s (mil lion $)
Graph 6 - Funding Rounds of Codacy and the Modified Funding Rounds of similar Unicorn (Outsystems)
Graph 5 -Funding Rounds of Unbabel and the Modified Funding Rounds of similar Unicorn (Talkdesk)
Thru the first transformation, calibrating, it is possible to calculate a forecast for each startup (table 12). Momentum 1 Farfetch 2,14 Zaask 2,14 2,14 2,14 0 0,5 1 1,5 2 2,5 Fundi ng R ound s (mil lion $)
Momentum 1 Momentum 2 Momentum 3
Farfetch 0,04 0,16 0,18 Uniplaces 0,04 2,12 24 0,040,04 0,16 2,12 0,18 24 0 5 10 15 20 25 30 Fundi ng R ound s (mil lion $)
Graph 8 - Funding Rounds of Unilaces and the Modified Funding Rounds of similar Unicorn (Talkdesk)
Graph 7 - Funding Rounds of Zaask and the Modified Funding Rounds of similar Unicorn (Farfetch)
2
3
4
5
6
7
Codacy - 5,67 18,70 24,37 31,17 112,48
Unbabel - - 109,52 - -
-Uniplaces - - 0,59 0,76 0,98 3,53
Zaask 8,56 9,51 31,39 40,90 52,31 188,80
Startups
Forecast Funding Rounds - Calibrating
Table 12 - Forecasts Funding Rounds after using the calibration
To Codacy it is possible to calculate a forecast for funding round 𝑝𝑘+1(𝑤) equal to $5,67 million, and 𝑝𝑘+2(𝑤) with a value of $18,70 million, the 𝑝𝑘+3(𝑤) equal to $24,37 million, 𝑝𝑘+4(𝑤) forecast is $31,17 million, and the last 𝑝𝑘+5(𝑤) equal to $112,48 million.
A forecast 𝑝𝑘+1(𝑤) is calculated to Unbabel with a value of $109,52 million. As well to Uniplaces forecasts 𝑝𝑘+1(𝑤) is calculated with a value $0,59 million, 𝑝𝑘+2(𝑤) equal to $0,76 million, 𝑝𝑘+3(𝑤) with a value of $0,98 million and the last forecast calculated 𝑝𝑘+4(𝑤) equal to $3,53 million.
For Zaask the forecasts that is possible to calculate are 𝑝𝑘+1(𝑤) equal to $8,56 million, 𝑝𝑘+2(𝑤) equal to $9,51 million, 𝑝𝑘+3(𝑤) with a value $31,39 million, 𝑝𝑘+4(𝑤) equivalent to $40,90 million, 𝑝𝑘+5(𝑤) with a value $52,31 million and finally a 𝑝𝑘+6(𝑤) equal to $188,80 million. The next phase is checking if adjusting the length improve the previous results.
2.2. Adjusting the Length
As it was explained in the model description adjusting the length starts with the calculation of matching parameters. The next table (13) represents the calculation of the matching parameters:
δ Farfetch 1,05 Outsystems 1,11 Talkdesk 1,14 Farfetch 2,64 Outsystems 1,21 Talkdesk 1,16 Farfetch 69,25 Outsystems 10,65 Talkdesk 12,04 Farfetch 1,00 Outsystems 1,00 Talkdesk 1,00 Matching Parameters Codacy Unbabel Uniplaces Zaask
Table 13 - Calculation of Matching Parameters
As it was explained the adjusting the length is calculated to improve the results obtained in the previous section. Then, the matching parameters are calculated by compare the initial funding rounds of startups and the modified funding rounds of Unicorns.
In order to maintain the robustness of this dissertation and to apply correctly the Szozda methodology Unbabel and Uniplaces were excluded from the rest of our study, since matching parameters are very dissimilar compared with Codacy and Zaask. This means, matching parameters are higher than 2 what jeopardizes the robustness of the values to be forecasted.
Then, the matching parameters were estimated, and we use them to calculate the function values. The sequence is the same, we compute the Euclidian distance and measure the similarity between each startup and Unicorns, with support of equations (3) and (6). Using the matching parameters 1,05 (Codacy - Farfetch) and 1 (Zaask – Farfetch) it is obtained better results than in calibrating, since the functions values are lower, as it can be seen in the following table (14).
In the succeeding table are presented the length of time series for Portuguese Unicorns (Farfetch, Outsystems and Talkdesk).
1
2
3
4
5
6
7
Farfetch 1,05 1,53 5,41 7,91 20,77 27,29 57,12 78,74 0,04 Outsystems 1,11 1,51 15,97 152,72 227,80 3,89 Talkdesk 1,14 1,48 14,38 97,10 98,60 3,32 Farfetch 1,00 2,14 8,56 9,51 31,39 40,90 52,31 188,80 1,74 Outsystems 1,00 2,14 11,56 117,70 770,40 4,88 Talkdesk 1,00 2,14 14,27 99,87 475,56 6,14Unicorn
Sartup
Matching Parameter - δ*ek - Modified Funding Rounds
Function
Value
Codacy
Zaask
improved the function value, i.e., decrease from 0,05 (table 11) to 0,04. For Zaask the function value also decreases from 1,86 (table 11) to 1,74.
The results of adjusting for Codacy and Zaask are shown on the following graphs (9 and 10). Momentum 1 Momentum 2 Farfetch 1,53 5,41 Codacy 1,6 5,1 1,53 5,41 1,6 5,1 0 1 2 3 4 5 6 Fundi ng R ound s (mil lion $) Momentum 1 Farfetch 2,14 Zaask 2,14 2,14 2,14 0 0,5 1 1,5 2 2,5 Fundi ng R ound s (mil lion $)
Graph 9 - Funding Rounds of Codacy and the Modified Funding Rounds of similar Unicorn (Farfetch)
Graph 10 - Funding Rounds of Zaask and the Modified Funding Rounds of similar Unicorn (Farfetch)
With the adjusting the length is possible to compute forecasts for Codacy and Zaask (table 15).
2
3
4
5
6
7
Codacy - 7,91 20,77 27,29 57,12 78,74
Zaask 8,56 9,51 31,39 40,90 52,31 188,80
Startups
Forecast Funding Rounds - Adjusting
Table 15 - Forecasts Funding Rounds after using the adjusting the length
For Codacy we calculate a forecast 𝑝𝑘+1(𝛿) equal to $7,91 million, and 𝑝𝑘+2(𝛿) with a value of $20,77 million, the 𝑝𝑘+3(𝛿) equal to $27,29 million, 𝑝𝑘+4(𝛿) forecast is $57,12 million, and the last 𝑝𝑘+5(𝛿) equal to $78,74 million.
For Zaask the forecasts are 𝑝𝑘+1(𝛿) equal to $8,56 million, 𝑝𝑘+2(𝛿)equal to $9,51 million, 𝑝𝑘+3(𝛿) with a value $31,39 million, 𝑝𝑘+4(𝛿) equivalent to $40,90 million, 𝑝𝑘+5(𝛿) with a value $52,31 million and finally a 𝑝𝑘+6(𝛿) equal to $188,80 million.
2.3. Valuation Forecast – Multiplication Factor
We have the percentage of capital acquired by each investor in the funding round that turns the startup into the actual unicorns (Farfetch, Outsystems and Talkdesk).
As it was explained before, Farfetch in series E raised $86 million from DTS Global in exchange of 8,6% - a calculation made according the valuation in the final of the round. Outsystems in the Private Equity Round raised $360 million from Goldman Sachs, KKR & Co. in exchange of 35%.
Finally, Talkdesk in series B raised $100 million and gets an evaluation of $1.225 million from Viking Global Investors in exchange of 8,2% of the company - a calculation made according the valuation in the final of the round.
By using the formula explained before the multiplication factor is equal to 5,96, which that each one of the forecasts of startups funding rounds were multiplied by this multiplication factor.
2
3
4
5
6
7
Codacy - 34 111 145 186 670 Unbabel - - 653 - - -Uniplaces - - 4 5 6 21 Zaask 51 57 187 244 312 1125Forecast Valuations - Calibrating
Table 16 - Valuations Predictions after Forecasts Funding Rounds
As it was explained before, Unbabel and Uniplaces are not considered for the final calculations. However, it is important to make a valuation prediction of these startups according the values obtained in calibrating phase.
To Codacy it is possible to calculate a future valuation 𝑝𝑘+1(𝐹) equal to $34 million, and 𝑝𝑘+2(𝐹) with a value of $111 million, the 𝑝𝑘+3(𝐹) equal to $145 million, 𝑝𝑘+4(𝐹) forecast is $186 million, and the last 𝑝𝑘+5(𝐹) equal to $670 million.
A forecast 𝑝𝑘+1(𝐹) is calculated to Unbabel with a value of $653 million. As well to Uniplaces forecasts 𝑝𝑘+1(𝐹) is calculated with a value $4 million, 𝑝𝑘+2(𝐹) equal to $5 million, 𝑝𝑘+3(𝐹) with a value of $6 million and the last forecast calculated 𝑝𝑘+4(𝐹) equal to $21 million.
For Zaask the forecasts that is possible to calculate are 𝑝𝑘+1(𝐹) equal to $51 million, 𝑝𝑘+2(𝐹) equal to $57 million, 𝑝𝑘+3(𝐹) with a value $187 million, 𝑝𝑘+4(𝐹) equivalent to $244 million, 𝑝𝑘+5(𝐹) with a value $312 million and finally a 𝑝𝑘+6(𝐹) equal to $1125 million.
According to table 16, we can predict the future Unicorn since one of the four startups achieve the valuation of $1.000 million. So, it appears that the three existing Portuguese unicorns will be pass to four in the Unicorn club for the foreseeable future.
Yet we can put forward the educated guess that Unbabel can take a billion-dollar mark faster than the others, since the valuation forecast of the next momentum is $653 million. Unfortunately, we cannot forecast the following funding rounds with appropriate precision.
Sticking to the two candidates whose valuations we can predict up to round seven, Zaask is the most likely to achieve the billion-dollar mark, since in the momentum seven its predicted valuation is $1125 million.
The next phase was calculating the valuation predictions after the computation of forecasts for adjusting the length (table 17).
2
3
4
5
6
7
Codacy - 47 124 163 340 469 Zaask 51 57 187 244 312 1125
Forecast Valuations - Adjusting
Table 17 - Valuations Predictions after Forecasts Funding Rounds
The final forecast is the valuations predictions according forecasts calculated in the phase of adjusting the length and by multiplying these funding rounds forecasts by the multiplication factor.
Conferring, the estimates in the next funding round to Codacy it is possible to calculate a forecast 𝑝𝑘+1(𝐹) equal to $47 million, and 𝑝𝑘+2(𝐹) with a value of $124 million, the 𝑝𝑘+3(𝐹) equal to $163 million, 𝑝𝑘+4(𝐹) forecast is $340 million, and the last 𝑝𝑘+5(𝐹) equal to $469 million.
For Zaask the forecasts that is possible to calculate are 𝑝𝑘+1(𝐹) equal to $51 million, 𝑝𝑘+2(𝐹)equal to $57 million, 𝑝𝑘+3(𝐹) with a value $187 million, 𝑝𝑘+4(𝐹) equivalent to $244 million, 𝑝𝑘+5(𝐹) with a value $312 million and finally a 𝑝𝑘+6(𝐹) equal to $1125 million.
Graph 11 - Forecasts Valuations Evolutions of Codacy and Zaask
Concluding, between Codacy and Zaask the most likely to achieve the billion-dollar mark is Zaask, since in the next six funding rounds the startup achieve a valuation of $728 million (graph 11) and Codacy in five funding rounds only achieve $304 million.
0 200 400 600 800 1000 1200
Momentum 2 Momentum 3 Momentum 4 Momentum 5 Momentum 6 Momentum 7
Va lua tion mil lion dol la rs ( $)
Chapter 5
Concluding Remarks
Over the last years, the evolution of technology and the entrepreneurship have brought new and even more younger companies with a lot of potential. A direct consequence of this progress is the appearance of Unicorns.
After the definition of Unicorns, all the startups want to be the next. Also, investors want more than ever to be one step ahead and make the right selections, so they want to predict who will be the future Unicorn. By having accurate forecast data investors can make informed choices.
In this study we used a tested model of sales prediction to predict the future Portuguese Unicorn. As far as we know this is the first study which attempts to predict a Unicorn through the funding history of other companies that already achieved the Unicorn status. The presented methodology allows us to determine the following analogous forecasting stages: First, check the similarity between the Unicorns and startups, using the time series representing its funding rounds. Secondly, the transformation of the times series of similar companies by applying the calibrating methodology and calculate the forecasts for this stage. Subsequently, in order to improve the calibrating calculation, it is applied a adjusting the length methodology and the forecasts for funding rounds are calculated. The next stage is computing the forecast valuations by using a multiplication factor based on the actual Unicorns. Finally, the comparison/verification of the results obtained in the other stages.
The results of the assessment performance in this dissertation lead us to the conclusion that, an analogous forecasting to make predictions for investments is not the perfect forecasting methodology. Meanwhile the dissimilarity between the invested amounts in each funding round could be very different, for Unbabel and Uniplaces the adjusting step proved it and in order to maintain the robustness of results we needed to exclude them. Furthermore, the results of the methodology application lead to the conclusion that the next startup achieve the billion-dollar mark is Zaask. It is predicted that Zaask achieve a value closer to $1125 million on the next six momentums.
One of the main difficulties in the course of this dissertation was to collect the valuation values of the companies, i.e., the valuations of every unicorn and the startups in each round, which forced us to make an alternative methodology, causing eventually distortions on the results. Since we did not use the right and effective variable that define a Unicorn, the valuation. The second constraint is related to the contrast between the methodology chosen and the application, since it is very different to calculate similarities between sales and likenesses among investments. Besides this is, as far as we know the first study regarding Portuguese Unicorns and the prediction of Unicorns, we found no better means of comparing our results with previous studies.
In terms of future research, a lot of themes could be studied around the Big theme “The Unicorns”, since it is an actual theme and could be interesting to study it. To be more specific, efforts should be made to study the prediction of unicorns, other mechanisms ought to be developed, because an informed investor has always a competitive advantage. As well, efforts must be made to study the funding rounds with more details since it is a big influence to transform a startup into a Unicorn. Also, we believe that, in the future, the Unicorn Bubble is a theme that need to be considered, since some news report that this bubble will burst soon.
References
About OutSystems - Facts and Figures. https://www.outsystems.com/company/ [Accessed 21 Feb. 2019].
About. https://www.codacy.com/about [Accessed 12 Apr. 2019].
Atomico. 2018. The State of European Tech
https://2018.stateofeuropeantech.com/chapter/state-european-tech-2018/ [Accessed 28 May 2019].
Bartlett, R. 2015. A Founder's Guide to Unicorn Creation: How Liquidation
Preferences in M&A Transactions Affect Start-Up Valuation. California: University of
California, Berkeley - School of Law;
Bender, R., & Ward, K. 2014. Corporate Financial Strategy (4th ed.), London: Routledge
Brown, K. C., & Wiles, K. W., 2015. In Search of Unicorns: Private IPOs and the Changing Markets for Private Equity Investments and Corporate Control. Journal of
Applied Corporate Finance, 27(3): 34-38.
Cieślak, M. 2000. Prognozowanie gospodarcze. Metody i zastosowania. Wydawnictwo Naukowe PWN, Warszawa.
Cieślak, M., & Jasiński, R., 1979. Miara podobieństwa funkcji. Przegląd Statystyczny, z. 3/4.
Correia, A. 2016. O segredo da Uniplaces? “Queremos ser o Cristiano Ronaldo e não apenas o melhor jogador do Benfica”. Jornal visao. http://visao.sapo.pt/web- summit/2016-11-07-O-segredo-da-Uniplaces--Queremos-ser-o-Cristiano-Ronaldo-e-nao-apenas-o-melhor-jogador-do-Benfica [Accessed 28 May 2019].
De Massis, A., Frattini, F., & Quillico, F. (2016). What Big Companies Can Learn from the Success of the Unicorns. Harvard Business Review.
Dittmann, P., 2002. Metody prognozowania sprzedaży w przedsiębiorstwie. Wydawnictwo Akademii Ekonomicznej im. Oskara Lanego, Wrocław.
Economies of Scale. https://www.investopedia.com/terms/e/economiesofscale.asp [Accessed 13 May 2019].
Erdogam, B, Kant, R., Miller, A. & Sprague, K. 2016, Grow Fast or Die Slow: why unicorns are staying private, McKinsey Quarterly.
Fan, J. 2016. Regulating unicorns: disclosure and the new private economy. BCL Rev,
57(2): 583.
Farfetch Portugal - Designer Luxury Fashion for Men & Women. https://www.farfetch.com/pt/ [Accessed 9 Feb. 2019].