An Updated Portrait of the Portuguese Web
Jo˜ao Miranda and Daniel Gomes
Foundation for National Scientific Computing, 1708-001 Lisboa, Portugal,
{joao.miranda, daniel.gomes}@fccn.pt, WWW home page:http://arquivo.pt
Abstract. This study presents an updated characterization of the Por-tuguese Web derived from a crawl of 48 million contents belonging to all media types (2.5 TB of data), performed in March, 2008. The result-ing data was analyzed to characterize contents, sites and domains. This study was performed within the scope of the Portuguese Web Archive.
1
Introduction
The Web is an important component of the modern world and a massive source of information. Web characterization is important because it helps studying and describing its evolution, but it is a challenging task due to the large amount of contents involved.
The results presented in this study are derived from a crawl performed within the scope of the Portuguese Web Archive (PWA), a project of the Foundation for National Scientific Computing (FCCN) that aims to preserve the information published on the Portuguese Web [8]. One of the objectives of the PWA is to monitor the evolution of the Portuguese Web and periodically publish studies characterizing it. The main contribution of this study is an updated character-ization of the Portuguese Web, presenting measurements for metrics that were not previously studied and that can be used as baseline for future trend analysis. This paper is organized as follows. Section 2 presents related work and Sec-tion 3 presents the methodology adopted to conduct the experiment. SecSec-tion 4, 5 and 6 characterize contents, sites and domains, respectively. Section 7 draws the main conclusions and proposes future work.
2
Related work
Status % Description Code codes
200 85.2% Success - OK 302 7.2% Redirection - Found 404 5.1% Client Error - Not Found 301 1.3% Redirection - Moved Permanently 303 0.4% Redirection - See Other 403 0.2% Client Error - Forbidden 500 0.2% Server Error - Internal Server Error 400 0.2% Client Error - Bad Request 401 0.2% Client Error - Unauthorized 503 0.1% Server Error - Service Unavailable Other 0.0% Other codes
Table 1.The 10 most common response codes.
Previous studies contributed to characterize the Portuguese Web. Nicolau et al. defined a set of metrics to characterize the Web within the national sci-entific community network [18]. Noronha et al. performed a crawl of selected online publications and characterized the obtained collection [19]. Gomes et al. produced two previous characterizations of the Portuguese Web. One derived from a crawl of 3.2 million textual contents performed in 2003 [10]. The other, presented the most prevalent media types on the Portuguese Web, based on a crawl performed in 2005 [7].
3
Methodology
The following terminology was adopted in this study. A crawler is a program that iteratively downloads contents and extracts links to find new ones. Aseed is a URL used in the set of initial addresses to bootstrap a new crawl. A site is identified by a fully qualified domain name. For instance, www.fccn.pt and
arquivo-web.fccn.ptare two different sites. Acontent is a file resulting from a successful HTTP download (200 response code). The presented amounts of data correspond to decimal multiples. For instance, 1 KB corresponds to 103 bytes.
The Web characterization results presented in this study were extracted from a crawl of the Portuguese Web, containing information belonging to all media types, performed by the PWA between March and May, 2008, using the Her-itrix 1.12.1 crawler [17]. It started from a set of 180 000 seeds under the .PT domain, generated from a previous crawl. Table 1 presents the 10 most logged response codes, excluding error codes logged by the crawler. The total number of logged responses was 57 148 455. Some constraints were imposed to prevent the crawler against hazardous situations that could degrade its performance and bias results, such as spider traps, that are sites that generate an infinite number of addresses [11].
of hops is the number of links followed in a breadth-first fashion by the crawler from the seed until it reaches the content. The maximum logical depth imposed was 5. The physical URL depth measures the number of slashes contained within a URL. For instance, the URLwww.a.com/b/c.html presents a physical depth value of 2. The maximum physical URL depth imposed was 10. The exclusion rules can be provided through a file named robots.txt or a meta-tag ROBOTS embedded on a page [12]. The crawler respected the rules provided through both methods. Additionally, a courtesy pause of 2 seconds between requests to the same site was respected to avoid overloading Web servers with consecutive requests.
The boundaries of a national Web are difficult to define accurately [7]. How-ever, country code top-level domains are a good hint that a site belongs to a national Web. It was assumed that a content belongs to the Portuguese Web if it met at least one of the following conditions:
1. Its site domain name was hosted under .PT;
2. It was hosted outside the .PT domain but it was embedded on a page hosted under the .PT domain. For instance, if a page under .PT required an image under .FR to be presented completely and maintain its original layout, that image was also crawled and considered to be part of the Portuguese Web; 3. It was hosted outside the .PT domain but it was redirected from a .PT
domain site. This situation is frequent with sites of international companies that register their domain under .PT but redirect to a main site under other top-level domain.
4
Contents
During the crawl, 63 272 939 requests were processed. The number of contents downloaded was 48 718 404 in a total amount of data of 2.5 TB. The number of contents excluded due to Robots exclusion rules was 9.4% of the requests processed.
4.1 URL length and physical depth
0% 10% 20% 30% 40% [0-2 0[ [2 0-40[ [4 0-60[ [6 0-80[ [8 0-100[ [100 -120 [ [120 -140 [ [140 -160 [ [160 -180 [ [180 -200 [ 200 URL length Pe rc e n ta g e o f U R L s
Fig. 1. URL length distribution (avg: 74.5, median: 63).
0% 10% 20% 30% 40%
1 2 3 4 5 6 7 8 9 10
URL depth P e rc e n ta g e o f U R L s
Fig. 2. URL physical depth (avg: 2.5, median: 2). 0% 10% 20% 30% [0-1 [ [1-2 [ [2-4 [ [4-8 [ [8-1 6[ [1 6-32[ [3 2-64[ [6 4-128[ [128 -256 [ [256 -512 [ [512 -102 4[ [102 4-20 48[ [204 8-10 000]
Size of Contents [KB]
P e rc e n ta g e o f Co n te n ts
Fig. 3. Content size distribution in KB (avg: 50.4, median: 13.6).
Media type Avg size
1 text/html 31 KB
2 app’on/pdf 483 KB
3 image/jpeg 36 KB
4 text/plain 212 KB 5 app’n/zip 1 540 KB 6 app’n/x-gzip 844 KB 7 audio/mpeg 2 576 KB 8 app’n/octet-stream 996 KB 9 app’n/x-shockwave-flash 144 KB
10 image/gif 9 KB
Table 2.Average size of the media types that contributed with the larger amount of data.
with static contents, a content located deep in the site is often less relevant than one at the top [4]. Plus, deep URLs depths are associated with increased link failures [14, 5]. Figure 2 presents the URL physical depth distribution and shows that 94.4% of the URLs have a depth between 1 and 5, and only 5.6% have a depth between 6 and 10. The obtained results suggest that Web publishers are not organizing contents on their sites following a tree directory hierarchy, because the large majority of the contents are found at shallow levels of depth. Thus, relevance heuristics based on URL depth may be compromised by this fact.
4.2 Media types and sizes
Media type % contents
1 text/html 57.8%
2 image/jpeg 22.8%
3 image/gif 9.4%
4 text/xml 1.9%
5 app’n/pdf 1.9%
6 image/png 1.3%
7 text/plain 1.0%
8 app’n/x-shockwave-flash 0.7%
9 text/css 0.7%
10 app’n/x-javascript 0.5%
- Other 2.0%
Table 3. Top 10 media types measured by number of downloaded contents.
Media type % total amount
1 text/html 35.4%
2 app’on/pdf 17.9%
3 image/jpeg 16.1%
4 text/plain 4.2%
5 app’n/zip 3.0%
6 app’n/x-gzip 2.7%
7 audio/mpeg 2.7%
8 app’n/octet-stream 2.4% 9 app’n/x-shockwave-flash 2.1%
10 image/gif 1.6%
- Other 11.9%
Table 4. Top 10 media types measured by amount of data.
There are hundreds of formats for digital contents and they all can be po-tentially published on the Web. However, only some formats are commonly used due to their characteristics, such as size or portability. It is interesting to follow which are currently the most prevalent media types, for instance, to select soft-ware format interpreters to include in mobile phone browsers that have limited capacities in comparison to desktop computers. Table 3 and Table 4 present the most prevalent media types regarding the number of contents and the total amount of data, respectively. The text/html type was the most common, with 57.8% of the contents and 35.4% of the total amount of data downloaded. A comparison between Table 3 and Table 4 shows that 6 media types exist in both. However, their relative presence varies. For instance, the application/pdf type occupies the 2nd
position in Table 4 with 17.9% of the total amount of data downloaded but the 5th
position in Table 3 with 1.9% of the number of downloaded contents.
4.3 Dynamically generated contents
Type % dynamic % total extensions contents PHP: Hypertext Preprocessor (.php) 66.2% 22.4%
Active Server Pages (.asp) 29.6% 10.0% JavaServer Pages (.jsp) 2.6% 0.9%
ColdFusion (.cfm) 0.9% 0.3% Common Gateway Interface (.cgi) 0.7% 0.2% Table 5.Contents with known dynamic extensions.
sent through the HTTP POST method. Thus, the obtained results should be interpreted as the minimum percentage of dynamically generated contents on the Web.
The obtained results showed that 44.4% of the contents contained embedded parameters. Table 5 presents the results obtained through extension analysis. The 2nd
column refers to the percentage of contents per extension regarding the total number of dynamically generated contents. The 3rd
refers to the per-centage of contents of each extension regarding the total number of contents downloaded. The total number of contents with known dynamic extensions was 33.8%. The PHP: Hypertext Preprocessor technology was the most prevalent presenting 66.2% of the dynamic contents. The total percentage of dynamically generated contents identified through both methods was 46.3%.
4.4 Duplication
Despite the hypertextual capacities of the Web to reference and reuse contents without performing physical duplication, the contents available on the Web are not unique. Duplicates occur when the same content is referenced by several distinct URLs. For instance, when contents are repeated in different directories of a site, physically duplicated across sites, or as it happens, for instance, with mirror sites.
During the crawl, a SHA1 digest was generated for each content and recorded in the crawl log. This digest was used to measure content duplication. Measuring duplication is useful to help choosing adequate storage systems according to their duplicates elimination features [9]. Approximately 48.7 million downloaded contents were crawled for 40 million different digests, which means that 17.7% of the downloaded contents were referenced by several distinct URLs, representing 15.2% of the total amount of data downloaded. Regarding the number of digests occurrences, the obtained results show that most contents are unique (92.8%) and that most duplicated contents occur just twice (5.1%).
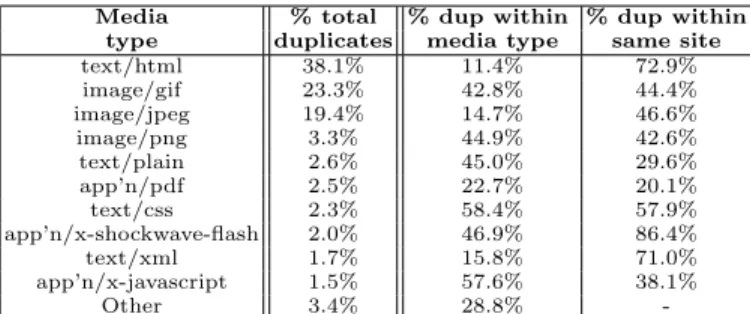
Table 6 presents duplication distribution across media types. The 2nd
column presents the prevalence of each media type within the total set of duplicates. The 3rd
column presents the prevalence of duplicates within each media type. The 4th
Media % total % dup within % dup within type duplicates media type same site
text/html 38.1% 11.4% 72.9%
image/gif 23.3% 42.8% 44.4%
image/jpeg 19.4% 14.7% 46.6%
image/png 3.3% 44.9% 42.6%
text/plain 2.6% 45.0% 29.6%
app’n/pdf 2.5% 22.7% 20.1%
text/css 2.3% 58.4% 57.9%
app’n/x-shockwave-flash 2.0% 46.9% 86.4%
text/xml 1.7% 15.8% 71.0%
app’n/x-javascript 1.5% 57.6% 38.1%
Other 3.4% 28.8%
-Table 6.Distribution of media type prevalence regarding the total set of duplicates, the percentage of duplicates within each media type and the percentage of duplicates from each media type within the same site.
duplicates detection mechanisms according to the media type of the contents. Duplication per media type is useful to define strategies for identifying duplicates within a web data repository or proxy because it allows to identify the media types with higher probability of being duplicated or that generate higher volume of duplicated information.
The obtained results show that the media types that contributed with the larger number of duplicates are also the most common on the Web. However, there is not a direct relation between the prevalence percentages for duplicates and contents. For instance, GIF images are a stronger responsible for the amount of duplicates on the Web than other media types because they represent 23.3% of the duplicates but only 9.4% of the contents available on the Web. Empiri-cally, this result was not surprising because image icons are commonly copied across sites. On the other hand, HTML contents are less prone to be duplicated because only a small edition on their text or layout originates a new digest. The obtained results also showed thattext/css andapplication/x-javascript pre-sented the highest levels of duplication with 58.4% and 57.6%, respectively. We found these results surprising, so we randomly analyzed 20 text/css files and noticed that only 2 of them were unique within the crawl and 16 were repeated within the same site or on its subdomains. According to Web design best prac-tices [13], the creation of independent files containing CSS or JavaScript code that are shared by different pages enables code reuse which facilitates main-tenance tasks, reduces pages size and enables browsers to keep files locally on cache, without having to download them to render each page. However, the ob-tained results show that CSS and JavaScript contents are commonly duplicated instead of being reused, presenting 57.9% and 38.1% of duplicates within the same site, which inhibits the presented advantages.
0% 10% 20% 30% 40% [0-1 KB [
[1 K
B-1
0 K
B[ [10 KB -100 KB [ [100 KB
-1 M
B[
[1 M
B-1
0 M
B[
10 M
B
Size of sites
P e rc e n ta g e o f s it e s
Fig. 4. Distribution of the total amount of data downloaded per site (avg: 6.8 MB, median: 71 KB).
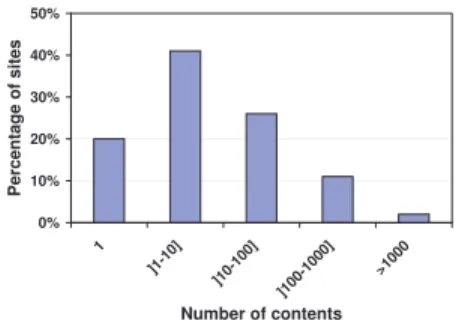
0% 10% 20% 30% 40% 50% 1 ]1-1 0] ]1 0-100] ]100 -100 0] >100 0
Number of contents
P e rc e n ta g e o f s it e s
Fig. 5. Distribution of the number of contents downloaded per site (avg: 134.9, median: 5).
5
Sites
A site was considered as being valid if it returned a 200 response code to at least one request. The total number of sites visited was 484 398 and 74.6% of them were valid. In the crawl, 125 393 sites had the filerobots.txt, 34.7% of the total number of sites that returned a 200 response code to at least one request.
5.1 Site size
The number of contents per site influences the crawler’s data partitioning of its queues of URLs to visit [6]. Figure 4 presents the distribution of the total amount of data downloaded per site and shows that 85% of the sites provided between 1 KB and 10 MB of data. We analyzed the top 10 sites that served the largest amount of data and they were data repositories, such as FTP sites, video or Podcast archives.
Figure 5 presents the distribution of contents crawled per site. The obtained results show that sites are typically small, 87% presented less than 100 contents. Only 2% of the total sites contained more than 1 000 contents. Two relatively large sites were found, one with 280 609 contents and another with 557 978 contents. They belonged to two blog platforms.
5.2 Successful responses
The percentage of successful responses returned by a site is an indicator of its quality. A site that presents a large percentage of broken links or errors mines the trust of its users.
0% 10% 20% 30% 40% 50%
]0%
-20%
[
[20%
-40%
[
[40%
-60%
[
[60%
-80%
[
[80%
-100
%[
100%
Succesful request percentage
P
e
rc
e
n
ta
g
e
o
f
s
it
e
s
OK
Successful and Redirection
Fig. 6.Percentage of sites per successful request percentage. The left series regards the OK responses and the right series regards the Successful and Redirection responses.
increase might be due to the existence of sites containing just one URL which is a redirect. For instance, to redirect an old site domain to a new one. Notice, that these single-URL sites present 100% successful responses. The obtained results show that if these sites were excluded, the percentage of sites presenting 100% successful responses would drop from 39% to 30.8%.
One may think that larger sites would be harder to maintain and should present a higher rate of broken links. However, the correlation factor between site size and OK responses was 0.06 and 0.04 for Successful and Redirection responses. This shows that there is no relation between site size and successful response percentage.
5.3 Sites hosted per IP address
Virtual hosts enable a single Web server to host several sites. We assumed that each server is identified by an IP address.
The Heritrix crawler logs do not include the IP address of the visited sites. Therefore, we made a post-crawl resolution of the site names after the crawl had finished. We were unable to resolve the name for 1.3% of the sites that were online during the crawl. Regarding the distribution of sites hosted per IP address, the obtained results show that 75% of the IP addresses host 1 site. Only 2% of the IP addresses host more than 10 sites. On average, each IP address hosts 4 sites (median of 1). We have found two IP addresses hosting over 30 000 sites each, both belonging to SAPO, a Portuguese Internet and Web Service Provider.
0% 10% 20% 30% 40% 50% 60% 70% 80% 90% .PT .CO M
.NET .US .BR Oth er Top-level domain P e rc e n ta g e o f to ta l Number of contents Amount of data Number of sites
Fig. 7.Number of contents, amount of data and sites per top-level domain.
0% 10% 20% 30% 40% 50% 60% 70% 80% 90% .SA PO.P T .CO M.P T .RC TS.P T .UP. PT .COM .BR Othe r Second-level domain Pe rc e nt a ge of t ot a l Number of contents Amount of data Number of sites
Fig. 8.Number of contents, amount of data and sites per second-level domain.
6
Domains
Figure 7 presents the number of contents, amount of data and sites per top-level domain. The .PT domain was the most representative top-level domain, with 85.8% of the contents downloaded, 87% of the amount of data downloaded and 53.9% of the valid sites visited.
Figure 8 presents the number of contents, amount of data and sites per second-level domain. The .SAPO.PT domain is private but appears before .COM.PT which is open for public registration. A possible explanation for this fact is that SAPO is one of the largest communication companies in Portugal with a network that hosts several popular radio and newspaper sites. It is also an Internet Ser-vice Provider, hosting the personal Web pages from its users, has a blog platform and was the first Portuguese Web portal. Higher education institutions also play a significant role on the Portuguese Web, representing a total of 7.9% of the num-ber of contents and 12.6% of the total amount of data downloaded. These results were obtained through a list of domains of higher education institutions [3].
7
Conclusions and future work
responsible for most of the duplicates. However, some media types that present relatively small presence on the Web are very prone to be duplicated. An unex-pected result was that duplication is prevalent among CSS and JavaScript files, which are files that are supposed to be reused across pages.
Sites are typically small and the large majority of their contents are found at shallow levels of physical depth, which may compromise relevance heuristics based on URL depth. Half of the sites presented a successful response rate bellow 80%. Most IP addresses host a single site and only 2% host more than 10 sites. Although most sites are referenced by their own second-level domain, the obtained results show that a domain belonging to a private communication com-pany hosts an important share of the Portuguese Web under their sub-domains. 10% of the Portuguese Web contents were hosted under .COM because they were embeded or redirected from contents hosted under the .PT domain.
The crawl log used in this study is available athttp://arquivo.pt/resources
for research purposes. Future work will involve gathering statistics extracted from content analysis over different metrics: accessibility for people with disabil-ities, respect for format specifications and link structure analysis.
References
1. R. Baeza-Yates, C. Castillo, and E. Efthimiadis. Characterization of national web domains. ACM Transactions on Internet Technology, 7(2), 2007.
2. C. Castillo. Effective Web Crawling. PhD thesis, University of Chile, November 2004.
3. Direc¸c˜aoGeral do Ensino Superior (DirectorateGeneral for Higher Education) -Home Page. http://www.dges.mctes.pt/DGES.
4. R. Fagin, R. Kumar, K. Mccurley, J. Novak, D. Sivakumar, J. Tomlin, and D. Williamson. Searching the workplace web, 2003.
5. D. H.-L. Goh and P. K. Ng. Link decay in leading information science journals.J. Am. Soc. Inf. Sci. Technol., 58(1):15–24, 2007.
6. D. Gomes. Web Modelling for Web Warehouse Design. PhD thesis, University of Lisbon, March 2007.
7. D. Gomes, S. Freitas, and M. J. Silva. Design and selection criteria for a na-tional web archive. InECDL 2006 - 10th European Conference on Research and Advanced Technology for Digital Libraries, number 4172/2006 in LNCS, pages 196– 207. Springer-Verlag, September 2006.
8. D. Gomes, A. Nogueira, J. Miranda, and M. Costa. Introducing the Portuguese web archive initiative. In8th International Web Archiving Workshop (IWAW08), Aarhus, Denmark, September 2008.
9. D. Gomes, A. L. Santos, and M. J. Silva. Managing duplicates in a web archive. In L. M. Liebrock, editor, Proceedings of the 21th Annual ACM Symposium on Applied Computing (ACM-SAC-06), Dijon, France, April 2006.
10. D. Gomes and M. J. Silva. Characterizing a national community web. ACM Transactions on Internet Technology, 5(3):508–531, 2005.
11. A. Heydon and M. Najork. Mercator: A scalable, extensible web crawler. World Wide Web, 2(4):219–229, 1999.
13. S. Koyani, R. Bailey, and J. Nall. Research-Based Web Design & Usability Guide-lines. Department of Health and Human Services, 2006.
14. W. Kraaij, T. Westerveld, and D. Hiemstra. The importance of prior probabilities for entry page search. InProc. of the 25th International ACM SIGIR Conference on Research and Development in Information Retrieval, pages 27–34, 2002. 15. F. Lasfargues, C. Oury, and B. Wendland. Legal deposit of the French Web:
harvesting strategies for a national domain. In 8th International Web Archiving Workshop (IWAW08), Aarhus, Denmark, September 2008.
16. M. Modesto, ´Alvaro R. Pereira Jr., N. Ziviani, C. Castillo, and R. Baeza-Yales. Um novo retrato da web brasileira. InXXXII SEMISH - Anais do Semin´ario Integrado de Software e Hardware, pages 2005–2017, S˜ao Leopoldo, RS, July 2005.
17. G. Mohr, M. Kimpton, M. Stack, and I. Ranitovic. Introduction to heritrix, an archival quality web crawler. In 4th International Web Archiving Workshop (IWAW04), Bath, UK, September 2004.
18. M. J. Nicolau, J. Macedo, and A. Costa. Caracteriza¸c˜ao da informa¸c˜ao WWW na RCCN. Technical report, Universidade do Minho, 1997.
19. N. Noronha, J. P. Campos, D. Gomes, M. J. Silva, and J. Borbinha. A deposit for digital collections. In P. Constantopoulos and I. T. Sølvberg, editors,Proceedings of the 5th European Conference on Research and Advanced Technology for Digital Libraries, ECDL, volume 2163 ofLNCS, pages 200–212. Springer, 2001.
20. E. A. Veloso, E. de Moura, P. Golgher, A. da Silva, R. Almeida, A. Laender, B. Ribeiro-Neto, and N. Ziviani. Um retrato da web brasileira. In Simp´osio Brasileiro de Computa¸c˜ao, Curitiba, Brasil, July 2000.