1
REPHASING OF THE
INTERSECTION OF CITY HALL
OF LEIRIA
A. Bîtcă Civil Engineering ESTG/IPL Leiria, Portugal ABSTRACTThis project proposes two possible solutions for the phasing plan of the intersection near the City Hall of Leiria and presents the calculations of the cycle length and the intersection delay for both of them. The main goal of these solutions is to optimize the global functioning of the intersection. Since the number of cars that use an intersection is will fluctuate with time, when using pre-timed traffic lights, adjustments are needed to the settings of the traffic signals, to assure the accommodation of the present traffic flows in the intersection under acceptable conditions for drivers.
KEYWORDS: Traffic signals, phasing plan, cycle length, intersection delay, level of service, capacity
2 TABLE OF CONTENTS
1. INTRODUCTION ... 5
2. STATE OF THE ART ... 6
2.1 Intersection types ... 6
2.2 Geometric design of traffic light controlled intersections ... 10
2.2.1 Intersection sight distance ... 10
2.2.2 Horizontal alignment ... 12
2.2.3 Vertical alignment ... 13
2.2.4 Angle of intersection ... 14
2.2.5 Turning radius ... 16
2.3 Signal timing methodologies ... 18
2.3.1 Controller type ... 20 2.3.2 Phasing plan ... 22 2.3.3 Signal timing ... 25 2.3.4 Left-turn treatments ... 28 2.3.5 Right-turn treatments... 31 2.3.6 Pedestrians... 34
3. PRESENT CONDITIONS AT THE STUDY’S INTERSECTION ... 36
4. SIGNAL TIMING USING THE WEBSTER METHOD ... 45
4.1 Phasing plan ... 45
4.2 Signal timing ... 48
4.2.1 First phasing plan ... 48
4.2.2 Second phasing plan ... 53
4.3 Intersection delay ... 59
4.3.1 Intersection delay for the first phasing plan ... 59
4.3.2 Intersection delay for the second phasing plan ... 61
5. SIGNAL TIMING USING THE HIGHWAY CAPACITY MANUAL method ... 62
5.1 Signal timing ... 62
5.1.1 Signal timing for the first phasing plan ... 62
5.1.2 Signal timing for the second phasing plan ... 66
5.2 Intersection delay ... 68
5.2.1 Intersection delay for the first phasing plan ... 68
5.2.2 Intersection delay for the second phasing plan ... 70
6. COMPARISON BETWEEN THE TWO METHODS ... 71
7. CONCLUSIONS... 75
8. ACKNOWLEDGMENTS ... 76
3 LIST OF TABLES
Table 1 – Turning Radius Effects ... 17
Table 2 – Appropriateness of traffic signals ... 19
Table 3 – Phase plans for pre-timed and traffic actuated control ... 23
Table 4 – Pedestrian walk interval duration ... 34
Table 5 – Pedestrian clearance time ... 34
Table 6 – Walking speed for senior pedestrians ... 35
Table 7 – Traffic volume in the intersection ... 37
Table 8 – Vehicle hourly volumes for each movement in the intersection ... 39
Table 9 – Green times for the actual phasing plan ... 40
Table 10 – LOS criteria for signalized intersections ... 44
Table 11 – Control delay and level of service ... 44
Table 12 – Volume adjustment for turning vehicles ... 49
Table 13 – Average lane volumes ... 50
Table 14 – Green time for the critical phases ... 51
Table 15 – Green time for the non-critical phases ... 53
Table 16 – Final phase timings for the first phasing plan ... 53
Table 17 – Volume adjustment for turning vehicles ... 55
Table 18 – Average lane volumes ... 56
Table 19 – Green time for the critical phases ... 57
Table 20 – Green time for the non-critical phases ... 58
Table 21 – Final phase timings for the second phasing plan ... 58
Table 22 – Control delay and level of service for the first phasing plan ... 59
Table 23 – Control delay and level of service for the second phasing plan ... 61
Table 24 – Green time for the critical phases ... 63
Table 25 – Green time for the non-critical phases ... 64
Table 26 – Final phase timing for the first phasing plan ... 64
Table 27 – Green time for the critical phases ... 66
Table 28 – Green time for the non-critical phases ... 67
Table 29 – Final phase timings for the second phasing plan ... 67
Table 30 – Control delay and level of service for the first phasing plan ... 68
Table 31 – Control delay and level of service for the second phasing plan ... 70
Table 32 – Phasing timings for the first phasing plan ... 71
Table 33 – Phasing timings for the seconds phasing plan ... 72
4 LIST OF FIGURES
Figure 1 – Simple intersection ... 7
Figure 2 – Flared intersection ... 7
Figure 3 – Channelized intersection ... 8
Figure 4 – Roundabout ... 8
Figure 5 – Three-leg intersection ... 9
Figure 6 – Multi-leg intersection ... 9
Figure 7 – Realigning multi-leg intersections ... 12
Figure 8 – Coordination of vertical alignment on horizontal tangent ... 14
Figure 9 – Example of Angle of Intersection ... 15
Figure 10 –Realignment options at intersections ... 15
Figure 11 – Turning radius... 16
Figure 12 – Max out – reach of maximum green time ... 21
Figure 13 – Gap out – no vehicles detected ... 21
Figure 14 – Dual-ring concurrent phasing scheme with assigned movements ... 24
Figure 15 – Webster’s Optimum Cycle Length ... 26
Figure 16 – HCM Cycle Length Estimation ... 28
Figure 17 – Leading left turn protection ... 29
Figure 18 – Lagging left turn protection ... 29
Figure 19 – Split phase operation... 30
Figure 20 – Left turn green arrow ... 31
Figure 21 – Diamond turn ... 32
Figure 22 – Diamond overlap phasing ... 33
Figure 23 – Split phasing ... 33
Figure 24 – Aerial view of the City Hall intersection ... 36
Figure 25 – Traffic movements and lane configuration ... 37
Figure 27 – Evening vehicular movements ... 39
Figure 28 – Design vehicular movements ... 40
Figure 29 – Present phasing plan ... 41
Figure 30 – First phasing plan ... 45
Figure 31 – Seconds phasing plan ... 46
Figure 32 – First phasing plan with the assigned movements ... 47
Figure 33 – Seconds phasing plan with the assigned movements ... 48
Figure 34 – Phasing plan 1 diagram ... 54
Figure 35 – Phasing plan 2 diagram ... 60
Figure 36 – Phasing plan 1 diagram ... 65
Figure 37 – Phasing plan 2 diagram ... 69
Figure 38 – Intersection capacity comparison... 73
5 1. INTRODUCTION
Despite many years of research on the optimization of intersections, the poor regulation of intersections is still a matter of huge frustration amongst many drivers today. The complexity of this problem makes the design and optimization of intersections a difficult problem to solve. Understanding the basic mechanisms that govern the optimal phasing regulation of intersections is therefore important in dealing with complex network problems, not least because external factors such as the behavior of drivers, can lead to results that defy intuition.
The rephasing or the optimization of the existing intersections becomes even more important when the intersection in discussion is controlled by pre-timed traffic signals. The number of cars that use an intersection can have fluctuations from changes in other parts of the road network and/or demand variations. Because of this, the settings of the traffic lights that provided a good intersection performance five or more years ago, most probably will not provide the same performance in the present conditions, so some adjustments to the settings of the traffic lights may be highly recommended.
In this context the main goal of this project is to optimize the traffic light phasing of the intersection near the City Council of Leiria adapting it to the current traffic demands.
A common way to measure an intersection’s performance is to calculate the intersection delay, and based on these results, the level of service of the intersection can also be calculated. The Webster and Transportation Research Board (Highway Capacity Manual) methods are commonly used in calculation of the cycle length and vehicle delays in a given intersection. In these methods the delay parameter includes uniform and random components. Both methods are used in this project. A comparison between the results of the two methods is also presented.
The project contains the following: chapter 2 presents the state of the art regarding intersection types, the geometric design of traffic light controlled intersections and the signal timing methodologies; chapter 3 describes the actual field conditions in the intersection of the City Hall such as: the phasing plan, the cycle length, the intersection delay and the level of service of the intersection; chapter 4 proposes two possible solutions for the phasing plan and presents the calculation of the cycle length using the Webster method and the calculation of the intersection delay; chapter 5 presents the calculation of the cycle length and of the intersection delay using the Highway Capacity Manual method; chapter 6 presents the comparison between the two methods used in the project; chapter 7 presents the conclusions and chapter 8 and 9 are used for acknowledgments and references.
6 2. STATE OF THE ART
2.1 Intersection types
An intersection is the location where two or more streets join or cross at-grade. The intersection includes the areas required for all modes of travel: pedestrian, bicycle, motor vehicle, and transit. Thus, the intersection includes not only the pavement area, but normally the adjacent sidewalks and pedestrian curb cut ramps. The intersection is defined as incorporating all alterations to the otherwise typical cross-sections of the intersecting streets [1].
American Association of State Highway and Transportation Officials describe intersection as the general area where two or more highways join or cross, comprising the roadway and roadside facilities for traffic movements within the area. Each highway radiating from an intersection and forming part of it is an intersection leg. The most common intersection has four legs; this is the case when two highways cross one another. Even if in practice we have intersections with five or more legs, it is not recommended that an intersection has more than four legs [2].
Intersections are an important feature of street design namely in four aspects:
Focus of activity – the land near intersections often comprises a concentration of travel destinations;
Conflicting movements – pedestrian crossings and motor vehicle and bicycle turning and crossing movements are normally concentrated at intersections;
Traffic control – at intersections, movement of users is assigned by traffic control devices such as yield signs, stop signs, and traffic lights. Traffic control regularly results in delay to users travelling along the intersecting roadways, but helps to organize traffic and reduce the potential for conflict;
Capacity – in many cases, traffic control at intersections limits the capacity of the intersecting roadways, defined as the number of users that can be accommodated within a given time period [1]. Different sources have different ways to categorize intersections. For example, according to the Connecticut Department of Transportation, intersections can be categorized into four major types: Simple intersections – maintain the street’s typical cross-section and number of lanes throughout the intersection, on both the major and minor streets. Simple intersections (Figure 1) are best suited to locations where auxiliary lanes are not needed to achieve the desired level-of-service, or are infeasible due to nearby limitations;
7 Figure 1 – Simple intersection [1]
Flared intersections (Figure 2) – expand the cross-section of the street. The flaring is often done to accommodate a left-turn lane, so that left-turning bicycles and motor vehicles are removed from the though-traffic stream to increase capacity at high-volume locations, and safety on higher speed streets;
Channelized intersections (Figure 3) – use pavement markings or raised islands to designate the intended vehicle paths. The most frequent use is for right turns, particularly when accompanied by an auxiliary right‐turn lane;
8 Figure 3 – Channelized intersection [1]
Roundabouts (Figure 4) – the roundabout is a channelized intersection with one‐way traffic flow circulating around a central island. All traffic-through as well as turning-enters this one‐way flow. Although generally circular in shape, the central island of a roundabout may have an irregular shape [1].
Florida Intersection Design Guide states that intersection types can be categorized by intersection basic type, control type, area type, or a combination of these classifiers, depending on the element of design [3].
Figure 4 – Roundabout [1]
Basic type of intersection classifies them by the number of legs that are part of the intersection: 3 leg intersection (Y or T layout, presented in Figure 5);
9 multi-leg intersection (Figure 6);
circular intersection or roundabouts (Figure 4) [3, 5].
Figure 5 – Three-leg intersection [4]
Figure 6 – Multi-leg intersection [4]
When designing an intersection, the intersection type is the first thing to be established and then an appropriate geometric plan is to be developed, reflecting suitable design and operational criteria that take into account the physical constraints [3].
By control type, the intersections are divided into: uncontrolled;
controlled by stop signs; controlled by yield signs; controlled by traffic signals; roundabouts [3].
The intersection control type has a direct effect on several aspects of the geometric design. This includes lane assignments, sights distance and storage length of auxiliary lanes [3].
10 In terms of area type can be typically defined as urban, suburban, or rural. Each of these area types
has fundamentally different characteristics with regard to development and types of land use, density of street and highway network, nature of travel patterns and ways in which these elements are related. Therefore, the intersection design considerations and requirements for each of these areas are different [3].
Any of the basic intersection types can greatly vary in scope, shape and degree of channelization. Where motor vehicle conflicts with pedestrians or bicyclists are expected, provisions for pedestrians and bicycle movements should be considered in the design [2].
2.2 Geometric design of traffic light controlled intersections
Intersections are an important element of the highway and street system. Generally, they have a much higher accident rate and will cause much more delay than the midblock sectors of the system. Also, the intersections are a quite expensive part of the system, so it is very important that they are designed adequately [6].
At traffic light controlled intersections, besides the geometric design, the additional element of time allocation is introduced. A traffic signal allocates green time for conflicting movements that try to use the same space. The way the green time is allocated significantly affects the functionality and the capacity of the intersection and its approaches [7].
The main geometrical aspects of the intersection design are: intersection sight distance;
horizontal alignment; vertical alignment; angle of intersection; turning radius.
Each of these aspects affects the intersection performance differently, but at the same time they are all important aspects that should not be neglected when designing the intersection. The next subchapters are dedicated for explaining each of them.
2.2.1 Intersection sight distance
Generally speaking, the intersection sight distance (ISD) refers to the corner sight distance available that allows a driver approaching the intersection to see the actions or movements of vehicles on the crossing legs. Intersection sight distance evaluations involve the establishment of the needed sight triangles for each quadrant by determining the legs of the triangles on the two intersecting roads [8]. The provision of adequate ISD greatly reduces the potential for crashes at intersections. The car driver approaching an intersection should be given an unobstructed perspective of the entire intersection and also adequate view of the intersecting street to allow better control of the car to avoid accidents [5].
11 When designing an intersection, the following factors should be considered:
adequate sight distance should be provided along both highway approaches to permit drivers and other road users to anticipate and avoid potential collisions;
combination of vertical and horizontal curvature should allow acceptable sight distance of the intersection;
traffic lanes should be clearly visible at all times;
lane and crosswalk markings and signs should be clearly visible and understandable from a desired distance [5].
Intersection designers should ensure that approaching drivers can see all applicable traffic control devices and conflicting traffic early enough to take appropriate actions. Sight may be blocked by the alignment of the road the driver is on, the alignment of the intersecting road, objects or terrain in the ‘‘sight triangle’’ near the corner, or objects or terrain in the median. Given the alignments and roadside obstacles, the designer needs to compute the intersection sight distance provided and compare that to the minimum sight distance recommended [6].
The sight distance needed at intersections varies depending on the type of intersection control. In case of intersections with traffic signal control, there is no need for sight triangles, although the following sight conditions should be considered:
the first vehicle at one approach should be observable to the first vehicles on all the other approaches;
left-turning vehicles should have sufficient sight distance to select gaps in approaching traffic and complete left turns [5].
Stop line plays an important role when considering the intersection sight distance and therefore should be located appropriately, to improve the performance of the intersection.
Stop lines at intersections should be located:
so as to minimize inter-green times and clearance times;
no less than 3 m from conflicting vehicle movements (or 4.4 m if a future pedestrian crosswalk is anticipated);
adjacent to or not more than 3 m in advance of a primary signal post; clear of the swept path of vehicles turning from other approaches; 1 m minimum from parallel pedestrian crosswalks at intersections; 6 m from signalized mid-block crossings;
at a minimum of 6 m in advance of the secondary or tertiary signal face for that approach; and at an angle of between 70 and 110 degrees to the direction of travel [9].
The stop line location is heavily influenced by the location of the crosswalks. A stop line that is not properly located invites violation by the driver [3].
If no crosswalk, either marked or unmarked, is provided on a given approach, the stop line should be located at the point where vehicles are expected to stop, typically 1.2 m from where a crosswalk
12 would be located if it were present. This point could also be influenced by left turning traffic
approaching from the right. There is sometimes a tendency for the motorist to stop too close to the intersection, thereby obstructing the turning paths of left-turning vehicles. Proper location of the stop line may help to correct this problem [3].
2.2.2 Horizontal alignment
Intersections on severe horizontal curves should be avoided. Super-elevation and the wide pavement needed for such curves create difficulties in the intersection design process and may affect the sight distance [5].
Intersections with five or more intersection legs (multi-leg) should generally be avoided wherever possible. At locations where multi-leg intersections are used, it may be reasonable to have all intersection legs intersect at a common paved area, where volumes are light and stop control is used. At major intersections, traffic operational efficiency can often be enhanced by reconfigurations that remove some conflicting movements from the major intersection [5]. Such reconfigurations are accomplished by realigning one or more of the intersections, as shown in Figure 7.
Figure 7 – Realigning multi-leg intersections [5]
Figure 7A represents the simplest application of this principle on an intersection with five approach legs. The diagonal leg is realigned to join the upper road at satisfactory distance from the main intersection to form two distinct intersections, each of which can be operated simply. The left-to-right highway is expected to be the more important route, and for this reason the diagonal leg is realigned to locate the new intersection on the less important road [5].
Figure 7B shows an intersection with six approach legs, two of which are realigned in adjacent quadrants to form a simple four-leg intersection at an appropriate distance to the right of the main intersection, which is itself changed to a simple four-leg intersection. This pattern applies where the top-to-bottom highway at the left is the more important route. If the left-to-right highway is more important, it may be better to realign the diagonal legs toward the other highway and thereby create three separate intersections along the minor highway. The intersection configurations in Figure7 are shown in their simplest form. Turning lanes and divisional islands may be used, as appropriate, to fit the particular situation [5].
13 2.2.3 Vertical alignment
The horizontal and vertical alignment should always be designed together, especially in projects for new alignments. Their importance requires the designer to carefully evaluate the connections between the two highway design features. This will lead to enhanced safety and performance of the facility [8].
Sharp grades hamper traffic operations at intersections. Sharp downgrades on an intersection approach increase stopping distances and make turning more difficult. Sharp upgrades on an intersection approach make idling difficult for vehicles with manual transmissions and make acceleration slower for all vehicles, which in turn increases necessary gap sizes and sight distances for crossing and turning movements. Generally, grades under 2 percent do not cause many operational problems, grades from 2 to 4 percent begin to introduce noticeable problems, and grades over 4 percent should be avoided where practical [6].
Large grade changes must be avoided at intersections, but the practice shows that this is not always possible. Providing sight distance for all the approaches is the main concern. The sections of the road used for parking, known as storage platforms, should have a grade as flat as possible. In the case where pedestrians are expected, the intersections should be “tabled” as much as possible to provide a cross slope in crosswalks less than 2 percent [5].
The alignment and grades near an intersection are subject to more limitations than on the open road. At or near intersections, the combination of horizontal and vertical alignment have to provide traffic lanes that are clearly visible to drivers at all times, clearly understandable for any desired direction of travel, free from the potential for conflicts to appear suddenly, and consistent in design with the portions of the highway just traveled [2].
In the case when the intersecting gradients are equal or less than 3 percent, the stopping and acceleration distance don’t differ very much from those for level grades. However, when the grades are bigger than 3 percent, it may be needed to change several design elements because of the effects of the grades on car’s performance. It is a complex task to design the intersection of two streets that are on substantial grades. Because of this, grades of 3 or more percent are to be avoided at intersections. When this is not possible to achieve in practice, grades up to 6 percent may be used, but adjustments in the geometric design should be made to a good design [5].
The vertical profiles of the main and minor street should be coordinated to provide acceptable ride quality for drivers [10]. A simple solution is to match the minor street’s vertical profile to the main street vertical profile (Figure 8A). This solution is acceptable in situations where the roadways are relatively flat. A substantial transition length is generally needed when significant grades are involved because of the length of the vertical curves required to meet design speed requirements [5]. The profile grade-lines and cross sections on the legs of an intersection should not only be adjusted in the intersection itself, but also for a distance back from the intersection, to be able to provide a smooth connection and proper drainage. Generally, the grade-lines of the major road should be carried through the intersection and that of the minor road should be adjusted to it. This design solution includes a transition in the crown of the minor street to an inclined cross section at its connection with the major street [5].
14 Figure 8B shows an example of coordinating the cross section of the main street and the vertical
alignment on the minor street to obtain a better design. By changing the crown on the main road, the passage across it is much smoother. Because the resulting grade changes will be reduced and result in shorter vertical curves, this alignment will require less distance to meet design speed than that shown in Figure 8A while meeting design speed requirements. However the design will require that an adequate transition length on the major roadway be provided [5].
Figure 8 – Coordination of vertical alignment on horizontal tangent [10]
2.2.4 Angle of intersection
The angle of intersection is important to maneuvers. As the angle between the crossing streets departs further from 90°, vehicles and pedestrians will spend more time in the region conflicting with other traffic streams and because of this the delay and collision rate will also increase. Furthermore, the paved area and therefore construction and maintenance cost will increase. Practice shows that these effects increase dramatically with angles less than 60° or greater than 120° [6]. An example of angle of intersection is presented in Figure 9.
15 Older drivers have significantly more problems at skewed intersections than the average drivers.
Therefore, the Guidelines and Recommendations to Accommodate Older Drivers and Pedestrians Handbook recommends an angle of intersection of no less than 75°. If the angle must be less than 75°, it recommends that right turn on red be prohibited [11].
Figure 9 – Example of Angle of Intersection [5]
There are several ways for treating existing or planned intersections with unfavorable angles. One of the streets or even both could be realigned with horizontal curves to produce a better angle. In some cases, one intersection can be separated into two intersections, creating an offset. Another option is to use islands to guide drivers and pedestrians in a better way through the intersection and reduce the paved area [6].
When current intersecting roadways do not meet the desired characteristics, redesigning the intersection is suggested. Streets intersecting at severe angles need extensive turning roadway areas and tend to limit visibility, particularly for drivers of heavy vehicles. When a truck is on an obtuse angle, the driver has blind areas on the right side of the vehicle. Severe angle intersections increase exposure time for the vehicles crossing the main traffic flow [5]. Realigning roadways as shown in Figure 10 has been shown to be beneficial.
16 The biggest advantage is obtained when the curves used to realign the roads allow operating speeds
nearly equivalent to the roadway approach speeds [2].
The design of the profile and alignment should be cautiously considered if there is a potential for the signalization of the intersection, since vehicles would enter the intersection at speed rather than from a stop condition [5].
2.2.5 Turning radius
The design of the corner radius affects how drivers pass through the intersection, including the speeds chosen as well as the path the driver follows [5]. An illustration of the turning radius is presented in Figure 11.
Figure 11 – Turning radius [12]
The choice of curb radii is paramount to optimum intersection function. Curb radii that are too small will lead to large vehicles slowing radically and/or encroaching over curbs and lane lines, causing delays and possibly accidents. Curb radii that are too large waste construction and right-of-way funds and cause longer intersection crossing times for pedestrians, which also causes delays and leads to crashes [6]. A comparison between large and small turning radius is presented in Table 1.
17 Table 1 – Turning Radius Effects [5]
Benefits of Larger Radii Benefits of Smaller Radii Accommodates larger vehicles without
encroachment
Permits higher turning-vehicle speeds in free-flow situations
May allow the presence of islands for traffic control devices and pedestrian refuge areas
Reduced vehicle crossing time
Reduced pedestrian crossing time leads to reduced vehicular delay at signalized
intersections
Reduced turning speeds can benefit pedestrians
Reduced pavement area
The choice of design vehicle greatly affects the selection of an appropriate turning radius or turning roadway width. Attention should be given to occasional vehicles (i.e., moving vans) as well as the predominant vehicle (i.e., passenger car) when proposing an intersection design [5].
The correlation between lane width, radius, and intersection angle affects the path vehicles take when turning at an intersection. The selection of the radius at an intersection affects turning-vehicle speeds and lane positioning. Consideration of the type of vehicle used in the design and acceptable lane positioning should be made based on the types of major and minor street. Curb radii should be selected as to provide accommodations for desired design vehicles. For intersections with minor roadways it is frequently considered acceptable for infrequent large trucks to occupy both lanes on the minor roadway in the course of completing the turning maneuver. This type of design would be inappropriate for a major crossroad, of course, or where trucks are frequent users of the minor roadway [5].
One way a designer can settle between the needs of large vehicles and pedestrians is by choosing the best type of intersection curb design, which may be one of the following types:
simple radius;
simple radius with entering and exiting tapers; 3-centered symmetric compound curve; 3-centered asymmetric compound curve [8].
Each basic design type has its advantages and disadvantages. The simple radius is the easiest to design and construct and, therefore, it is the most common. However, the designer should also think through the benefits of the simple radius with an entering and exiting taper [8]. Its advantages as compared to other designs include:
the simple radius with tapers provides approximately the same transitional advantages as the compound curvature arrangements, but it is easier to design, survey and construct;
to accommodate a specific vehicle with no encroachment, a simple radius requires greater intersection pavement area than a radius with tapers. For large vehicles, a simple radius is often an unreasonable design, unless a channelized island is used;
a simple radius results in greater distances for pedestrians to cross than a radius with tapers; for angles of turn greater than 90°, a radius with tapers is a better design than a simple radius, primarily because less intersection area is required [8].
18 The following curb radii are generally recommended:
4.6 m to 7.6 m to accommodate passenger cars and;
12 m to 15 m to accommodate heavy volumes of trucks or buses [5].
However, the absolute minimum curb radius used should be 1.5 m to enable the effective use of street sweepers [5].
2.3 Signal timing methodologies
At the intersection of two streets with no traffic control, drivers are expected to choose for themselves who is to go and who is to wait (rule applicable in the United States, in European countries generally the right hand rule will apply). Their only guidelines are the rules of the road, as defined in the Uniform Vehicle Code and the laws of the state, and their politeness and cooperation. For intersections where the traffic demand is small and the conditions satisfactory, drivers do not have trouble choosing their own right-of-way in this manner, and their delay is very small. As soon as traffic begins to increase, drivers are faced with too many decisions to make in order to safely choose their own right-of-way, and some assistance is needed to help them with these decisions. The simplest form of traffic control is a yield sign on one of the streets to let drivers know which movement has the right-of-way when a decision must be made. This, also, is only appropriate for small traffic volumes. As traffic increases, drivers must be stopped so that they have time to make complex right-of-way decisions. A two-way stop, with stop signs on the minor street, serves this purpose [6].
Eventually the traffic will build to the point that choosing the right-of-way is not the only problem, and moving the traffic efficiently becomes a crucial concern also. Stop signs are effective in the former task, but they force every driver to stop and start, which is not effective because a large proportion of the time will be spent just waiting for the drivers to get going. At this point, traffic signals can assign right-of-way much more efficiently because the delay associated with starting up is only felt by the first two or three cars in the platoon [6].
When used correctly, the traffic signals can be one of the best intersection control devices. They are not suited for all intersection congestion and accident problems and their installation in some circumstances may produce adverse results, e.g. delays may increase forcing traffic to divert to unsatisfactory alternate routes which may increase problems elsewhere [9].
It is important that before installing traffic lights at an intersection, all the important factors be considered. After the signals are installed, their effect should be studied at intervals, firstly to ensure that they are operating as designed, and secondly to ensure that their operation remains compatible with prevailing traffic conditions [9].
19 Table 2 – Appropriateness of traffic signals [9]
Symptom Cause Signal control
Congestion
Excessive delays at STOP or GIVE WAY
signs Appropriate
Excessive delays to turning traffic Appropriate Volume greater than capacity Inappropriate Accidents
Angle collisions and pedestrian accidents Appropriate
Rear-end accidents Inappropriate
Right turn accidents Inappropriate
Access control
Flow on to freeways Appropriate
Inefficient flow to traffic on surface street
system Appropriate
One of the side effects of signalization is that the traffic flow on a major road is broken up into platoons. This assists nearby pedestrians to cross the major roads and allows vehicles in nearby streets to cross or enter the major road [13].
Another thing that should be considered when designing an intersection is parking. On-road parking in close proximity to an intersection can cause the following:
reduction in the numbers of effective lanes on an approach or departure; misleading activations of the traffic detectors;
obstruction of signal displays and other control devices; reduced sight distances for vehicle, cyclist or pedestrian traffic; delays as vehicles maneuver into parking spaces [14].
Parking should be designed so as not to affect sight distance or interrupt the flow of traffic turning at an intersection. This may require signed restrictions in excess of the statutory restrictions. In addition to these requirements, parking on major roads should preferably be prohibited within 100 m of signalized intersections [14].
Some of the most important aspects of the traffic signal design are: controller type; phasing plan; signal timing; left-turn treatments; right-turn treatments; pedestrians.
20 2.3.1 Controller type
Traffic engineering reference sources describe three types of traffic signal controllers: pre-timed, fully actuated, and semi-actuated [7].
The pre-timed control is best suited for intersections where the traffic flows and patters are constant from day to day. These kinds of conditions are usually found in downtown areas. Also, pre-timed control is better used at intersection where three or fewer phases are used [15].
Pre-timed control has several advantages. First, it can be used to provide efficient coordination with adjacent pre-timed signals, since both the start and the end of green timings can be predicted. Second, it does not require detectors, thus making its operation immune to problems associated with detector failure. Finally, it requires a minimum amount of training to set up and maintain. On the other hand, pre-timed control can’t compensate for unplanned fluctuations in traffic flows, and it tends to be inefficient at isolated intersections where traffic arrivals are random [15].
Semi-actuated control is best used at intersections that are part of a coordinated arterial street system. Semi-actuated control may also be used at isolated intersections with low-speed major rad and lighter crossroad volume [15].
Semi-actuated control has several advantages. The main advantage is that it can be used effectively in a coordinated signal system. Also, relative to pre-timed control, it reduces the delay incurred by the major-road through movements during periods of light traffic. Finally, it does not require detectors for the major-road through movement phases and hence, its operation is not compromised by the failure of these detectors [15].
The main disadvantage of semi-actuated controllers is that continuous demand on the phases associated with one or more minor movements can cause excessive delay to the major road through movements if the maximum green and passage time parameters are not appropriately set. Another downside is that detectors must be used on the minor approaches, thus requiring installation and ongoing maintenance. Semi-actuated operation also requires more training than that needed for pre-timed control [15].
Fully-actuated control refers to intersections where all phases are actuated and hence, it requires detection for all traffic movements. Fully-actuated control is ideally suited to isolated intersections where the traffic demands and patterns greatly change during the course of the day [15].
As for the previous controller types, there are advantages and disadvantages for fully-actuated controllers. The first advantage would be that they reduce delay relative to pre-timed controllers by being highly responsive to traffic demand and to changes in traffic pattern. Additionally, detection information allows the cycle time to be efficiently allocated on a cycle-by-cycle basis. Finally, it permits phases to be skipped if there is no call for service, thereby allowing the controller to reallocate the unused time to a subsequent phase [15].
The major disadvantage of fully-actuated control is that its cost is higher than that of other control types due to the amount of detection required. It may also results in higher percentage of vehicles stopping because green time is not held for upstream platoons [15].
21 Bellow, in Figure 12 and Figure 13 we have two examples of green phases for fully-actuated
control.
Figure 12 – Max out – reach of maximum green time [16]
Figure 12 represents the case where the green phase reaches its maximum duration. This happens during the peak hours, when the vehicles are continuously arriving at the intersection. As we see from the figure, the minimum green phase is set to 10 seconds. For each vehicle that arrives, the phase is extended with 4 seconds, in this example. However, when the maximum phase duration is reached, the phase will end, even though there still are cars that need green time. This is done to reduce delay for the other street, as we can’t have only one street using the green phase.
Figure 13 – Gap out – no vehicles detected [16]
Figure 13 represents the case where the green phase is ended prematurely, because there are no more cars to serve.
22 If all the phases at an intersection are non-actuated, the length of each phase, therefore the cycle
length, will be fixed. Generally, if the intersection is far away from its neighbors to operate in an isolated mode, actuated operation can produce lower delays and a better level of service [7].
When all the phases at an intersection are actuated, the length of each phase, therefore the cycle length, will vary with each cycle. This situation denotes the condition of fully actuated operation. In such conditions, the coordination with neighboring signals is not possible. Fully actuated signals are generally used only at intersections where distances are such that coordination would not be expected to be beneficial or where, for administrative or cost reasons, it would not be expected to be implemented [7].
2.3.2 Phasing plan
As [15] states, “phasing represents the fundamental method by which a traffic signal accommodates the various users at an intersection in a safe and efficient manner” [15].
Phasing decreases the conflict rates between traffic flows at signalized intersections. A phase may involve:
One or more vehicular movements;
One or more pedestrian crossing movements;
A combination of vehicular and pedestrian movements [17].
Traffic signals have to be designed to operate under a wide variety of traffic conditions. While designs are based on peak traffic conditions, efficient operations at peak and lower volumes can be achieved by using traffic actuated controllers [13].
The choice of a phasing plan for an intersection depends primarily on the traffic flows and pedestrian flows for each movement. Phasing can also depend on geometry. Design strategies should be proposed to:
minimize the number of phases to make best use of the available time; minimize the cycle time;
run as many compatible movements as possible during each phase; restrict each phase to non-conflicting movements;
allow each movement to run in as many phases as possible [13]. The design objectives are:
promote safety, efficiency, consistency and simplicity; optimize capacity and reliability;
minimize operation costs and driver frustration [13].
When put to practice, it may not always be possible to achieve all the objectives at the same time, so a compromise might be necessary. However, safety should always be the main concern.
23 The most important aspect of any design of signal timing is choosing an appropriate phase plan. The
phase plan consists of the number of phases to be used and the order in which they are implemented. As a general guideline, “simple two-phase control should be used unless conditions dictate the need for additional phases” [7]. Because each phase of the plan has a lost time attached to it, as the number of phases used increases, the lost time will also increase.
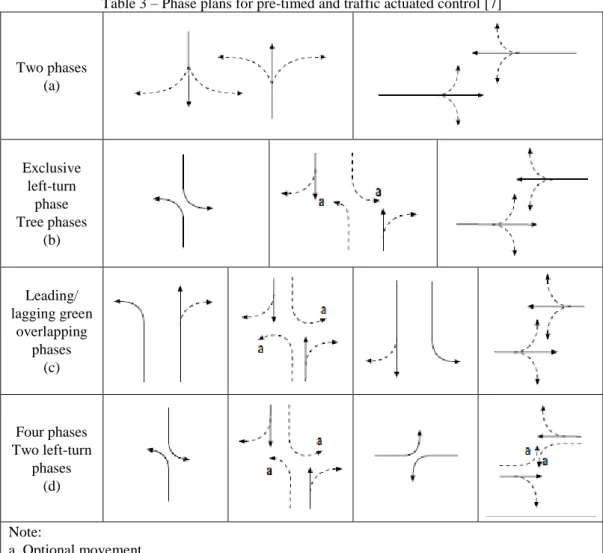
Table 3 shows a number of phase plans that can be used with both pre-timed and actuated controllers.
Figure 14 illustrates an optional phasing scheme that typically can be implemented only with actuated controllers.
Table 3 – Phase plans for pre-timed and traffic actuated control [7]
Two phases (a) Exclusive left-turn phase Tree phases (b) Leading/ lagging green overlapping phases (c) Four phases Two left-turn phases (d) Note: a. Optional movement
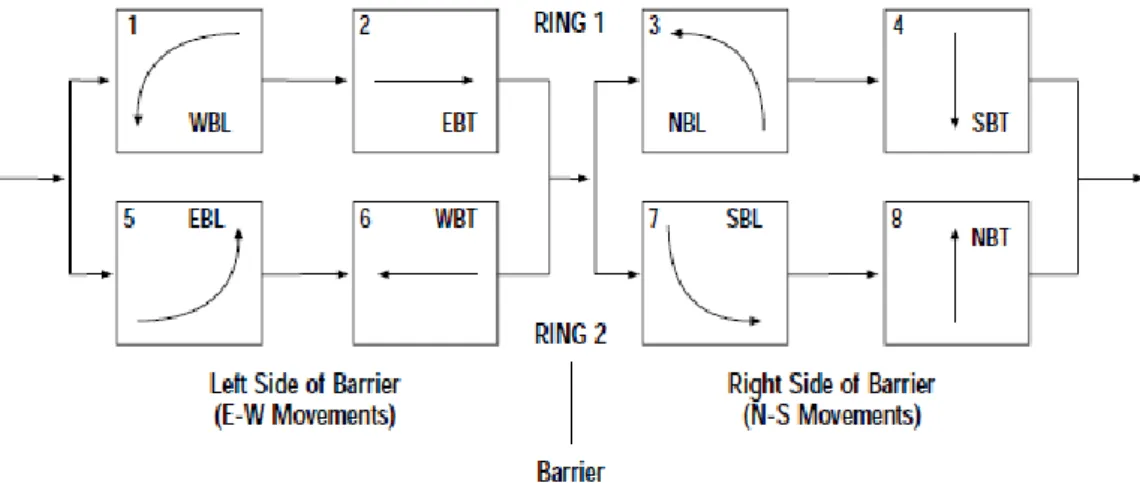
24 Figure 14 – Dual-ring concurrent phasing scheme with assigned movements [7]
Two phase control is the most basic of the available phase plans. Each of two intersecting streets is given a green phase, one street at a time, during which all movements on the street are permitted to cross the intersection. The left and right movements are made on a permitted basis against an opposing traffic flow, pedestrian flow or both. The two phase plan is shown in Table 3(a). This phase plan is usually used unless turn volumes require protected phasing [7].
Multiphase control is adopted at any intersection where one or more left or right turns require protected phasing. In practice, we usually have the left-turn movements that need protected phasing [7].
The left-turning vehicles at intersection cause more problems than any other vehicular movement. The identification of such problems may be achieved through accident analysis or capacity analysis. The selection of any combination of lane assignments or signal treatments should be established upon the overall effectiveness of the control schemes available. These problems can be treated in a number of ways. The objective of any treatment is either an increase in capacity, a decrease in accident potential, or a combination of the two [18].
Multiphase control can be designed in multiple ways, depending on the number of turns requiring protection and the sequence and overlaps used. Table 3(b) presents a three-phase plan where left-turn protection is provided for both left-left-turn movements on the major street. It is followed by a through-phase for both directions of the major street, during which left turns in both directions may be permitted if necessary.
Table 3(c) shows what is commonly referred to as leading and lagging green phasing. The phase starts with the through plus turning movements for one of the main street’s legs. Then the left-turning movement stops for the first leg, and opposing through movement starts, after which the movement for the first leg completely stops and the left-turning movement for the second leg starts. The final phase accommodates all movements on the minor street.
25 The three-phase plan may be expanded to a four-phase plan if the left-turning movements for both
streets need protection. Such a phase plan is presented in Table 3(d). If really needed, left-turning movements can be allowed to continue on a permitted basis along with the through traffic. When providing protected phasing, it is better to also provide separate lanes for the turning movements. The dual-ring concurrent concept is illustrated in Figure 14. Note that eight separate phases are shown, each of them accommodating one of the through or left-turning movements. A barrier separates the phases for the major and the minor road. Any phase in the top group (Ring 1) may be displayed with any phase in the bottom group (Ring 2) on the same side of the barrier without introducing traffic conflicts. For simplicity, the right turns are omitted and assumed to proceed with the through movements [7].
The advantage of the dual-ring concept is that it is highly responsive to the traffic demand. Pre-timed controllers are not responsive, as they have fixed settings. The maximum flexibility is provided by allowing the first (usually left-turn) phases in Rings 1 and 2 to terminate independently after their respective demands have been satisfied [7].
As [7] says, “the establishment of a phase plan is the most creative part of signal design and deserves the careful attention of the analyst. A good phase plan can achieve efficiency in the use of available space and time, whereas an inappropriate plan can cause inefficiency” [7].
2.3.3 Signal timing
After a phasing plan has been chosen, the designer must review the traffic using each phase to calculate the effective volume for the phase in question. In the past, methods used for capacity analysis have been used to the signal-timing problem to adjust traffic volumes to passenger car equivalents. Special attention should be paid in applying these correction factors, as factors used in combination may be misleading and unrealistic [6].
Correction factors are also used to convert turning traffic to through-traffic equivalents, and this approach is even more likely to lead one astray. Field experience is essential along with a healthy respect for variability.
Here are some typical values to use as a starting point: one truck = 1.5 through passenger cars;
one right-turner = 1.4 through passenger cars (1.25 if the curb return radius exceeds 7.5 m); one left-turner = 1.6 for non-protected movement or left turns from a through lane, or 1.1 for protected movements from a left-turn bay [6].
Once these equivalencies can be quantified, the designer can adjust the traffic volumes arriving at the intersection to equivalent through passenger cars and then assign them to lanes [6].
The traditional method of calculating signal timings for an isolated intersection uses the vehicle delay as a measure of performance. However, vehicle stops, queue length, and person (pedestrian, bus passenger, etc.) delays and stops should also be considered when determining signal timings (cycle time, in particular) [19].
26 Signal timing includes the determination of the appropriate cycle length (the time needed to run a
complete sequence of phases) and the distribution of time between the competing movements and phases. The timing distribution is constrained by minimum green times required by both pedestrians and vehicles to cross the intersection [3].
Most of the analytical tools developed for cycle length selection focus on under saturated flow. These critical intersection approaches to cycle length selection are primarily for isolated intersections and are all based on the assumption that vehicular delay is most important. One of the most known method used to calculate the cycle length is Webster’s model (Figure 15). Webster used computer simulation and field observation to develop his method, and he intended to minimize delays when arrivals are random [15]. The formula is as follows [20]:
Y L C 0 . 1 5 5 . 1 (1) where:
C – optimum cycle length, (s);
Y – the total saturation, which is the sum of the critical phases divided by the maximum saturation flow;
L – total lost time per cycle (calculated by multiplying the number of critical phases by 3.8 seconds).
Figure 15 – Webster’s Optimum Cycle Length [15]
There are some debates regarding the maximum saturation, with values ranging from below 1,800 to as much as 2,200 in aggressive urban conditions [6]. We will use 1,800 as the maximum saturation flow, as it is a common value used for the cycle length calculation with this method.
27 Webster’s cycle length will go to infinity when the demand approaches the maximum saturation
flow. This is a problem caused by the fact that Webster did not study congested intersections. The value for the maximum cycle length is tremendously controversial in the traffic engineering community. Some prefer long cycle lengths, arguing that once the flow of cars is moving, it should not be stopped. Another reason for using long cycle lengths would be to reduce the percentage of the cycle time wasted in startup lost time [6].
Even though the arguments for long cycle lengths may seem good, there are several aspects that should not be forgotten:
only the first 15 or so drivers may be tightly packed entering the intersection. Following drivers are responding to the car in front of them rather than the distant signal, and reaction times may increase departing headways.
some approaches are widened compared to the upstream roadways. Any green time longer than what it takes to empty the widened section will be fed by fewer lanes and the flow will go down. driver attention spans are short, and drivers may stop paying attention to the signal after 30 seconds or so [6].
The Highway Capacity Manual states that “these experience-based observations suggest that excessive cycles might not gain the capacity increase that Webster (along with many traffic engineers) predicts, but the delay they induce is no illusion. Consequently, many experienced professionals establish a fixed maximum value of 120 seconds, but practices vary widely” [6]. Another method for calculating the cycle length is provided by the Highway Capacity Manual (HCM) (Figure 16). The HCM offers a quick estimation method for the selection of a cycle length. The formula is as follows [21]:
RS RS CS L C ) , min( 1 (2) where: C – cycle length, (s); L – total lost time, (s);
CS – critical sum of traffic volumes from the critical movement analysis, (veh/h); RS – reference sum flow rate = 1710*PHF*fa, (veh/h);
fa – area type adjustment factor (0.90 if CBD, 1.00 otherwise).
Primarily, this calculation is intended for planning-level analyses. This method has the same problem as the Webster method, with the cycle length going to infinity when the demand approaches the capacity. Because of this, HCM suggests that the maximum value for the cycle length is set by the local jurisdiction (such as 150 seconds). The minimum cycle length suggested for use is 60 seconds [15].
28 Figure 16 – HCM Cycle Length Estimation[15]
The delay experienced by drivers depends on cycle length and volume. Higher volumes will lead to longer delays. Shorter cycle lengths tend to reduce the delay given that they do not result in inadequate intersection capacity. Oversaturated conditions require special considerations, and Webster and HCM models are not valid during that range of conditions [15].
According to [6], “green splits are calculated by dividing the cycle length in proportion to the critical lane volumes. Phases serving light traffic demand at otherwise heavily traveled intersections may require a disproportionately large portion of the cycle to avoid being too short” [6].
The minimum green time required for pedestrians can be calculated (will be presented in the next subchapters), but the minimum green time for vehicles is usually chosen by engineering agencies, with values from 5 to 15 seconds being common [6].
2.3.4 Left-turn treatments
As is stated in [17], “one of the main problems in phasing is the left-turn phasing. As left-turns and opposing through volumes increase, the engineer should consider left-turn phasing. The most common practice allows opposing left-turns to move simultaneously as concurrently timed phases” [17].
There are five ways to treat the left-tuning movements: permissive only, protected only, protected-permissive, split phasing, and prohibited. Phasing can have a significant impact on signal system effectiveness for a number of reasons, including:
Permissive only left turn operation may reduce delay for the intersection, but may adversely affect intersection safety, because it requires motorists to choose acceptable gaps;
29 Protected only left turn phases may reduce delay for turning vehicles but are likely to increase
overall intersection delay;
Protected-permissive left turn phases can offer a good compromise between safety and efficiency but could limit available options to maximize signal progression during coordination unless innovative displays are used;
Split phasing may be applicable with shared lanes, but could increase coordinated cycle length if both split phases are provided a concurrent pedestrian phase;
Prohibited left turns may be used selectively to reduce conflicts at the intersection [15].
Protected-permitted phasing is usually a good compromise between protected only and permitted only and will generally improve both capacity and driver convenience for left turning traffic. However, because this is like a compromise between the two phasing options, this solution will not only have the advantages of the protected turning, but also the disadvantages of the permitted turning [3].
Protected-only phasing is usually adopted at intersections where protected-permitted phasing is likely to present danger to left turning traffic or pedestrians that conflict with left turning traffic [3]. The protected left turns that precede the through movements are referred to as leading left turns (Figure 17), and the protected left turns that follow the through movements are referred to as lagging left turns (Figure 18) [3].
As we find in [3], “while protected-permitted left turn phasing and lead-lag phasing are both legitimate and recognized practices, the combination of these two schemes can produce a serious hazard, known as Left Turn Trap” [3].
Figure 17 – Leading left turn protection [3]
30 The term “split-phase” is commonly used to describe a phase plan where movements from opposing
approaches are served separately, as illustrated in Figure 19. The practice shows that this type of phasing is usually less efficient in terms of intersection capacity and performance than phasing plan where opposing movements run at the same time [3].
Figure 19 – Split phase operation [3]
What was said about the left-turn treatments until this point refers to countries where cars are driven on the right side of the road. When the cars are driven on the left-side of the road, as it is done in Australia for example, left-turn treatments have another meaning, which is presented bellow. The approach left turn lanes may be shared or exclusive. A lane is shared when the left-turning vehicles complete their turning from a through lane. An exclusive lane (dedicated lane) is used only by left turn vehicles [13].
Depending on site conditions and constraints a left turn movement can be permitted to operate in: one phase;
separate phases (overlapping/non overlapping);
all phases (exclusive protected depart lane – left turn on red is not permitted in Queensland) [13].
If a corner island is provided, the left turn movement can be allowed to turn:
left at any time it is safe to do so by providing a Turn Left At Any Time With Care sign; at any time into an exclusive departure lane;
when a left turn green aspect is displayed[13]. The first two options are not controlled by signals.
If a corner island is not provided, the left turn movement can be: banned;
allowed to run concurrently with other vehicles on the same approach by displaying a full green aspect;
allowed to run independently of other vehicles on the same approach by displaying a left turn green arrow [13].
31 Banning a left turn is not a common practice and should be avoided unless the left turn geometry is
so restrictive that vehicles cannot safely negotiate the turn [13].
Left turn vehicles can normally be accommodated during the phase for through movement on the same approach. However, the left turn capacity can be increased by allowing the left turns to run complementary to a right turn phase as shown in Figure 20. This practice can be confusing for drivers and pedestrians, so it should be tested by computer analysis first [13].
Figure 20 – Left turn green arrow [13]
Left turn arrows should only be used when vehicles are able to turn without conflict with other vehicles or pedestrians. Left turn arrows can be used also as a means for pedestrian protection. The left turn is stopped using a left turn yellow arrow followed by a left turn red arrow which is held for a predetermined period [13].
2.3.5 Right-turn treatments
As stated in [3], “three parameters define the right turn treatment for each approach”: Lane utilization: shared, exclusive or channelized;
Right turn on red (RTOR): allowed or prohibited; Signal protection: permitted, protected or both [3].
The lane utilization is usually established at the geometric design step, before of the signalization design. It is, however, important to guarantee that the lane utilization is compatible with the signal protection and with the accommodations for pedestrians [3].
RTOR is a matter of national legislation. However, there are cases when it is permitted by the legislation, but will still be prohibited for use at a specific intersection because of safety aspects, such as high accident rates, limited visibility etc [3].
Right turns run as permitted at the vast majority of signalized intersections, yielding to conflicting pedestrians and bicycles. In cases when there is heavy pedestrian traffic and vehicular green times
32 that exceed pedestrian crossing time requirements, protected right-turn phasing may be provided
[3].
Right turn treatments are usually not a big problem when the cars are driven on the right side of the road. However, in countries such as Australia, where cars are driven on the left side of the road, right turns become as big of a problem as left turns are for most of the European countries. The methodologies of dealing with the right turns in Australia are presented bellow.
Where through and right turn vehicles share a lane, the following may occur:
hazardous situations created by a right turning vehicle stationary in a through lane; blocking a through lane increasing intersection delays;
inefficient use of any right turn phase [13].
So, because right turns are the most problematic, there are several ways to accommodate these movements, including:
Protected Right Turn;
Diamond Turn. This is a right turning movement where the opposing right turns move simultaneously in a phase of their own (Figure 21);
Figure 21 – Diamond turn[13]
Diamond Overlap Turn. In this operation the opposing right turns start at the same time. When one terminates the through movement in the same direction as the extending right movement is started. When the extending right turn is terminated the other through movement is started. It is usually used in preference to a diamond turn (Figure 22);
Lead-Lag Turn;
Split Phase (Figure 23) [13].
There isn’t a specific set of rules on when to use or not to use a protected right turn phase. It will depend upon site conditions, traffic flows and signal timings. A rule of thumb would be to use protected phasing when two or more vehicles turn right each cycle [13].
33 Another rule would be that protected phasing is needed if drivers attempting to make a right turn
have insufficient opportunities to find gaps during the through phase and inter-green period and generally when three through lanes are being crossed [13].
Figure 22 – Diamond overlap phasing [13]
Figure 23 – Split phasing [13]
For existing intersections the need for a protected right turn phase is normally observed by field observations. If the right turn queue regularly does not clear in a cycle and the intersection is operating at a relatively high cycle time then this is a pretty clear sign that the intersection requires a protected right turn phase [13].
34 2.3.6 Pedestrians
When designing a signalized intersection, the design should take into consideration the needs of pedestrian as well as vehicular traffic. Pedestrian signal are needed:
When it is necessary to assist pedestrians in deciding when to begin crossing the road; To minimize vehicle-pedestrian conflicts;
When protected left or right turn phases are included in the signal sequence;
When vehicular signal indications are not visible to pedestrians using the crosswalk [3].
The minimum green times the pedestrians need to cross the intersection is calculated with the following formula [15]:
PC PW
Gp (3)
where:
Gp – is the minimum green interval duration needed to satisfy pedestrian crossing time, (s); PW – is the walk interval duration, (s);
PC – is the pedestrian clearance interval duration, (s).
The values for pedestrian walk interval duration are presented in Table 4. Table 4 – Pedestrian walk interval duration [15]
Conditions Walk Interval Duration (PW), s
High pedestrian volume areas 10 to 15
Typical pedestrian volume and longer cycle
length 7 to 10
Typical pedestrian volume and shorter cycle
length 7
Negligible pedestrian volume 4
Conditions where older pedestrians are present Distance to center of road divided by 0,9 m/s The values for pedestrian clearance interval duration are presented in Table 5.
Table 5 – Pedestrian clearance time [15] Pedestrian Crossing
Distance, m
Walking speed, m/s
0.9 1.05 1.2
Pedestrian Clearance Time (PCT), s
12 13 11 10
18 20 17 15
24 27 23 20
35 Pedestrian walking speeds vary significantly and are affected by a number of factors, such as age,
sex, motivation, presence of other pedestrians and other traffic impediments. The distribution of free flow walking speeds varies as follows:
minimum walking speed 0.74 m/s; maximum walking speed 2.39 m/s;
maximum speed of wheelchairs 10 km/h = 2.78 m/s (wheelchairs are classified as pedestrians in legislation);
average unimpeded free-flow 1.35 m/s walking speed [14].
Calculation of green time at traffic signals is based on an average design walking speed of 1.2 m/s, but this is still faster than some pedestrians can manage. In particular, elderly pedestrians often adopt significantly lower speeds than the younger part of the population [14]. Table 6 provides guidance on the walking speed to adopt for various circumstances.
Table 6 – Walking speed for senior pedestrians [14]
Walking pace Mean speed (m/s) 10th Percentile speed (m/s)
Normal 1.13 0.8
Hurried 1.41 1.0
Rushing 1.71 1.0
During the design of new signalized intersections the base case of traffic analysis should consider pedestrian crossings on all legs of the intersection. At some intersections it may be desirable to only include pedestrian crossings on only three legs. In these cases, pedestrians can still access all corners of the intersection even though some movements may require negotiating all three remaining legs of the intersection. However, in many cases including a pedestrian crossing on the fourth leg will have minimum traffic impact [14].
Pedestrian crosswalks should be located:
as near as possible to the desired line of pedestrians; and, desirably so that drivers intending to turn are able to see the pedestrians; and
as near as possible and no greater than 20 degrees to the shortest path across the roadway to minimize clearance times, but as close as possible to parallel vehicle movements with at least 0.6 m clearance [9].
The minimum width of a crosswalk is set to 2.4 m clear distance between crosswalk lines. Where the pedestrian volumes are very high or large numbers of pedestrians arrive in groups, wider crossings, up to 10 m may be used [9].
36 3. PRESENT CONDITIONS AT THE STUDY’S INTERSECTION
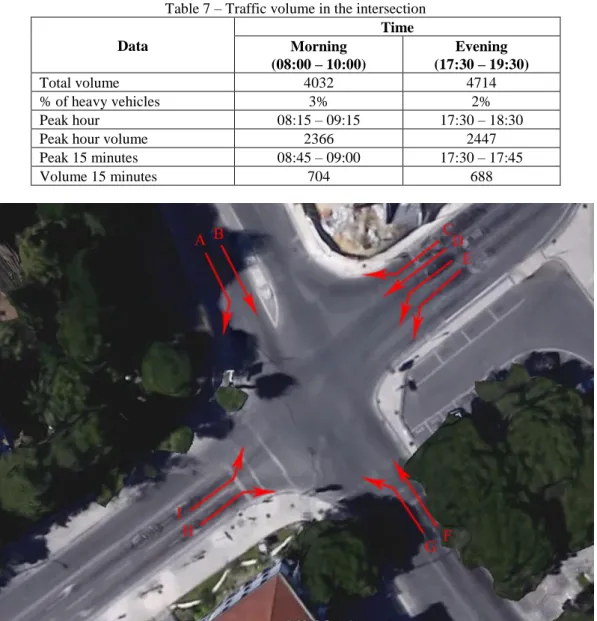
The City Hall intersection, located in Leiria, Portugal, connects the traffic streams from the following streets: Rua dos Martires, Rua do Município, Rua Dr. João Soares and Rua Machado dos Santos. A view of the intersection is presented in Figure 24.
Figure 24 – Aerial view of the City Hall intersection [22]
There are several important points near the intersection, such as the City Hall, the Court, Social Security and other services, which makes this intersection an important point of connection in the city, from a traffic point of view. To add to this, the existence of multiple shops and pedestrian attractions make this intersection an important point for pedestrians as well.
The intersection is a simple four-leg intersection, with three of its legs being two-way streets, and one of its legs being a one-way street. All the possible traffic movements in the intersection with the actual lane configuration are presented in Figure 25.
The traffic counts were carried out during a business day: one during the morning peak hours, and one during the evening peak hours. All the data was provided by the City Hall of Leiria, and is presented in Table 7.
![Figure 7 – Realigning multi-leg intersections [5]](https://thumb-eu.123doks.com/thumbv2/123dok_br/18627834.910826/12.892.151.731.562.744/figure-realigning-multi-leg-intersections.webp)
![Figure 11 – Turning radius [12]](https://thumb-eu.123doks.com/thumbv2/123dok_br/18627834.910826/16.892.242.654.462.855/figure-turning-radius.webp)
![Figure 12 – Max out – reach of maximum green time [16]](https://thumb-eu.123doks.com/thumbv2/123dok_br/18627834.910826/21.892.210.686.273.533/figure-max-reach-maximum-green-time.webp)
![Figure 15 – Webster’s Optimum Cycle Length [15]](https://thumb-eu.123doks.com/thumbv2/123dok_br/18627834.910826/26.892.236.670.616.937/figure-webster-s-optimum-cycle-length.webp)
![Figure 22 – Diamond overlap phasing [13]](https://thumb-eu.123doks.com/thumbv2/123dok_br/18627834.910826/33.892.196.700.285.981/figure-diamond-overlap-phasing.webp)
![Table 4 – Pedestrian walk interval duration [15]](https://thumb-eu.123doks.com/thumbv2/123dok_br/18627834.910826/34.892.140.753.629.785/table-pedestrian-walk-interval-duration.webp)
![Figure 24 – Aerial view of the City Hall intersection [22]](https://thumb-eu.123doks.com/thumbv2/123dok_br/18627834.910826/36.892.148.745.315.718/figure-aerial-view-city-hall-intersection.webp)