UNIVERSIDADE DE LISBOA
FACULDADE DE CIÊNCIAS
DEPARTAMENTO DE FÍSICA
C
ONTRIBUTION TO FUNDAMENTAL ASPECTS OFB
IOPHYSICS,
RADIOBIOLOGY
,
AND MODELING OF CELLULAR RESPONSE TOLOW RADIATION DOSES
A
NAL
ÚCIAV
ITALB
ELCHIORDOUTORAMENTO EM ENGENHARIA BIOMÉDICA E BIOFÍSICA
UNIVERSIDADE DE LISBOA
FACULDADE DE CIÊNCIAS
DEPARTAMENTO DE FÍSICA
C
ONTRIBUTION TO FUNDAMENTAL ASPECTS OFB
IOPHYSICS,
RADIOBIOLOGY
,
AND MODELING OF CELLULAR RESPONSE TOLOW RADIATION DOSES
A
NAL
ÚCIAV
ITALB
ELCHIORTese orientada pelo Professor Doutor José Pedro Trancoso Miragaia Vaz e
pelo Professor Doutor Pedro Miguel Dinis de Almeida, especialmente
elaborada para a obtenção do grau de doutor em Engenharia Biomédica e
Biofísica
DOUTORAMENTO EM ENGENHARIA BIOMÉDICA E BIOFÍSICA
A
BSTRACT
This thesis aims at studying the direct and bystander effects (observations in which effects of ionizing radiation arise in non-irradiated cells) induced by alpha-particle irradiation, using a Po-210 source, in a human lung adenocarcinoma cells (A549), and at investigating and providing a contribution to the clarification of the protective or potentially detrimental effects of low-dose exposures (< 100 mGy). Besides addressing and analyzing the toxic effects of α-radiation on the A549 cell line the studies undertaken may contribute toward the goal of improving the effectiveness of targeted therapies, with alpha-radiation, such as radioimmunotherapy or Boron Neutron Capture Therapy (BNCT). The work performed consisted, at first, of a dosimetric study in order to determine the average local dose in a cell monolayer, encompassed by experimental and computational studies, followed by a biological study of the direct and bystander effects of α-radiation exposure. The averaged dose rate at the cell monolayer was calculated; through the Linear-Energy-Transfer (LET) value measured using a Passivated Implanted Planar Silicon (PIPS) detector, to be 25 mGy/min. To study the cellular response at low-dose exposures, several studies were conducted using the A549 cell line and a 210Po α-source. Initially, the effects of directly irradiated A549 cells were analyzed through the micronucleus and clonogenic assay. Then, the time and dose dependence of directly and bystander effects in the region of very low doses, was investigated through micronucleus and clonogenic assay. The study encompassed three different cell culture conditions: i) a culture of irradiated cells, ii) a medium transfer culture with non-irradiated cells and iii) a culture with irradiated cells after centrifugation. A dependence on dose and time was observed in both directly irradiated and bystander cells. Taking the advantage of the in situ γ-H2AX technique, the way how the bystander signals released after low-doses of α-radiation are influenced by the number of irradiated cells was studied. Evidence that bystander signals can easily spread through the culture medium was observed. Moreover, the neighboring of irradiated cells differ with the number of irradiated cells, i.e. with a higher number of cells being irradiated, the cellular damage in bystander areas seems to increase. Finally, the gene expression, in GADD45A, BCL2A1 and PTGS2 genes, was assessed with the qRT-PCR technique. This study revealed that all genes are expressed both in directly irradiated and bystander cells, except PTGS2. Moreover, the differences between gene expression levels in both irradiated and bystander cells, for the same dose value, suggest that the mechanisms underlying the response of both types of cells to radiation are different from each other.
Summarizing, our results emphasize that the risks attributable to low doses encompass a complex cellular response. The observed hyper-radiosensitivity, time and dose-dependence of the bystander effects and gene expression profiles and the easily spread of bystander signals over the cell culture, raise important questions about the potentially detrimental effects resulting from low dose exposures, which are not included in a simple linear extrapolation from higher dose effects.
R
ESUMO
Esta tese aborda o estudo dos efeitos biológicos, induzidos por exposição a radiação-alfa (α), em células tumorais de pulmão humano (linha celular A549). Foram quantificados os efeitos biológicos em células diretamente irradiadas e em células bystander (efeitos biológicos observados em células não expostas diretamente à radiação), com o objetivo de aprofundar o conhecimento acerca dos efeitos possivelmente protetores ou potencialmente prejudiciais de uma exposição a baixas doses de radiação (<100 mGy). O trabalho desenvolvido nesta tese permite, não só, analisar o efeito tóxico induzido pela radiação em células epiteliais (primeira linha de defesa do organismo) como também contribuir para o estudo da utilização de radiação-α em terapias como a radioimunoterapia ou a terapia por captura de neutrões com boro.
Este trabalho consiste, em primeiro lugar, num estudo de dosimetria, com o objetivo de determinar a dose média absorvida por uma monocamada celular, utilizando uma metodologia experimental e uma computacional, seguido de um estudo biológico dos efeitos diretos e dos efeitos bystander induzidos na linha celular A549 após exposição a baixas doses de radiação-α. A taxa média de dose medida na monocamada celular, através do valor da transferência linear de energia (LET) medido por um detector PIPS (Passivated Implanted Planar Silicon), foi de 25 mGy/min. Com o objetivo de quantificar a resposta celular induzida por baixas doses de radiação foram realizados vários estudos, utilizando a linha celular A549 e uma fonte de radiação-α de 210Po. No primeiro estudo, foi quantificada a lesão e a sobrevivência celular em células diretamente irradiadas, através do ensaio de micronúcleos e clonogénico, respetivamente. Em seguida, investigou-se a dependência, com o tempo de incubação e diferentes valores de dose, da lesão e sobrevivência celular na região de doses muito baixas (<mGy 100). O estudo inclui três culturas celulares distintas: uma cultura de células irradiadas, uma cultura de células não-irradiadas em contacto com o meio proveniente das células irradiadas e uma cultura com células irradiadas após centrifugação. Foi observada uma dependência, nas três culturas descritas, com o tempo e os valores de dose absorvida. Utilizando a vantagem da técnica γ-H2AX que permite uma quantificação da lesão celular in situ estudou-se a forma como os sinais de bystander se propagam através do meio de cultura influenciados por um diferente número de células irradiadas, após uma exposição a baixas doses de radiação-α. Foram observadas evidências de que os sinais de bystander podem facilmente propagar-se no meio de cultura. Além disso, verificou-se igualmente que o número de células irradiadas faz com que a lesão celular induzida nas células bystander seja diferente. Finalmente, avaliámos a expressão genética, nos genes GADD45A, BCL2A1 e PTGS2 utilizando a técnica de qRT-PCR. Este estudo revelou que somente os genes GADD45A e BCL2A1 são expressos em células diretamente irradiadas e em células bystander. As diferenças observadas na expressão genética nas células diretamente irradiadas e em células bystander, para um determinado valor de dose, sugerem diferentes mecanismos na resposta à radiação. Quando a resposta de ambos os genes é estudada em função dos valores de dose, é observada uma expressão não-linear com a dose, em ambas as condições, isto é, em células diretamente irradiadas e em células bystander.
Em suma, os resultados apresentados nesta tese evidenciam que os riscos da exposição atribuídos a baixas doses de radiação constituem uma resposta celular complexa. Os fenómenos observados, tais como, a híper-radiosensibilidade, a dependência temporal e com a dose dos efeitos de bystander e dos níveis de expressão genética e a facilidade de propagação dos sinais emitidos pelas células irradiadas ao longo da cultura celular, levantam questões importantes acerca dos efeitos potencialmente prejudicais associados à exposição a baixas doses de radiação. Assim, o trabalho descrito nesta tese sugere que os riscos associados a baixas doses de radiação não podem ser simplesmente extrapolados dos observados para a altas doses de radiação.
PALAVRAS CHAVE: Efeitos de bystander, risco, baixas doses de radiação, radiação de alto-LET,
A
CKNOWLEDGMENTS
First and foremost I want to thank my supervisors Professor Pedro Vaz and Professor Pedro Almeida. Their criticism joined with the fruitful discussions over the years made this work possible. Also their friendship and complete availability were paramount for the progress of my work. A special word to Professor Pedro Vaz. I work with him, since I’m at ITN, and without any doubts all that I learned with him were pivotal to the progress and enrichment of my scientific outcome. By the way, sorry for my contribution to the increase of your gray hair!
My next acknowledgment goes to Professor Luis Peralta, Professor Sebastião Rodrigues, Doctor Imre Balashazy and Doctor Marta Gromicho without whom this work would not have been possible. Thanks for opening me “your labs”, but especially for your friendship and completely availability.
I also want to thank all my colleagues from the UPSR who welcomed me with open arms when, in the middle of my PhD, I moved here. A special thanks goes to Doctor Margarida Goulart for her strong criticism allied with her ability to give me an intensive course from the basics to the ultimate goals of Radiobiology. Thanks MG!
A special word to Doctor Maria Luísa Botelho. When I first came to ITN, at 2005, fortunately I worked, for 4 years, in the Group of radiation technologies: processes and products, headed by Doctor Luisa Botelho. Without any doubts all that I learned with her were pivotal to the progress and enrichment of my scientific outcome and most of all for my multi-disciplinary way to solve any problem, always with the fingers crossed scientifically. And because, a group of excellence, besides a good leader, is composed of excellent people, my next acknowledgment goes to my babes for the eternity, Helena Marcos, Rita Melo, Sandra Cabo Verde and Telma Silva. Thanks for your support, friendship and for transform a bad day onto a beautiful day over the last 8 years and some months.
I also want to thank my colleagues from the Group of Dosimetry and Radiobiology, Ana Catarina Antunes, Catarina Figueira, Filipa Costa, Joana Bento, Mariana Batista, Mónica Mendes, Octávia Monteiro Gil, Pedro Teles, Raul Luis, Salvatore, Silvia Barros, Vanda Martins and Yuriy Romanets, for them support and friendship.
Some of you, Salvatore, Mariana, Mónica and Filipa, who have heard my “corridor “speeches very carefully, thanks for that moments…
A special thanks to Yuriy Romanets. He is a great friend always available to help in everything. Definitively a friend for the eternity…
A special thanks to Pedro Teles. I want to thank him for his friendship, support, but mostly for our discussions… I should say that I prefer those which end on a fight! Thanks for make each day a challenging one… hmm, not so challenging, because, I am graduated in Physics! The last but not the least, I want to express my gratitude to a special friend, more than a cabinet colleague. During the last years, she accompanied, not only me, but also, for 9 months, Rodrigo with a great, great love and care. Thanks, CF!
I gratefully acknowledge Fundação para a Ciência e Tecnologia for the PhD grant No. SFRH / BD / 42172 / 2007, to ITN and to IBEB for hosting and funding, which make this work possible.
I want to thank all the unconditional support of my all family during this enriching but hard period. A special thanks for my sweet parents who always support me and teach me to fight for my aims. I also want to thank my husband, Pedro, for him unconditionally support, personal and scientific, friendship, care and love during the last years.
To the two most important persons in my life, Francisco and Rodrigo, I just want to thank for making me each day unique and special. I love you guys.
Lisbon, December 2013 Ana Belchior
C
ONTENTS
ABSTRACT ... V RESUMO ... VII ACKNOWLEDGMENTS ... IX LIST OF ACRONYMS ... XIX LIST OF FIGURES ... XXI
CHAPTER 1 - INTRODUCTION ... 1
1.1 THE MOTIVATION – STUDY OF THE BIOLOGICAL EFFECTS OF IONIZING RADIATION ... 1
1.2 THE BYSTANDER EFFECTS ... 3
1.2.1 Gap-junction intercelular communication ... 4
1.2.2 Medium transfer technique... 5
1.3 THE STUDIES UNDERTAKEN ... 6
1.3.1 Dose and time dependence of targeted and untargeted effects ... 6
1.3.2 Does the number of irradiated cells affect the spatial distribution of bystander effects? ... 7
1.3.3 Bystander effects and gene expression ... 8
1.5 THE α-RADIATION SOURCE ... 9
1.6 ORGANIZATION...11
CHAPTER 2 - BIOMARKERS OF RADIATION EXPOSURE AND EFFECTS ... 13
2.1 INTRODUCTION ... 13
2.2 BIOMARKER OF RADIATION EXPOSURE ... 14
2.2.1 The cell cycle ... 15
2.2.2 DNA damage response ... 16
2.2.2.1 DNA damage signaling ... 18
2.2.2.1.1 DNA single- strand breaks (SSBs) ... 18
2.2.2.1.2 DNA double- strand breaks (DSBs) ... 19
2.2.2.1.3 DNA alteration of bases ... 19
2.2.2.1.4 DNA disruption of the sugar-phosphate backbone ... 20
2.3 BIOMARKERS OF DNA DAMAGE ... 20
2.3.1 The cytokinesis blocked micronuclei assay ... 21
2.3.2 The γ-H2AX assay ... 22
2.3.3 The clonogenic assay ... 25
2.3.4 Laboratory and experimental procedures ... 26
2.3.4.1 The cytokinesis blocked micronuclei assay ... 26
2.3.4.2 The γ-H2AX assay ... 26
2.3.4.3 The clonogenic assay ... 27
CHAPTER 3 - INTERACTION OF HEAVY CHARGED PARTICLES WITH MATTER ... 29
3.1 INTRODUCTION ... 29
3.2 ENERGY LOSS OF CHARGED PARTICLES ... 31
3.2.1 Interaction between charged particles and the electrons of the medium ... 33
CONTENTS xv
3.2.2.1 Collisional Stopping Power ... 35
3.2.3 The Bethe-Bloch formula for stopping power ... 36
3.2.4 Maximum energy transfer in a single collision ... 37
3.2.5 Minimum energy transfer in a single collision ... 38
3.3 SLOWING DOWN OF CHARGED PARTICLES ... 38
3.3.1 Linear-energy transfer (LET) ... 39
3.3.2 Range ... 41
CHAPTER 4 - DOSIMETRY OF AN α-PARTICLE DEVICE FOR IN VITRO CELLS IRRADIATION 43 4.1 INTRODUCTION ... 43
4.2 MATERIALS &METHODS ... 44
4.2.1 The α-particle irradiator setup... 44
4.2.2 Monte Carlo modeling and simulation of the experimental setup ... 45
4.2.2.1 SRIM ... 46
4.2.2.1.1 Structure of the program ... 46
4.2.2.2 MCNPX ... 47
4.2.2.2.1 Transport and interaction physics ... 47
4.2.2.2.1.1 Charged Particle Transport ... 47
4.2.2.2.1.2 Data Libraries ... 48
4.2.2.2.2 Structure of the input file ... 48
4.2.2.2.2.1 The definition of the geometry ... 50
4.2.2.2.2.2 The definition of the materials ... 50
4.2.2.2.2.3 The Source definition card: SDEF card ... 50
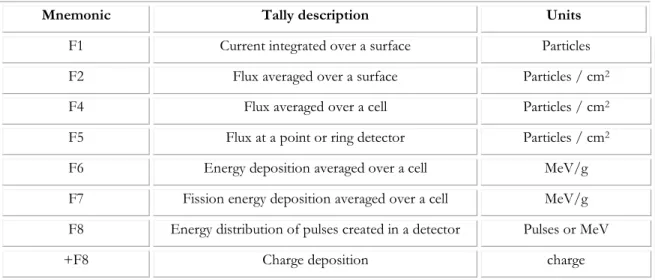
4.2.2.2.2.4 The tallies ... 51
4.2.2.2.2.4.1 The tally F8 ... 51
4.2.3 Dosimetry experiments ... 52
4.2.3.1 Alpha-particle energy spectra ... 52
4.2.3.1.2Dose calculation... 53
4.3 RESULTS ... 53
4.3.1 The simulation results ... 53
4.3.1.1 Results from SRIM ... 53
4.3.1.2 Results from MCNPX ... 54
4.3.1.2.1 Modeling and simulation of the response of the Sil(Li) detector ... 54
4.3.1.2.2 Modeling and simulation of the experimental setup ... 56
4.3.2 The dosimetry measurements ... 57
4.3.2.1 Energy and flux measurements of the 210Po source ... 57
4.3.2.2 Alpha-particle energy and LET spectra at the cell irradiation position ... 58
4.3.2.3 Dose calculation ... 61
4.4 DISCUSSION ... 61
CHAPTER 5 - DOSE AND TIME DEPENDENCE OF TARGETED AND UNTARGETED EFFECTS AFTER Α-PARTICLE IRRADIATION OF HUMAN LUNG CANCER CELLS... 63
5.1 INTRODUCTION ... 63
5.2 MATERIALS &METHODS ... 65
5.2.1 Cells directly irradiated ... 65
5.2.2 Medium transfer study ... 65
5.2.3 Statistical analysis ... 67
5.3 RESULTS &DISCUSSION ... 67
5.3.1 Radiation-induced cellular effects immediately after irradiation ... 67
5.3.2 Radiation and bystander-induced cellular damage (2 and 6 days after irradiation) ... 69
5.3.2.1 Survival Fraction ... 69
5.3.2.2 Micronuclei frequency – Early cellular damage ... 73
CONTENTS xvii
5.3.2.4 Micronuclei distribution ... 75
5.4 CONCLUSIONS ... 77
CHAPTER 6 - INFLUENCE OF THE NUMBER OF IRRADIATED CELLS IN THE SPATIAL DISTRIBUTION OF BYSTANDER EFFECTS ... 81
6.1 INTRODUCTION ... 81
6.2 MATERIALS &METHODS ... 82
6.2.1 Cell culture and irradiation ... 82
6.2.2 Immunofluorescence staining ... 83
6.2.3 Treatment with Lindane or dimethyl sulfoxide ... 83
6.2.4 Statistical analysis ... 84
6.3 RESULTS ... 84
6.3.1 Induction of DSB in irradiated cells ... 84
6.3.2 Induction of DSB in bystander cells ... 87
6.3.2.1 Bystander I ... 89
6.3.2.1.1 Role of the gap-junctional intercellular communication (GJIC) ... 91
6.3.2.2 Bystander II ... 93
6.4 CONCLUSIONS ... 96
CHAPTER 7 - GENE-EXPRESSION IN DIRECTLY IRRADIATED AND BYSTANDER A549 CELLS AFTER EXPOSURE TO LOW DOSES OF α-RADIATION ... 99
7.1 INTRODUCTION ... 99
7.1.1 The RNA isolation and cDNA synthesis ... 103
7.1.2 Principle of the quantitative real-time PCR ... 105
7.2 MATERIALS &METHODS ... 108
7.2.2 Medium transfer technique... 108
7.2.3 RNA isolation and cDNA generation ... 108
7.2.4 Quantitative Real-Time PCR (qRT-PCR) ... 110
7.2.5 Statistical Analysis ... 110
7.3 RESULTS ... 110
7.3.1 Directly irradiated cells ... 111
7.3.2 Bystander cells ... 116
7.3.3 Directly irradiated and Bystander cells ... 121
7.3.3.1 GADD45A gene profile expression ... 121
7.3.3.2 BCL2A1 gene profile expression ... 122
7.4 DISCUSSION AND CONCLUSIONS ... 124
CHAPTER 8 - CONCLUSIONS AND FUTURE WORK ... 127
8.1 CONCLUSIONS ... 127
8.2 FUTURE WORK ... 131
BIBIOLOGRAPHY ... 133
RESEARCH PROTOCOLS ... 145
PROTOCOL I-CYTOKINESIS-BLOCKED MICRONUCLEI ASSAY ... 147
PROTOCOL II–γ –H2AXASSAY ... 149
PROTOCOL III–CLONOGENIC ASSAY ... 151
PROTOCOL IV-RNA ISOLATION ... 153
L
IST OF ACRONYMS
BSA - Bovine Serum Albumin
CBMA – Cytokinesis Blocked Micronuclei Assay cDNA – Complementary DeoxyriboNucleic Acid DDR – DNA Damage Response
DMEM – Dulbecco’s Modified Eagle Medium DNA – DeoxyriboNucleic Acid
DSB – Double Strand Break FBS – Fetal Bovine Serum
GJIC - Gap Junction-mediated Intercellular Communication HLEG – High Level and Expert Group
IR – Ionizing Radiation LET – Linear Energy Transfer LNT – Linear no-Threshold model
MCNPX – Monte Carlo N-Particle eXtended (simulation code) NF-kB – Nuclear Factor-kappa B
PBS – Phosphate-Buffered Saline PCR – Polymerase Chain Reaction PE - Plating Efficiency
RBE – Relative Biological Effectiveness RIBE – Radiation-induced bystander effects RNA – RiboNucleic Acid
ROS - Reactive Oxygen Species
RT-PCR – Real-Time Polymerase Chain Reaction SF – Survival Fraction
SRIM – The Stopping and Range of Ions in Matter (simulation code) SSB – Single Strand Break
L
IST OF FIGURES
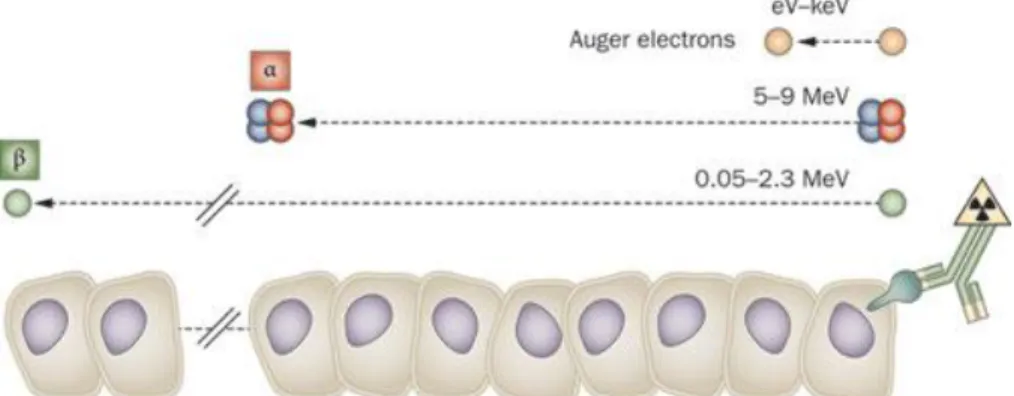
Figure 1: Indicative research directions to address issues on the shape of dose response relationship and tissue sensitivities for cancer [Report of HLEG, 2009]. ... 2 Figure 2: Gap junctions are hexameric hemichannels of connexin proteins that are inserted into the plasma membrane and allow for direct exchange of cytosolic contents among adjacent cells. [Extracted from Trauner and Jansen, 2003]... 5 Figure 3: The medium-transfer technique to study the bystander effects. First, the cells are irradiated, then the culture medium is removed and filtered and finally is added to a non-irradiated culture. ... 5 Figure 4: Track length of alpha-particles, beta-particles, and Auger electrons relative to the cell diameter. Extracted from [Pouget et al., 2011]. ... 10 Figure 5: The DNA molecule. Adapted from McGrawHill education website (https://catalogs.mhhe.com/mhhe/home.do) ... 14 Figure 6: Phases of the cell cycle ... 16 Figure 7: A view of the general outline of the DNA damage response pathway. DSBs are recognized by the MRN complex [Petrini and Stracker, 2003]. MRN recruits proteins of the phosphatidylinositol 3-kinase like preotein kinase (PIKKs) family – ATM, ATR that encode DSB-inducible protein kinases. The consequent cellular responses include cell cycle arrest, apoptosis and DSB repair. [Nagaria et al., 2013]. ... 17 Figure 8: Proposed model for an IR – induced signaling pathway... 18 Figure 9: Induction of DSBs by IR. At the end of radiation tracks, the energetic electrons deposit their energy raising multiple ionizations (clustering), which in turn induce complex DNA damage. The principal concern of ionization cluster is that IR interacts with the molecule of DNA at several locations, within the cell area. This interaction leads to i)
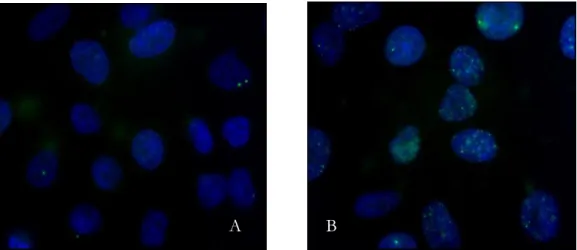
promptly DSBs when two SSB occur in DNA, ii) SSB after sugar lesions within clustered-damaged sites after chemical processing and iii) SSB after BER by leading breaks in DNA after replication. Figure extracted from Mladenov et al., 2011. ... 19 Figure 10: Schematic view of the micronucleus formation process. The upper process describes the normal cellular division, in which a cell divides into two separate daughter cells, each containing one nucleus. By adding cytochalasin B, an inhibitor of actins, the cell is blocked from the cell division after the completion of nuclear division. The resulting cell called a binucleated (BN) cell contains two nucleus. When a fragment of DNA is broken due to damage, one or more micronuclei (MN) appear within the binucleated cell. ... 21 Figure 11: Images obtained during the MN quantification performed in this work. (a) binucleated cell and (b) a binucleated cell with 2 micronuclei... 22 Figure 12: H2AX in the context of chromatin. (A) Organization of DNA in chromatin. (B) Schematic representation of the core histones (C) A model of the nucleosome core particle showing DNA interactions with core histones. The DNA entry and exit points are localized at the H2A/H2B dimer. [Extracted from Kinner et al., 2008] ... 23 Figure 13: γ-H2AX foci formation. Immediately after a DSB, the phosphorylated form of H2AX is formed γ-H2AX, being accumulated at sites of DNA DSB. If the DNA repair machinery is no efficient, the DNA does not repair and an accumulation of foci is observed in the nuclei. Figure adapted from: Efficient DNA Repair: A Cell’s Fountain of Youth? ... 24 Figure 14: Representative image of DSBs positive cells obtained in this work; non-irradiated (A) and irradiated cells with 100 mGy (B). ... 25 Figure 15: Clonogenic assay for cells growing in monolayer. Cells are trypsinized, counted, and diluted. The colonies are fixed and stained when they reach at least 50 cells each. ... 25 Figure 16: Cultures of colonies obtained during this work with clonogenic assay; (a) 0 mGy, (b) 5 mGy and (c) 100 mGy. ... 26 Figure 17: Direct and Indirect effects of IR in DNA. The creation of a OH- ion is depicted,
as an example of indirect effects... 30 Figure 18: Sequence of events after radiation energy absorption. ... 30
LIST OF FIGURES xxiii
Figure 19: Ionization event. If the energy transferred to an atom, due to coulomb forces exerted when a charged particle passes near the electric field generated by the atom’s electrons and protons, exceeds the electron’s energy binding, the result is an ion-pair (i.e. an ejected electron and a positively charged atom). If the energy of the ejected electron is sufficient enough, a secondary electron, named delta ray, could be produced. Thus, further ionizations are produced by secondary ionizations events. Figure extracted from [Bushberg et
al., 2012] ... 32
Figure 20: Excitation event (left), an electron (represented in green) is transferred to a higher energy level. De-excitation event (right), occurs when the electron returns to a lower energy level emitting either electromagnetic radiation or an Auger electron. Figure extracted from [Bushberg et al., 2012]. ... 33 Figure 21: Parameters for a charged particle (mass M, charge ze and velocity V) collision with an electron (mass m and charge –e) where a is the classical radius of the atom and b is the classical impact parameter. Adapted from Turner, 2007... 33 Figure 22: Annular cylinder of length dx. The cylinder’s axis is aligned with the trajectory of the heavy charged particle. Extracted from [Turner et al., 2007]. ... 35 Figure 23: Variation of relative biologic effectiveness (RBE) with linear energy transfer (LET) in tissue. It can be inferred that high-LET particles, such as α-particles, protons and neutrons, cause a higher damage to the crossing tissues. ... 40 Figure 24: Patterns of DNA damage caused by different types of radiation. a) Low-LET radiation produces sparse ionizations and excitations within DNA along a track, resulting in individual DNA lesions that are easily repairable. b) Cascades of Auger electrons (with intermediate LET). c) α-particles with high LET produce densely localized ionizations and excitations along a linear track, resulting in locally, and multiple damaged sites that are poorly repairable. Extracted from [Pouget et al., 2011] ... 41 Figure 25: Energy loss of an α-particle with 4 MeV of energy reaching a layer of air. Results obtained with SRIM, 2008. ... 41 Figure 26: The range of 3 and 6 MeV α-particles in air. Doubling the energy of the incident particles allow the particles to travel a higher distance in air. In this simulation, the range
differs by a factor of 3. Results obtained using the state-of-the-art computer program SRIM. ... 42 Figure 27: Irradiation device (up), cross – section of the exposure device (down). ... 45 Figure 28: Input file structure ... 48 Figure 29: Example of a particle´s trajectory in a cell. In this, the particle experiences a set of interactions, resulting in several tracks, before leaving the cell. The track length estimator tally scores a different value of energy for each track. The resulting energy, using the pulse height tally, is the accounting of all energies (entering and leaving the cells) involved, i.e., in this example, the resulting energy is equal to Ein1 + Ein2 – Eout1.At the end of history, the
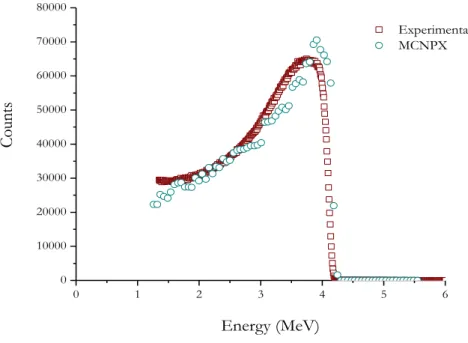
account in each cell is dividing by the source weight determining in which energy bin the score is put in. Adapted from [RSICC, 2006]. ... 52 Figure 30: Study of the LET as a function of incidence angles of the alpha particles in the cell monolayer. Note that, 0° of incidence means the beam is perpendicular to the target. ... 54 Figure 31: Schematic representation of the configuration used to model the response of the Si(Li) detector with MCNPX. All the components are cylindrical in shape. Dimensions are not to scale. ... 55 Figure 32: Comparison between the measured alpha-particles energy and the MCNPX simulation. ... 55 Figure 33: Results obtained by MCNPX for the dependence of LET values with the water monolayer depth. ... 56 Figure 34: Energy spectra of 232U and 210Po. The dash curve corresponds to the energy peaks
used to perform the calibration. The peak energies used in the calibration are the following:
212Po– 8.785 MeV, 216Po - 6.777 MeV, 220Rn - 6.287 MeV and 224Ra – 5.684 MeV ... 58
Figure 35 – Energy spectrum at cell position ... 59 Figure 36: Schematic view of the parameters included on the input file. ... 60 Figure 37: LET spectrum at cell position ... 60 Figure 38: Medium transfer study for 1 Gy of exposure; the same methodology was used for the others values of dose. In group I irradiated cells were cultured with fresh medium after
LIST OF FIGURES xxv
exposure to the aforementioned radiation doses. In group II, non-irradiated cells received irradiated medium. Finally, group III corresponds to irradiated cells cultured after centrifugation with supplemented fresh medium. ... 66 Figure 39: Dose response curve. Number of MN in 1000 BN cells (mean ± SEM) of 3 independent experiments. By analyzing the results, it can be summed up that there is a significant increase of MN per 1000 BN cells when the result of each dose is compared with the control (non-irradiated cells). This indicates that the cellular damage increase with dose values, as each MN represents a specific lesion. ... 68 Figure 40: MN distribution in BN cells. 1 MN, 2 MN, 3 MN and >3 MN means that BN cells contain one, two, three and more than three MN. The obtained results show that genetic lesion results essentially in BN cells with only one MN. As dose values increase, the frequency of 2 MN becomes more evident. By the appearance of more than one MN, one can predict that higher doses are more damaged to the cell. ... 68 Figure 41: Survival fraction (SF), obtained by clonogenic assay, for each group, i.e. I, II and III. The results represent the mean of three independent experiments ± standard error of the mean (SEM). Note: The lines are purely eye guided. ... 71 Figure 42: Survival fraction (SF), obtained by clonogenic assay, at day 2 (a) and at day 6 (b). The results represent the mean of three independent experiments ± standard error of the mean (SEM). At both time points and for all groups, survival is significantly reduced compared to its own controls. The only exception is observed for Group III at day 2, at 10 mGy, being the survival fraction similar to unirradiated control (p=0.84). In the media transfer experiment, group II a lower survival fraction is observed at 10 mGy, which corroborates with the HRS observed, by means of MN assay, at this dose value. Note: The lines are purely eye guided. ... 72 Figure 43: Number of MN per 1000 BN cells for each value of dose; 5, 10 50, 100, 500 and 1000 mGy at day 2 after irradiation for groups I to III. The non-irradiated cell cultures are marked as 0 mGy. Data represent means of 3 independent experiments, ± SEM. Note: the lines are purely eye guided. ... 73 Figure 44: Number of MN, 6 days after irradiation for groups I to III, per 1000 BN cells for each value of dose, i.e., 5, 10, 50, 100, 500 and 1000 mGy (a). (b) refers to a detailed view for
lower doses. The non-irradiated cell cultures are marked as 0 mGy. Data represent means of 3 independent experiments, ± SEM. In all groups, radiation significantly increased the number of MN when compared with its own controls (p<0.05), with exception in group III for 5 mGy where the increasing of MN was almost the same (p=0.68). Similarly to earlier effects, the trend to reach a plateau after 10 mGy for group II is observed. Note: the lines are purely eye guided. ... 74 Figure 45: Schematic view of the culture dish for irradiation. The dimensions are in cm and not at scale. The cell dish has 3.5 cm of diameter and depending on the experiment (A) or (B); approximately, 98 or 92% of this area was shielded by aluminum foils, respectively. The unshielded area was exposed to 5, 10, 50 and 100 mGy of α–particles emitted by a 210Po
source. Immediately after-irradiation the γ-H2AX assay was performed. ... 83 Figure 46: Induction of DSBs in irradiated cells, by means of foci number, after 5, 10, 50 and 100 mGy of α-radiation. Data were collected from three independent experiments. Error bars represents the SEM. The statistical significance between each dose value, for both irradiated area A and B, and matched controls, i.e. 0 mGy, is p<0.005. ... 85 Figure 47: Distribution of foci number per cell for all dose values; left and right panels show the distribution of foci number in the irradiated areas – A and B, respectively. The histograms show cells presenting 0 to 45 γ-H2AX foci per nucleus. Data were collected from three independent experiments. Different scales were used for a better visualization. ... 86 Figure 48: Average number of foci per cell in the experiment A (up) and B (down) with a lower and a higher number of irradiated cells, respectively. Irradiated area – A and irradiated area B refers to the irradiated areas, Bystander I – A and Bystander I - B, the closest to the irradiated cells, refers to the first non-irradiated area and bystander II – A and Bystander II - B to the second non-irradiated area. Data were collected from three independent experiments. Error bars represents the SEM. Note: The lines are purely to guide the eye. ... 87 Figure 49: Induction of DSBs in the “Bbystander I-A” and “Bystander I-B” areas corresponding to non-irradiated cells in the areas nearest to the irradiated cells, in case of a lower and a higher number of irradiated cells, respectively. Data were collected from three independent experiments. Error bars represents the SEM. * p< 0.005 represents the statistically significance between each group and its own controls. ... 89
LIST OF FIGURES xxvii
Figure 50: Distribution of foci number per cell for all dose values; left and right panels show the distribution of foci number in the Bystander I areas – A and B, respectively. The histograms show cells presenting 0 to 45 γ-H2AX foci per nucleus. Data were collected from three independent experiments. Different scales were used for a better visualization. ... 90 Figure 51: Average number of foci per cell of bystander cells with or without treatment with Lindane or DMSO. The data are plotted with the averaged values ± SEM of three independent experiments. * p< 0.005, ** p<0.02, *** p<0.01, + p<0.1 and ++ p<0.05
represents the statistically significance between each group and its own controls The statistical analysis, per dose value, of the data obtained for the three independent treatments was performed by ANOVA analysis. ... 92 Figure 52: Induction of DSBs in the “Bystander II-A” and “Bystander II-B” areas, corresponding to non-irradiated cells in the areas more distant of the irradiated cells, in case of a lower (experiment A) and a higher number (experiment B) of irradiated cells, respectively. Data were collected from three independent experiments. Error bars represents the SEM and * p< 0.005. ... 93 Figure 53: Distribution of foci number per cell for all dose values; left and right panels show the distribution of foci number in the Bystander II areas – A and B, respectively. The histograms show cells presenting 0 to 45 γ-H2AX foci per nucleus. Data were collected from three independent experiments. Different scales were used for a better visualization. ... 94 Figure 54: Induction of DSBs in “Bystander II – A” and “Bystander III – B” areas. “Bystander II – A” and “Bystander III – B” refers to non-irradiated cells, corresponding to a lower and a higher number of irradiated cells, respectively, but at the same distance from the irradiated cells. Data were collected from three independent experiments. Error bars represents the SEM and * p< 0.005. ... 95 Figure 55: Cross-talking between apoptosis and NF-kB signaling. Figure extracted from Sun and Karin [Sun and Karin, 2008]. ... 101 Figure 56: The intrinsic and extrinsic pathways in apoptosis. Apoptosis can be induced by cell surface receptors, extrinsic pathway, such as FAS and TNFR1 and by intrinsic pathway due to the exposure to various stress stimuli. Stress stimuli that induce apoptosis include
DNA damage by IR, aberrant signals from cell surface receptors and production of ROS, among others. Figure extracted from Youle [Youle et al., 2008]. ... 102 Figure 57: A schematic view of cDNA synthesis. (a) RNA template. Before the synthesis of cDNA, total or mRNA must be extracted from the biological sample. (b) To generate cDNA molecule by an enzyme reverse transcriptase (RT), a primer must be annealed to the template of RNA. This is the starting point for DNA synthesis. (c) The action of the enzyme RT beginning at the primer annealing site. (d) the first cDNA strand created. (e) Removal of RNA by RNAse H. After this step, the single-stranded cDNA is ready to be used for amplification by PCR. Figure adapted from Kendall and Riley [Kendall and Riley, 2000]. .. 104 Figure 58: The 3 steps of PCR; denaturation, annealing and extension. ... 106 Figure 59: Model of a single-sample amplification plot, showing parameters used to a quantitative analysis.. Normalized reporter (Rn) is the ratio of the fluorescence emitted by the reporter dye and the passive reference dye. ΔRn is calculated by subtracting the baseline line value to the Rn values. All PCR measurements should have a No Template Control (NTC), without cDNA template, in order to verify the amplification quality. Figure extracted from: http://www.ncbi.nlm.nih.gov/projects/genome/probe/doc/TechQPCR.shtml ... 107 Figure 60: Medium transfer study for an exposure of 100 mGy; the same methodology was used for the others dose values. In group I irradiated cells were cultured with fresh medium after exposure to the aforementioned radiation doses. In group II, non-irradiated cells received irradiated medium. ... 108 Figure 61: Illustration of the cDNA protocol. ... 109 Figure 62: Relative gene expression levels after direct radiation. Quantitative real-time RT-PCR was used to quantify the expression of the GADD45A and BCL2A1 genes 4h after irradiation of A549 cells. Gene expression was normalized to GAPDH and is relative to the expression of 0 mGy. The presented data corresponds to the mean and the standard deviation of two independent experiences. The p-values represent the statistical analysis between each dose values and the control, i.e. 0 mGy. ... 115 Figure 63: Relative gene expression levels for bystander cells. Quantitative real-time RT-PCR was used to quantify the expression of GADD45A and BCL2A1 genes 4h after irradiation of A549 cells. Gene expression was normalized to GAPDH and is relative to the expression of
LIST OF FIGURES xxix
0 mGy. The presented data is the mean and the standard deviation of two independent experiences. The p-values represent the statistical analysis between each dose values and the control, i.e. 0 mGy. ... 120 Figure 64: Relative gene expression of GADD45A in directly irradiated and bystander cells, 4h after irradiation of A549 cells for different dose values. The gene expression was normalized to GAPDH and is relative to the expression of 0 mGy. The data displayed corresponds to the mean and the standard deviation of two independent experiences. ... 122 Figure 65: Relative gene expression of BCL2A1 in directly irradiated and bystander cells, 4h after irradiation of A549 cells. The gene expression was normalized to GAPDH and is relative to the expression of 0 mGy. The data displayed corresponds to the mean and the standard deviation of two independent experiences ... 123 Figure 66: Different effects that can be observable when a single cell is irradiated. ... 128
L
IST OF TABLES
Table 1: DNA structural modifications caused by a genotoxic agent (physical or chemical). 15 Table 2 – Type of tallies that can be used in MCNPX. ... 51 Table 3: Values of SF, obtained by clonogenic assay, at day 2 after irradiation. The results represent the mean of three independent experiments ± standard error of the mean (SEM). ... 70 Table 4: Values of SF, obtained by clonogenic assay, at day 6 after irradiation. The results represent the mean of three independent experiments ± standard error of the mean (SEM). ... 70 Table 5: The distribution and yield of MN in the aforementioned groups and dose values, 2 days after irradiation ... 75 Table 6: The distribution and yield of MN in the aforementioned groups and dose values, 6 days after irradiation. ... 76 Table 7: PCR reaction volume. ... 110 Table 8: Ct values for the 1st independent experience. Using the GAPDH as the endogenous
control, the 2-δCt values were obtained for both genes, GADD45A and BCL2A1, for
different dose values. ... 112 Table 9: Ct values for the 2nd independent experience. Using the GAPDH as the endogenous
control, the 2-δCt values were obtained for both genes, GADD45A and BCL2A1, for
different dose values. ... 113 Table 10: Ct values for the 3rd independent experience. Using the GAPDH as the
endogenous control, the 2-δCt values were obtained for both genes, GADD45A and BCL2A1,
Table 11: Values of 2- δCt for both genes, considered for further studies, after take out the
outliers. ... 115 Table 12: Ct values for the 1st independent experience. Using the GAPDH as the
endogenous control, the 2-δCt values were obtained for both genes, GADD45A and BCL2A1,
for different dose values, for bystander cells. ... 117 Table 13: : Ct values for the 2nd independent experience. Using the GAPDH as the
endogenous control, the 2-ΔΔCt values were obtained to both genes, GADD45A and
BCL2A1, at different dose values, for bystander cells. ... 118 Table 14: Ct values for the 3rd independent experience. Using the GAPDH as the
endogenous control, the 2-δCt values were obtained for both genes, GADD45A and BCL2A1,
for different dose values, for bystander cells. ... 119 Table 15: Values of 2- δCt for both genes, considered for further studies, after take out the
outliers. ... 120 Table 16: Required volume of Lysis buffer (Extracted from the PureLink® RNA Mini Kit
manual) ... 153 Table 17: Volume required per reaction of each components. * Quantity Sufficient ... 155
C
HAPTER
1
I
NTRODUCTION
1.1 The motivation – study of the biological effects of ionizing radiation
Understanding the mechanisms of interaction of ionizing radiation (IR) with biological systems has been driven by two main factors: the need to assess the risks and detrimental effects for human health from accidental, anthropogenic (in medical and industrial, lifestyle, etc. applications) or natural exposures to IR and the IR´s role as a carcinogen. No one questions the lethality of excessive exposure to ionizing radiation or the carcinogenic effects of high doses of radiation, but a detailed and accurate understanding of the mechanisms explaining the way how these effects are mediated remains unclear. Of particular relevance, in low doses radiation exposures the understandings of the mechanisms that lead to biological effects are not clearly understood [Little, 2010]. Recently, an European High Level and Expert Group (HLEG) [Report of HLEG, 2009] was established in order to define research topics and programs paving the way for a more accurate risk assessment in low doseradiation exposures. In this report, it can be read that, during the last decades, a decline in the available expertise on radiobiology and radiotoxicology was observed [Report of HLEG, 2009]. The major concerns to this group are the considerable uncertainties and divergent views about the health effects arising from low dose radiation exposures.
The complexity of the triggered biological responses after low dose exposures shifts the prediction of radiation risk assessment models to a long-term goal. Figure 1 shows the
strategy of the HLEG to assess the shape of dose-response relationships and tissue sensitivity in the case of cancer.
Figure 1: Indicative research directions to address issues on the shape of dose response relationship and tissue
sensitivities for cancer [Report of HLEG, 2009].
Besides the influence of the tissue variability on the dose response, other issues are addressed in the report namely the individual variability and sensitivity (as a function of age, sex, gender, genetic factors, etc.), the radiation quality, internal exposures, and non-cancer effects.
One of the most common approaches to model risk versus dose is the linear no-threshold (LNT) model [Tubiana et al., 2006; Brenner and Sachs 2010]. Its epidemiological basis makes it the current approach for the establishment of an “anchor point”, which is subsequently used for linear extrapolation to the low dose range. However, the epidemiological data, mainly from accidental exposures with doses in the range of 0.2 to 2.5 Sv, are much higher when compared with the worldwide annual exposures to natural radiation sources estimated in the range of 1 to 10 mSv/year, with 2.4 mSv being at present the estimated world average dose [UNSCEAR, 2000]. For this reason it is currently accepted that this LNT model must be revised, due to the uncertainty on the shape of the risk versus dose- relationship (derived from epidemiological studies) below 100 mGy and on the cellular mechanisms that determine the response, including the role of bystander effects and radiation sensitivity.
CHAPTER I-INTRODUCTION 3
Bearing in mind all the uncertainties in the low dose range, considering the cellular response, and assuming that these dose values could have a pivotal impact in the human health, the main focus of the work developed in this thesis was devoted to the study of the direct and bystander effects induced by absorbed doses lower than 100 mGy.
The radiation-induced bystander effect (RIBE) has been described as an occurrence of a biological effect in non-irradiated cells as a result of exposure of other cells to IR [Shao et al., 2004, Suzuki et al., 2004, Sawant et al., 2001]. The major consequences of these effects on the evaluation of low dose risks are addressed to some questions, for which current scientific knowledge has no answers: i) what is the nature of the bystander signals emitted to unexposed cells, ii) could the dose absorbed by tissues be higher than we thought? iii) is there a threshold for these bystander effects to occur? and iv) could these bystander effects be manipulated to increase the death of tumor cells?.
1.2 The bystander effects
The major adverse consequences of radiation exposures are attributed to DNA damage in irradiated cells that have not been correctly restored by metabolic repair processes. However, this has been challenged by observations in which effects of ionizing radiation arise in non-irradiated cells [Shao et al., 2004, Suzuki et al., 2004, Sawant et al., 2001].
These, so called, bystander effects are demonstrated by cell culture medium transfer [Grifalconi et al., 2007, Mothersill et al., 2001 and Mothersill et al., 1998] or in cells that have communicated with irradiated cells [Azzam et al., 2003 and Hu et al., 2006]. Although, several studies show the existence of RIBE the understanding of the mechanisms that lead to these biological effects are not yet understood. It is most likely that multiple mechanisms are involved in bystander effects. The majority of the published studies focused in in vitro studies concentrated on the factors released by the irradiated cells that will trigger a cellular damage in the recipient cells. There are few published studies in vivo bystander effects but the complexity of the chain of events is such that it is very difficult to point a cause-effect relationship. So, it is easier to design an experiment with cells in vitro and conclude about the obtained results more accurately. However, this is a limitation, since it does not express the whole body response but only an isolated response of a specific cell line to a specific dose value. It must be recognized however that the results in vitro are the precursory results for possible effects that could occur in vivo.
The major adverse consequence observed in non-irradiated cells, bystander cells, is attributed to the oxidative stress effect induced by reactive oxygen species (ROS) [Azzam et al., 2003]. Additionally, some studies showed that irradiated cells may release soluble factors which are toxic to non-irradiated cells into the medium [Yang et al., 2005]. Differences in DNA damage quantification, among various cell types, can be explained by the different metabolic repair processes, suggesting a fundamental role of the DNA in inducing bystander effects [Nagasawa et al., 2003]. Grifalconi et al. (2007) demonstrated that TK6 cells, when exposed to
0.5 – 1 Gy of γ-rays, release into the cell culture medium soluble molecules which maintain cell mortality high in bystander cells for at least 48h. Other study performed by Bowler et al. (2006) showed the appearance of delayed aberrations (genomic instability) induced by medium transfer technique in bystander culture, for irradiation doses ranging from 0.1 to 2 Gy. Evidences of these effects in different cell lines have been reported within a few hours post-irradiation as increasing micronuclei formation [Saho et al., 2004, and Belchior et al., 2011] and chromatid aberrations [Suzuki et al., 2004] and at delayed times after irradiation as increased mutation frequency [Nagasawa et al., 1999 and Dahle et al., 2005], delayed reproductive cell death, or chromosomal instability [Hall et al., 2003].
Summarizing, the published studies about bystander effects lead us to verify that; o the bystander effect is dependent on the cell line used,
o the bystander effect is quantified using the same biomarkers of directly irradiated cells,
o the bystander effects could lead to cell death, implying a severe damage to the cell,
o the bystander effects are more relevant at low doses and have the highest expression at 0.5 Gy being insignificant for high dose values,
o the bystander effects were observed even if only a single cell was irradiated (using a microbeam),
o the bystander effects are observable by cellular medium transfer to non-irradiated cells or by gap-junctional intercellular communication and finally,
o the bystander signals appear to be a consequence of the reactive oxygen species released in the culture medium and of growth factors leading to different proteins regulation.
1.2.1 Gap-junction intercelular communication
Cells can communicate with each other through the gap junction-mediated intercellular communication (GJIC) (see
Figure 2). Connexin proteins, which make up the gap junctions, pass ions and small metabolites between cells that are in contact (like confluent cells). The role of GJIC was first reported by Azzam et al. [Azzam et al., 1998] who investigated the response of confluent cultures of primary human diploid fibroblast exposed to very low fluences of alpha-particles. They observed an increase in the protein levels p53 and p21, a protein involved in cell cycle checkpoint signaling.
CHAPTER I-INTRODUCTION 5
Figure 2: Gap junctions are hexameric hemichannels of connexin proteins that are inserted into the plasma
membrane and allow for direct exchange of cytosolic contents among adjacent cells. [Extracted from Trauner and Jansen, 2003]
In this thesis, the role of GJIC was studied in the areas closest to irradiation cells, described in chapter 6.
1.2.2 Medium transfer technique
In addition to intercellular communication, bystander effects can be observed by the
medium-transfer technique. When using this technique, cells are irradiated, and the medium from irradiated cells is removed and filtered, being afterwards added to a culture of non-irradiated cells, and finally the bystander effects are assayed (see
Figure 3).
a-radiation
The culture medium is removed and filtered by a
membrane of 0.22 mm
Added to the unirradiated culture
Figure 3: The medium-transfer technique to study the bystander effects. First, the cells are irradiated, then the
1.3 The studies undertaken
The following sub-sections describe the proposed radiobiology studies in order to contribute with some additional data for the better understanding of the bystander effects induced by low-dose values. However, although not described in the sequence, an extensive dosimetric study was performed in order to evaluate the dose delivered in the cellular monolayer. For that, a set of measurements and simulation studies were developed and are described in chapter 4.
1.3.1 Dose and time dependence of targeted and untargeted effects
From the literature, it is believed that different biological responses, induced by radiation exposure, are triggered for each cell type. The same trend is observed for RIBE, in other words, different biological effects, in non-directly irradiated cells, are observed depending on cell type.
This first study is focused on the evaluation, for the first time, of the bystander effects induced in the A549 cell line (described in the sequence - section 1.4) exposed to low doses of α-particle radiation.
The proposed work contributes the better understanding of the dose and time dependence, with respect to the uncertainty of the cellular response to radiation. The matrix of experiments used in this study allowed addressing some relevant questions, such as:
o Does low dose α-particle radiation induce cellular damage in the cell line A549, in both directly irradiated and bystander cells?
o Does the cellular damage induced in directly irradiated and bystander cells persist in time? o What is the shape of the dose-response curve at this range of doses, i.e. < 100 mGy?
The dose dependence study aims at understanding the behavior of the dose response curve in the low dose range. This is important not only to verify the linearity (or non-linearity) of the dose response, but also to study one important topic associated with low doses exposure; the hyper-radiosensitivity. Low dose hyper-radiosensitivity (HRS) is characterized by an increasing sensitivity to low doses of radiation. Consequently, it could represent either a higher risk to the health, by low-dose exposures, or an important applicability on radiation-treatments. In relation to the low-dose risk assessment, the hyper-radiosensitivity is one of the driving forces of the studies performed nowadays. One of the most important outcomes related with this phenomenon is the non-linearity of the dose-response curve. On the other hand, the hyper-radiosensitivity effect may have an important application in radiation-treatments. A higher cellular sensitivity at low doses may imply an increasing cell death, which in turn could be used to decrease the overall dose on the radiation-treatments.
CHAPTER I-INTRODUCTION 7
The time dependence study aims at evaluating, after verifying that the cellular lesion exists, if the damage persists on time, i.e. the genomic instability. RIBE is characterized by the appearance of delayed effects in the progeny of irradiated cells, including delayed chromosomal aberrations and gene mutations, reduced plating efficiency and delayed cell death. The RIBE assumes high importance at low doses, because its contribution for the overall damage imparted by radiation in cells (and tissues) must be taken into account. On one hand, this effect could be used in order to increase the cell death or, in the opposite site, must be quantified to understand for how long after an exposure the damage induced must be quantified. In terms of bystander effects, the genomic instability, if expressed, confers the importance of these effects in terms of low-dose risk assessment.
1.3.2 Does the number of irradiated cells affect the spatial distribution of bystander effects?
The studies undertaken in this section, aim at assessing, (after the study of bystander effects in the A549 cell line), how the number of irradiated cells influences the spatial distribution of the bystander effects. In particular, the work presented in this section shows the cellular damage quantification in the unexposed areas surrounding the irradiated ones, by using an in
situ technique.
The presented in this section work tries to help answering the following questions:
o Does the number of irradiated cells affect the bystander response? o How far could the bystander signals be propagated within the cell culture?
o Can the number of irradiated cells be related with the propagation of these signals?
Data obtained in this work is very important. In terms of low-dose risk assessment what we know is that the observed bystander effects raise doubts about the deterministic “hit-model” due to the existence of cellular damage in not-directly exposed cells. Moreover, some studies, including ours, show that the bystander effects can spread easily in the culture medium. The impact of this in terms of low-dose risk assessment is huge. Because it pinpoints that, not only the local closest to the irradiated area is affected by radiation, but also the surrounding areas more distant from the local of irradiation. One of the main outcomes of this study is to understand how far in the cellular culture the damage can be quantified. These findings have a key impact not only in terms of radiological protection but also in radiation-treatments. Moreover, other important issue related to bystander effects is their relation (or dependence) with the number of irradiated cells. So far, the studies available in the literature establish that some signals are emitted from irradiated cells to non-irradiated ones, inducing damage in the last ones, but no information is available about the type, origin or nature of such signals. Our
study, although does not disclose the nature of these signals, allows however to assess their impact on the areas surrounding the irradiated ones. Knowing the influence of the number of irradiated cells, i.e. of the number of signals transmitted, on distribution of the bystander effects is of paramount importance in order to understand the real impact of the bystander effects on the low-dose risk assessment. As an example, it is known that the inhalation of Radon gas causes the energy deposition of radiation-particles in lung epithelial cells and this exposure translates into a certain risk. From what we know, until now, this risk will increase with the number of deposited particles. However, this increased risk may not be linear, because, from the literature [Balásházy et al., 2002] it is known that the deposition of particles in inhomogeneous, created hot-spots in certain regions of the bronchial tree structure. 1.3.3 Bystander effects and gene expression
It has been established that signals from irradiated cells travel through culture medium and GJIC to produce changes in gene expression [Zhou et al., 2005 and Ghandi Hi et al., 2008]. Some authors [Mothersill and Seymour, 1998a; Wolff, 1998; Joiner et al., 2001; Amundson et
al., 2001] claim that additionally to the observation of DNA repair mechanisms, cellular
death and/or bystander effects, several others factors, such as genomic instability, adaptive response, low-dose hyper-radiosensitivity, delayed reproductive death and the induction of genes by radiation effects, have challenged what we know about the radiation induced cellular damage.
Ghandi [Ghandi et al., 2008] and Chauhan [Chauhan et al, 2012] showed, in a global gene expression, that a peak of gene expression is observed at four hours after exposure. For this reason, in this study the measurement of gene expression of directly and bystander cells was performed 4 hours after irradiation.
Apoptosis is a form of programmed cell death that occurs in multicellular organisms being crucial for tissue homeostasis. This mechanism is a main contributor for the intricacy of cellular response at low doses. Bearing this in mind, the study described in chapter 7 addresses and tries to answer the following questions:
o Do A549 cells show an apoptosis mechanism when exposed to low doses of α-radiation? o If it occurs, is the apoptosis response the same in both directly irradiated and bystander
cells?
o Do A549 cells express the same cellular damage response in directly and bystander cells, followed by a set of dose values lower than 500 mGy?
CHAPTER I-INTRODUCTION 9
1.4 The cell line
Human lung adenocarcinoma cells, A549 cell line (kindly provided by University of Porto, Portugal), were chosen as the epithelial cells which respond directly to the toxic agents that are inhaled in the air [Fujii et al., 2001]. Some of the deleterious effects induced in these cells include changes in cell morphology [Bayram et al., 1998], release of inflammatory cytokines [Ohtoshi et al., 1998] and alterations in cellular functions [Stringer and Kobzik 1998]. Since, α-particles were the radiation type used in this work; the epithelial cells are of extreme relevance to evaluate the cellular damage and survival induced at low doses, namely due to natural sources exposures.
1.5 The α-radiation source
Alpha-particles, discovered in 1899 by Ernest Rutherford, are identical to a helium nucleus having two protons and two neutrons. An α-particle is a heavy-charged particle, with a positive charge of +2 from its two protons. Alpha emitting atoms are usually large atoms, i.e. they have high atomic numbers.
There are many α-emitting radioactive elements, either natural or man-made. Some examples of α-emitters include Americium-241, Plutonium-236, Uranium-238, Thorium-232, Raon-222, Polonium-210, among others. Because experiments using α-particles allow obtaining important insights to assess the human-risk resulting from radiation exposure, irradiation devices using some of the aforementioned α-emitters were developed (described in Chapter 4 of this dissertation).
As a doubly charged particle travels through matter alpha-particles deposit energy mostly by excitations and ionizations of atoms. The term LET (acronym for Lineal Energy Transfer) is used to define the amount of energy transferred by these process per unit distance in units of keV/μm. In terms of cellular damage induced by ionizing radiation, the existing difference in LET values among the different radiation types is crucial. High-LET radiation is characterized by causing higher damage to the cells when compared to a Low-LET radiation. This is because high-LET radiation, heavy charged particles, will impart a large portion of their energy in a single electronic collision. Unlike high-LET radiation, low-LET radiation, as photons and electrons, will have a longer path in matter loosing energy continuously.
Figure 4: Track length of alpha-particles, beta-particles, and Auger electrons relative to the cell diameter. Extracted from [Pouget et al., 2011].
Over the last years, α-particle exposures, associated with occupational exposure (referring to the radiation exposure incurred by a worker) and public exposure has become a prominent public health concern [Wakeford, 2009].
One of the major concerns about the human exposure to natural radiation sources is associated to the radon gas. Most 222Rn gas inhaled is immediately exhaled. However if decay
occurs the particles would be deposited onto bronchial epithelial cells. According to the National Research Council (1999) the high density of ionizations than can occur along the path length of α-particles could deliver localized energy of about 10 – 50 cGy. Increasing evidence for a positive correlation between the inhalation of this gas and the development of lung cancer [Darby et al., 2001 and Darby et al., 2005] is the driving force for several ongoing studies.
In this thesis, the α-particle emitter used was the Po-210. To perform the experimental cellular irradiations we used the device developed by Szabo [Szabó et al., 2002], which is described in detailed in section 4.2.1. It must be highlighted that the irradiation device and the α-sources used in this work were kindly provided by Doctor Imre Balashazy from the Hungarian Academy of Sciences.
CHAPTER I-INTRODUCTION 11
1.6 Organization
This thesis is organized in 8 chapters. Each chapter can be, in short, summarized as follows: Chapter 1: Introduction. This chapter describes the motivation for this thesis, the bystander effects and the proposed studies. Moreover, in this, the cell line and the in vitro α-particle irradiator is briefly described.
Chapter 2: Biomarkers of radiation exposure and effects. This chapter describes the cellular damage that could be induced by high-LET radiation, and how it can be quantified. The effects observable in the DNA helix are described for directly irradiated and bystander cells. Additionally, it is also performed a description of the cytogenetic assays, used to quantify the cellular damage imparted by α-radiation.
Chapter 3: Interaction of heavy-charged particles with matter. In this chapter, a brief description is made on the energy loss mechanisms for charged particles. Additionally, a special description is provided about the slowing down of charged particles in matter and the concepts use to describe and quantify their effects, namely the linear-energy transfer (LET) and the relative biological effectiveness (RBE).
Chapter 4: Dosimetry of an α-particle device for in vitro cells irradiation. This chapter describes the full study regarding the dose rate calculation at the cellular monolayer. Both experimental and simulation procedures and methodologies used are described with great detail, including the simulation codes, SRIM and MCNPX, used in this work. A general discussion of the results obtained is also performed.
The work presented in this chapter was published in the International journal of low radiation [Belchior et al., 2010].
Chapter 5: Dose and time dependence of targeted and untargeted effects after α-particle irradiation of human lung cancer cells. In this chapter, the quantification of cellular damage, and its dose and time dependence, is described in both directly irradiated cells and bystander cells. The medium transfer study, methodology used to quantify the bystander effects, is detailed and the results obtained are extensively presented. Moreover, it is presented a general discussion of the results obtained.
The work presented in this chapter was published in Radiation Measurements [Belchior et al., 2011] and Dose Response journals [Belchior et al., 2013].
Chapter 6: Does the number of irradiated cells influence the spatial distribution of bystander effects? In this chapter the study on the spatial distribution of bystander signals through the cellular culture and its dependence with the number of irradiated cells is presented. In this, the γ-H2AX assay is described as the methodology used to perform the
quantification of cellular damage. Additionally, a discussion of the results obtained within this work is presented.
The work presented in this chapter was submitted to the Dose Response journal.
Chapter 7: Gene expression in directly and bystander A549 cells after low doses of α-radiation. This chapter presents a study of gene expression levels of GADD45A and BCL2A1 genes in both directly irradiated and bystander cells after 4h of exposure to several doses of α-radiation.
Chapter 8: Conclusions and future work. This chapter presents a set of conclusions extracted from the results obtained in this thesis, points the way to future research, and lists the set of publications produced during the PhD.
![Figure 1: Indicative research directions to address issues on the shape of dose response relationship and tissue sensitivities for cancer [Report of HLEG, 2009]](https://thumb-eu.123doks.com/thumbv2/123dok_br/18561156.906666/36.918.165.760.261.572/figure-indicative-research-directions-address-response-relationship-sensitivities.webp)