of Chemical
Engineering
ISSN 0104-6632 Printed in Brazil www.scielo.br/bjce
Vol. 35, No. 02, pp. 289 - 298, April - June, 2018 dx.doi.org/10.1590/0104-6632.20180352s20160275
N-ACETYLCYSTEINE MICRONIZATION BY THE
SEDS TECHNIQUE USING SUPERCRITICAL CO
2
Gean Pablo S. Aguiar
1, Lorenzo M. P. C. Chaves
1, Daiane L. Boschetto
1,
Angelo L. Piato
2, J. Vladimir Oliveira
1and Marcelo Lanza
1,*
1Department of Chemical and Food Engineering, UFSC, Florianópolis, SC, Brazil.
2Department of Pharmacology, ICBS, UFRGS, Porto Alegre, Brazil.
(Submitted: April 29, 2016; Revised: October 7, 2016; Accepted: November 24, 2016)
Abstract - N-Acetylcysteine (NAC) is a thiol (-SH) with a strong antioxidant activity. This compound has
demonstrated positive effects on chronic kidney disease, cancer, pulmonary insufficiency and other diseases. The aim of this work was to investigate the application of the Solution Enhanced Dispersion by Supercritical
Fluids (SEDS) technique in the micronization of NAC using a 23 Central Composite Design (CCD) with 3 central
points, as well as to assess the influence of active compound concentration, temperature and pressure on the particle size produced. The average size of the drug before SEDS processing was verified to be 709.82 µm while the best result led to a particle size of 2.86 µm, which means a reduction of about 248 fold. It was also observed
that a reduction in particle size led to an increase in the dissolution rate with 100% dissolution. Keywords: CO2; Supercritical fluid; NAC; SEDS.
INTRODUCTION
The micronization process is characterized by the reduction of the average particle size for the purpose of providing changes in physical structure (Chau et al., 2007). There are numerous advantages for redu-cing the size of pharmaceutical compounds, amongst them an increase in the dissolution rate and increased
bioavailability. The use of supercritical fluid tech -niques in the micronization process, compared with conventional techniques, presents many advantages,
such as low solvent use, ability to work with thermo -sensitive compounds, low concentration of residual solvent and others (He et al., 2004).
Chemically, N-acetylcysteine (NAC) is a thiol with a potent antioxidant activity. NAC showed
effects in numerous conditions (Cazzola et al., 2015;
Andrade et al., 2015; Elbini Dhouib et al., 2016) and, in recent years, there are a growing number of studies
that show the benefits of N-acetylcysteine (NAC) in a wide range of neuropsychiatric disorders (Berk et al., 2013, Berk et al., 2014; Deepmala et al., 2015;
Rosenblat et al., 2016). However, NAC has a low bio-availability through oral administration, about 10%. After an oral dose, most of the NAC is metabolized into other compounds, such as cysteine and inorganic sulphite (Kelly, 1998).
* Corresponding author: +55 (48) 37212528; Fax: +55 (48) 37219687. E-mail address: [email protected]
The oral absorption of drugs can be improved by increasing the dissolution rate of the drug, by increa-sing their surface area or by enhancing the saturation
solubility. The first point can be reached by microni -zation; however, for most drugs this procedure is not
usually sufficient because even after the microniza -tion process there is no increase in the dissolu-tion ra-te. However, when the micronized compound has an increased dissolution rate, it favors the drug to reach therapeutic plasma levels, thereby increasing the bioa-vailability (Durán et al., 2010).
Considering the potential therapeutic use of NAC,
the goal of this work was to investigate the application of solution enhanced dispersion of supercritical fluids
(SEDS) micronization to reduce the particle size,
in-crease the specific surface contact area and enhance
its solubility, consequently improving the compound bioavailability.
MATERIALS AND METHODS
Materials
N-acetylcysteine, with a purity of 99.2%, was purchased from Iberoquímica Magistral Laboratory (Jundiaí/SP). Dichloromethane (DCM 99.5%) and acetone (99.5%) were purchased from Vetec (Sigma-Aldrich) and carbon dioxide (99.9% in liquid phase) was provided by White Martins S.A.
Solution Enhanced Dispersion by Supercritical Fluids Technique (SEDS)
A schematic diagram of the experimental appara-tus is presented in Figure 1. The SEDS experimental apparatus and procedure used for the micronization of the pure compound, N-acetylcysteine, employing su-percritical CO2 as anti-solvent is described in detail by Franceschi et al. (2008).
Experimental conditions for precipitation and coprecipitation
For the micronization of N-acetylcysteine the following process parameters were adopted based
on previous works of the group: solute concentration of 4, 12 and 20 mg∙mL-1, at 35, 40 and 45 °C, solu-tion flow rate of 1 mL∙min-1, antisolvent flow rate of 20 mL∙min-1 (20MPa, 5 °C with resulting density of 1.0007 g∙mL-1) and operating pressure of 8, 10 and
12 MPa (Franceschi et al., 2008; Priamo et al., 2010; Boschetto et al., 2013; Machado Jr et al., 2014). In this
work, solute solubilization was improved by a mixture
of 40% (v/v) acetone + 60% (v/v) dichloromethane. As mentioned, a 23 Central Composite Design (CCD)
with triplicate runs at the central point (Table 1) was
employed to evaluate the influence of process varia -bles on the morphology, size and size distribution of the particles produced.
Cheng et al. (2016). Samples (50 mg) were added to 100 mL distilled water and maintained under constant stirring (100 rpm) at 37 °C. At selected periods of 0, 60, 120, 180, 240, 300, 360 and 420 seconds, 1.5 mL was collected from the solution and immediately re-plenished with pure solvent to maintain the original
volume. Then, the samples were filtered using 0.22 μm
membranes and assayed for N-acetylcysteine concen-tration employing the UV-visible Spectrophotometric procedure described by Raggi et al. (1982).
Power X-ray diffraction (PXRD)
PXRD data was collected from a θ-θ D2 Phaser (Bruker) diffractometer equipped with a Cu Kα source (λ = 1.5418 Å) operated at 30 kV and 10 mA, using a
1-dimensional LYNXEYE Scintillation counter
detec-tor. Diffraction data was collected between 5 and 50 2θ
degrees and 0.5 s counting time per step.
Identification and quantification of residual solvent
Gas chromatography was used (GC model 5975C Inert MSD brand Agilent Technologies), coupled with a mass spectrometer (GC-MS), employing a
heads-pace vial for the identification of residual solvent in
the particles produced. The operation conditions we-re adapted from the method described by Gudat et al.
(2007) with a DB624 - 30 m x 0.45 mm x 2.55 µm co
-lumn. The quantification of residual solvent was then investigated by gas chromatography - flame ionization
detector (GC-FID) using the same operational condi-tions as in the GC-MS.
RESULTS AND DISCUSSION N-acetylcysteine micronization
Results from the 23 Central Composite Design
(CCD) are shown in Table 2, which shows the values of mean particle size (X) as well as the variation
coe-fficient (VC) of the experimental data.
The mean particle size for the non-micronized
compound is 709.8 µm and, compared with the result found in run 2, 2.9 µm, a relevant particle size reduction
of about 248 fold is found. Franceschi et al. (2008) in
studying the micronization process of β-carotene by
the SEDS technique reached the smallest particle size,
3.2 µm, at 8 MPa. The fact that micro-scale spherical
particles were obtained at the mildest process operating condition (8 MPa and 35 ºC) is very important, due to reduced product degradation and, from an industrial point of view, lower CAPEX (capital expenditure) and OPEX (operational expenditure) would be involved in the production.
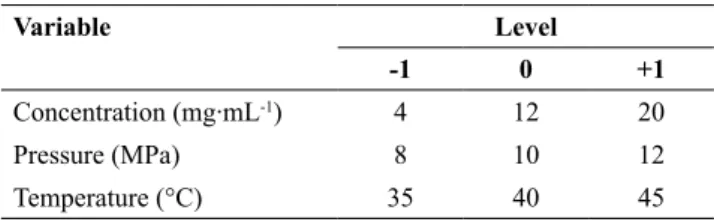
Table 1. Variables studied in the micronization process of the samples.
Variable Level
-1 0 +1
Concentration (mg∙mL-1) 4 12 20
Pressure (MPa) 8 10 12
Temperature (°C) 35 40 45
Morphology and determination of particle size
The morphology of the N-acetylcysteine samples was determined using scanning electron microscopy (SEM) (JEOL JSM-6390LV, United States). The mean particle size was determined using the software Meter Size (version 1.1) (Machado Jr et al., 2014). From the calculated average particle size, the standard deviation
and the variation coefficient (VC) were used as statis -tical tools to express the variability of the data.
Fourier Transform Infrared Spectroscopy (FTIR)
Fourier Transform Infrared Spectroscopy (FTIR) was used on the non-micronized and micronized sam-ples in order to study possible changes of the com-pound after micronization. Measurements were perfor-med in a spectrophotometer Shimadzu IRPrestige-21. Approximately 1 mg of microparticles was triturated with KBr and pressed into a pellet for FTIR charac-terization within the spectral range of 400-4000 cm-1. Dissolution rate analysis
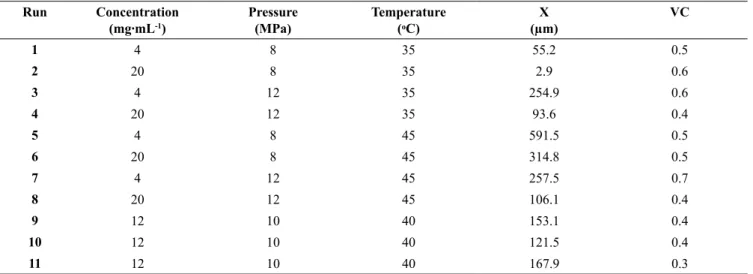
Table 2. Results of 23 CCD experimental design of NAC micronization.
Run Concentration
(mg∙mL-1)
Pressure (MPa)
Temperature
(ͦC) (µm)X
VC
1 4 8 35 55.2 0.5
2 20 8 35 2.9 0.6
3 4 12 35 254.9 0.6
4 20 12 35 93.6 0.4
5 4 8 45 591.5 0.5
6 20 8 45 314.8 0.5
7 4 12 45 257.5 0.7
8 20 12 45 106.1 0.4
9 12 10 40 153.1 0.4
10 12 10 40 121.5 0.4
11 12 10 40 167.9 0.3
Figure 2: Pareto Chart showing the effect of micronization process
parameters on the solute particle size.
The Pareto graph (Figure 2) reveals that the most
relevant micronization process variable (95% confi -dence level) is the operating temperature, which has
a positive effect and therefore an increase of this pa -rameter leads to an undesirable increase in particle size. It is interesting to note that in runs at the same pressures and concentrations, at a temperature of 45
°C, an increase in particle size was verified (Table 2).
Therefore, a temperature of 45 °C is not interesting in this micronization process, due to the undesirable increase in particle size.
Cheng et al. (2016), investigating the etoposide mi-cronization using acetone as solvent with the SEDS technique, found that a rise in temperature led to an increase in particle size. This may be attributed to the
fact that an increase in temperature at constant pressu-re causes a pressu-reduction in CO2 density, and hence a de-crease in the solubility of etoposide in acetone, leading to a lower degree of supersaturation and an increase in the particle size. Aguiar et al. (2016) in the microni-zation of trans-resveratrol using the SEDS technique, also found that the increase in temperature from 35 °C to 45 °C resulted in larger particles, this corroborating that higher temperatures lead to the formation of larger size particles due to the improved dissolution, favored at higher temperatures, and lower level of agglomera-tion and consequently lesser crystal growth (Priamo et al., 2013).
According to Chen et al. (2007), the negative effect
shown by the cross interaction of pressure x tempera-ture on particle size might be attributed to the fact that the droplet size formed in the dispersed solution in the micronization chamber depends on the interfacial ten-sion between the organic solution and the supercritical antisolvent, as well as their densities. Yet, an increase in pressure at constant temperature leads to an increa-se in CO2 density, hence a better dispersion of the so-lution in the antisolvent with a consequent decrease in droplet size. Mass transfer is then improved due to
the increase of the diffusion coefficient of supercritical
CO2, thus better removing the solvent from the solu-tion, causing the precipitation of the compound (Chen et al., 2007; Franceschi et al., 2008).
As observed from the Pareto chart (Figure 2), the
third significant process variable is the solution con -centration, with an increase in concentration leading to a reduction in average particle size.
In runs 1 to 8, in trials at the same temperature and pressure (Table 2), but with a solution concentration of
process as in the case of runs 1 and 2 wherein the
re-duction was 55 µm to 2.86 µm.
The same behavior was verified by Franceschi et
al. (2008), who studied the micronization process of
β-carotene by the SEDS technique and found also that
the increase of solution concentration reduced the ave-rage particle size. Hong et al. (2009), using the SEDS technique for precipitation of astaxanthin, also
veri-fied that increased concentration reduces the particle
diameter.
The effect of solution concentration can be explai -ned in terms of supersaturation, because when dilute solutions are injected into the camera, the precipitation rate of supersaturation is smaller and the nucleation process is slower. Therefore, the small amount of cores generated under these conditions favors the growth of the nuclei, therefore generating larger particles, besi-des increasing the size distribution. When the injected solution is close to saturation, the nucleation mecha-nism prevails over the mechamecha-nism of particle growth
due to a high supersaturation rate, consequently ge-nerating smaller-sized particles (Cardoso et al., 2008). The fact that the concentration of the solution
affects the process was also observed by Wubbolts
et al. (1999), who studied ascorbic acid precipitation from an ethanol solution employing CO2 as antisolvent and found that the increase of solute concentration re-duced the particle size. These authors attributed this behavior to the fact that, at high solution concentra-tions, at the time that the solute precipitates intense nu-cleation occurs, promoting the production of smaller particles with more uniform size.
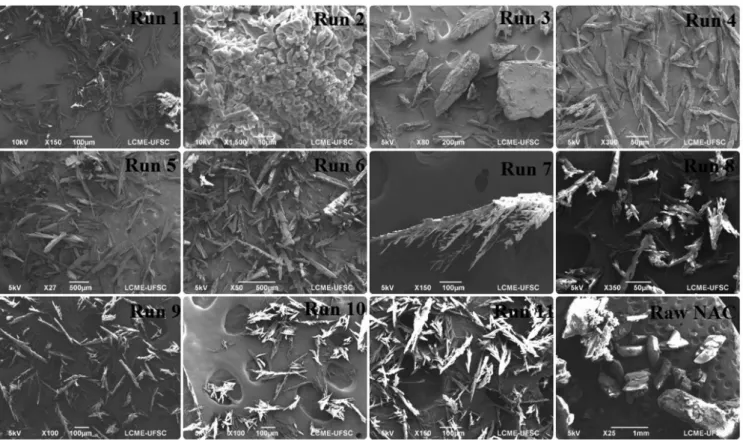
As can be seen from the scanning electronic mi-crographs (Figure 3), all the particles obtained are of prismatic morphology. Run 2 produced more homoge-neous particles in relation to other runs. In this run the smallest particle size was obtained. Franceschi et al.
(2008) also obtained β-carotene particles in the form
of prisms in the SEDS micronization process.
Figure 3: Scanning Electron Microscope (SEM) of the produced particles.
FTIR
It can be seen from the FTIR results shown in Figure 4 that N-acetylcysteine was not degraded after
the micronization process, nor did it suffer chemical alteration. This can be verified by the spectra which
overlap. According to Silverstein (2006) it is unlikely that two different compounds present the same spec
-trum, thus the correlation peak to peak constitutes a
FTIR results of N-acetylcysteine samples, microni-zed and non-micronimicroni-zed, showed 3 strong absorption bands (Figure 4), typical for this compound: 3390 cm-1
(1), 2549 cm-1 (2) e 1720 cm-1 (3). The main functional groups of NAC are all well identifiable with intense
bands: (1) NH at 3390 cm-1; (2) SH, responsible for
the odor, at 2549 cm-1 and (3) C = 0 at 1720 cm-1. The
data obtained are in agreement with those reported by
Boeckx et al. (2010).
Dissolution rate analysis
From Figure 5 a noticeable difference can be seen
in the dissolution of micronized and raw compound, since in run 2 there was a 100% dissolution of the compound at nearly zero time. Raw N-acetylcysteine showed a dissolution of 97.16% in 420 s, while the product obtained in run 5 showed a dissolution of 99.76% in 300 s. Thus, in relation to run 2, the micro-nization process increased by 4 times the dissolution rate at time 0 s of the compound to the point that only the contact with the dissolution solution already cau-ses total dissolution without the need of mechanical agitation.
Cheng et al. (2016), in the study of etoposide mi-cronization with supercritical CO2 using the SEDS te-chnique, found that the best result increased by appro-ximately 4 times the dissolution rate. Micronized drugs provided a dissolution of 90% and raw drugs 24% at 180 min. Hiendrawan et al. (2014), in the
microniza-tion process of fenofibrate with supercritical CO2 using the Rapid Expansion of Supercritical Solution (RESS)
Figure 4: Infrared spectrum of micronized (red line) and non-micronized (dark line) NAC by SEDS technique. (1) NH the 3390 cm-1. (2) SH the
2549 cm-1. (3) C = 0 the 1720 cm-1.
technique, also noted an increase in drug dissolution, obtaining 80% dissolution of the processed compound and 50% dissolution for the raw compound at the time of 90 min.
Figure 5: Dissolution profiles of NAC in distilled water.
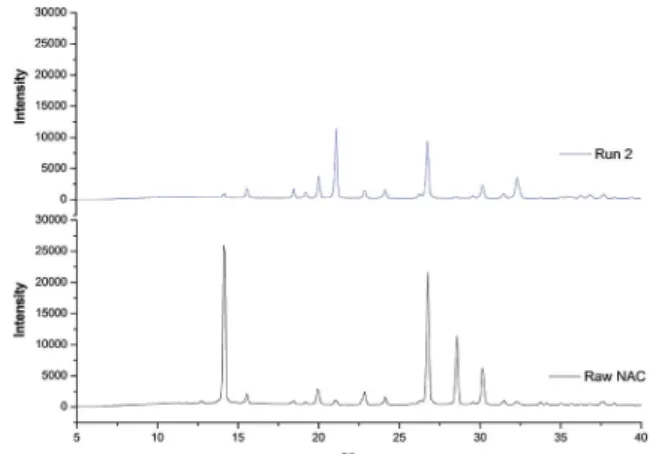
Powder X-ray diffraction (PXRD)
Samples of micronized and non-micronized NAC
were characterized by Powder X-Ray Diffraction (PXRD) to investigate the reflection diffraction of
samples, with results presented in Figure 6.
Figure 6: Powder X-Ray Diffraction (PXRD) of micronized and
non-micronized NAC particles.
The XRD patterns of the non-micronized
com-pound presented reflections of crystallinity of
N-acetylcysteine, as observed by Desai et al. (2008),
Kumar and Nangai (2013) in 2θ equal to 14.104;
It can be observed from Fig. 6 that there were
chan-ges in the pattern of peaks presented by the non-mi -cronized and mi-cronized compound. The XRD pattern of the particles of run 2 showed a slight change in
the angle of some peaks in comparison with the stan -dard sample. The main changes were: disappearance
of the peak at 12.7381; a peak shift from 14.104 to 14.195 and reduction of the intensity; a peak shift from 19.9315 to 20.0226 and increased intensity; a peak
shift from 21.0242 to 21.1153 and increased intensity;
a peak shift from 30.1298 to 30.2209 and reduction of
the intensity.
Some peaks kept their position, but there was
a reduction of the intensity: 22.8453; 26.7608 and
28.5819. These differences in angles (displacements, appearance and / or disappearance of peaks) show
that new polymorphic forms of the compound were generated by the SEDS process (Cheng et al., 2016). Polymorphism is the ability of a substance to exist in
the solid state in two or more different crystal structu
-res (Araujo et al., 2012). Different polymorphic forms of a same compound can present significant differen -ces in dissolution rate, pro-cessability and physical and chemical stability (Aguiar et al., 1999). Therefore, the existence of new polymorphic forms of the compound, generated by the SEDS technique, can be related to the increased dissolution rate of a micronized compound.
Residual solvent analysis
The results of GC coupled to mass spectrometry
(GC-MS) identified residual dichloromethane in
samples of micronized NAC. With the aid of gas
chromatography with a flame ionization detector (GC-FID), 25.45 ppm of dichloromethane were quantified
in the particles of micronized NAC samples. The value of residual solvent is within the limits established by the United States Pharmacopoeia (400 ppm), European Pharmacopoeia (600 ppm), Pharmacopoeia of the People’s Republic of China (600 ppm) and The National Agency for Sanitary Vigilance - ANVISA Brazil (600 ppm) (Elvassore et al., 2001) and also below the value established by the International Conference on Harmonization (ICH), document Q3C(R5) from 2011, the regulatory authority in terms of drugs and pharmaceutical industries in United States, Europe and Japan, which determines the maximum DCM concentration for human consumption, 600 ppm.
Several studies using the SEDS technique, dealing with the precipitation of solids using dichlorometha-ne as solvent and CO2 as antisolvent, adopt drying ti-mes between 30 to 120 min, which allows a residual
amount of dichloromethane in particles in the range of 38 - 58 ppm (Hong et al., 2009; Kang et al., 2008). The present study employed 50 min of drying time, resulting in residual solvent values lower than those reported in the literature for DCM and complete remo-val of acetone.
The production of particles with low concentration of residual solvent is important because it ensures a safe product for the consumer (Herberger et al., 2003) and within the standards set for human consumption. Therefore, the SEDS technique enables production of microparticles presenting low concentration of DCM
(25.45 ppm) in the final product, within the limits re -quired by regulatory agencies.
CONCLUSIONS
The particle size reduction led to increased con-tact surface and consequently increased solubility in aqueous solution for the active compound, which pro-vided a 100 % dissolution at 0 s time for run 2 (smal-ler particle size) and ~ 100 % dissolution for run 5 (larger particle size) at the time of 300 s, while the raw starting material presented 97.16 % dissolution at 420 s time. Results obtained in this study are rele-vant, because it was possible to reduce about 248 fold
the average particle size of NAC, to 2.86 µm, besides
providing a high dissolution rate. The best result was obtained at the lowest temperature and pressure (35
°C and 8 MPa, respectively), which makes the data even more relevant, especially if the benefits are con -sidered of reducing process costs and the possibility of applying this technique to thermosensitive compoun-ds, since FTIR accused no degradation. By XRD it can be concluded that the micronized compound has
a different crystalline structure compared to the non --micronized compound that confers new properties to the compound, such as increased rate of dissolution. Finally, the micronized compound, besides presenting a fast dissolution rate, presented small residual con-centrations of dichloromethane. The values obtained are well below those permitted by regulatory autho-rities for pharmaceutical compounds; therefore, the consumption of the micronized compound prepared by
SEDS should not present risks to human health.
ACKNOWLEDGMENTS
The authors thank CNPq (Project 478520/2013-1) and CAPES for financial support and scholarships and
REFERENCES
Aguiar, G.P.S., Boschetto, D.L., Chaves, L.M.P.C., Arcari, B.D., Piato, A.L., Oliveira, J.V., Lanza, M. Trans-resveratrol micronization by SEDS technique. Ind. Crops Prod. 89, 350-355 (2016). Aguiar, M.R.M.P. de, Gemal, A.L., Gil, S., Silva,
R.A. da, Characterization of polymorphism in pharmaceuticals by solid state nuclear magnetic resonance, Quím. Nova. 22, 553-564 (1999). Andrade, K.Q., Moura, F.A., dos Santos, J.M., de
Araújo, O.R.P., de Farias Santos, J.C., Goulart,
M.O.F., Oxidative Stress and Inflammation in
Hepatic Diseases: Therapeutic Possibilities of N-Acetylcysteine. Int. J. Mol. Sci. 16, 30269-30308 (2015).
Araujo, G.L.B. de, Pitaluga JR, A., Antonio, S.G.,
Santos, C. de O.P., Matos, J. do R. Polimorfismo
na produção de medicamentos, Rev. Ciênc. Farm. Básica E Apl. 33, 27–36 (2012).
Berk, M., Dean, O.M., Cotton, S.M., Jeavons, S.,
Tanious, M., Kohlmann, K., Hewitt, K., Moss, K.,
Allwang, C., Schapkaitz, I., Robbins, J., Cobb,
H., Ng, F., Dodd, S., Bush, A.I., Malhi, G.S., The
efficacy of adjunctive N-acetylcysteine in major
depressive disorder: a double-blind, randomized, placebo-controlled trial. J. Clin. Psychiatry 75, 628–636 (2014).
Berk, M., Malhi, G.S., Gray, L.J., Dean, O.M., The
promise of N-acetylcysteine in neuropsychiatry. Trends Pharmacol. Sci. 34, 167-177 (2013).
Boeckx, B., Ramaekers, R., Maes, G., A theoretical
and matrix-isolation FT-IR investigation of the conformational landscape of N-acetylcysteine. J. Mol. Spectrosc. 261, 73-81 (2010).
Boschetto, D.L., Dalmolin, I., de Cesaro, A.M., Rigo, A.A., Ferreira, S.R.S., Meireles, M.A.A., Batista, E.A.C., Oliveira, J.V., Phase behavior and
process parameters effect on grape seed extract
encapsulation by SEDS technique. Ind. Crops Prod. 50, 352-360 (2013).
Cardoso, M.A.T., Cabral, J.M.S., Palavra, A.M.F., Geraldes, V., CFD analysis of supercritical antisolvent (SAS) micronization of minocycline hydrochloride. J. Supercrit. Fluids 47, 247-258 (2008).
Cazzola, M., Calzetta, L., Page, C., Jardim, J., Chuchalin, A.G., Rogliani, P., Matera, M.G.,
Influence of N-acetylcysteine on chronic bronchitis
or COPD exacerbations: a meta-analysis. Eur.
Respir. Rev. Off. J. Eur. Respir. Soc. 24, 451-461
(2015).
Chau, C.-F., Wang, Y.-T., Wen, Y.-L., Different micronization methods significantly improve the functionality of carrot insoluble fibre. Food Chem.
100, 1402-1408 (2007).
Chen, A.-Z., Pu, X.-M., Kang, Y.-Q., Liao, L., Yao, Y.-D., Yin, G.-F., Study of poly(L-lactide) microparticles based on supercritical CO2. J. Mater. Sci. Mater. Med. 18, 2339-2345 (2007). Cheng, Y., Xu, W., Chen, Z., Wang, Z., Huang,
D., Micronization of etoposide using solution-enhanced dispersion by supercritical CO2. J. Supercrit. Fluids 115, 10-16 (2016).
Deepmala, null, Slattery, J., Kumar, N., Delhey,
L., Berk, M., Dean, O., Spielholz, C., Frye, R.,
Clinical trials of N-acetylcysteine in psychiatry and neurology: A systematic review. Neurosci. Biobehav. Rev. 55, 294-321 (2015).
Desai, K.G.H., Mallery, S.R., Schwendeman, S.P. Formulation and Characterization of Injectable Poly(dl-lactide-co-glycolide) Implants Loaded with N-Acetylcysteine, a MMP Inhibitor. Pharm. Res. 25, 586-597 (2008).
Durán, N., Durán, M., Tasic, L., Marcato, P.D., Nanocrystal technology in pharmaceuticals. Quím. Nova 33, 151-158 (2010).
Elbini Dhouib, I., Jallouli, M., Annabi, A., Gharbi, N., Elfazaa, S., Lasram, M.M., A minireview on N-acetylcysteine: An old drug with new approaches. Life Sci. 151, 359-363 (2016).
Elvassore, N., Bertucco, A., Caliceti, P., Production of insulin-loaded poly(ethylene glycol)/poly(l-lactide) (PEG/PLA) nanoparticles by gas antisolvent techniques. J. Pharm. Sci. 90, 1628-1636 (2001). Franceschi, E., De Cesaro, A.M., Feiten, M.,
Ferreira, S.R.S., Dariva, C., Kunita, M.H., Rubira, A.F., Muniz, E.C., Corazza, M.L., Oliveira,
J.V., Precipitation of β-carotene and PHBV and
co-precipitation from SEDS technique using supercritical CO2. J. Supercrit. Fluids 47, 259–269 (2008).
Gudat, A.E.; Firor, R.L.; Bober, U., Better precision, sensitivity, and higher sample throughput for the analysis of residual solventes in pharmaceuticals. Agilent Application Note, Publication Number 5989-6023EN, (2007).
Herberger, J., Murphy, K., Munyakazi, L., Cordia,
J., Westhaus, E., Carbon dioxide extraction of residual solvents in poly(lactide-co-glycolide)
microparticles. J. Control. Release Off. J. Control.
He, W.Z., Suo, Q.L., Jiang, Z.H., A, S., Hong, H.L. Precipitation of ephedrine by SEDS process using a
specially designed prefilming atomizer. J. Supercrit.
Fluids 31, 101-110, (2004).
Hiendrawan, S., Veriansyah, B., Tjandrawinata, R.R.,
Micronization of fenofibrate by rapid expansion of
supercritical solution. J. Ind. Eng. Chem. 20, 54-60 (2014).
Hong, H.L., Suo, Q.L., Han, L.M., Li, C.P., Study on Precipitation of Astaxanthin in Supercritical Fluid. Powder Technol. 191, 294-298 (2009).
Kang, Y., Yin, G., Ouyang, P., Huang, Z., Yao, Y., Liao, X., Chen, A., Pu, X., Preparation of PLLA/PLGA microparticles using solution enhanced dispersion
by supercritical fluids (SEDS). J. Colloid Interface
Sci. 322, 87-94 (2008).
Kelly, G.S., Clinical applications of N-acetylcysteine. Altern. Med. Rev. J. Clin. Ther. 3, 114-127 (1998). Kumar, S.S., Nangia, A. A new conformational
polymorph of N-acetyl-L-cysteine. The role of S–
H∙∙∙O and C–H∙∙∙O interactions. CrystEngComm
15, 6498–6505 (2013)
Machado Jr, F.R.S., Reis, D.F., Boschetto, D.L.,
Burkert, J.F.M., Ferreira, S.R.S., Oliveira, J.V., Burkert, C.A.V., Encapsulation of astaxanthin
from Haematococcus pluvialis in PHBV by means of SEDS technique using supercritical CO2. Ind. Crops Prod. 54, 17–21 (2014).
Priamo, W.L., de Cezaro, A.M., Ferreira, S.R.S., Oliveira, J.V., Precipitation and encapsulation of
β-carotene in PHBV using carbon dioxide as
anti-solvent. J. Supercrit. Fluids 54, 103–109 (2010). Raggi, M.A., Cavrini, V., Di Pietra, A.M., Colorimetric
determination of acetylcysteine, penicillamine, and mercaptopropionylglycine in pharmaceutical dosage forms. J. Pharm. Sci. 71, 1384–1386 (1982).
Rosenblat, J.D., Kakar, R., Berk, M., Kessing,
L.V., Vinberg, M., Baune, B.T., Mansur, R.B.,
Brietzke, E., Goldstein, B.I., McIntyre, R.S., Anti-inflammatory agents in the treatment of bipolar
depression: a systematic review and meta-analysis. Bipolar Disord. 18, 89–101 (2016).
Silverstein, R.M., Identificação Espectrométrica de
Compostos Orgânicos. LTC (2006).