Brazilian Microwave and Optoelectronics Society-SBMO received 15 Dec 2017; for review 19 Dec 2017; accepted 26 Apr 2018
Abstract— Analysis of the state of polarization of light guided by structures recorded in lithium niobate and lithium fluoride crystals indicates that the recording method is determinant in the formation of birefringent structures. Each structure was written with a single and continuous translation of the crystal transversally to the laser beam. Birefringence was observed in the structures recorded in both crystals, despite the lack of intrinsic birefringence in lithium fluoride. The recorded structures are anisotropic showing regions with different birefringence. The structure generated with femtosecond laser is directly linked to the recording method and the crystalline lattice. This characteristic can be advantageous for application in photonic devices.
Index Terms— Lithium Fluoride, Lithium Niobate, State of Polarization,
Waveguide Femtosecond Writing.
I. INTRODUCTION
The inscription of structures in dielectric materials by exposure to ultrafast laser pulses was
described in 1996 [1]. An advantage of this method is the modification of the refractive index only in
the region of the material exposed to the focused energy of the laser, making possible the creation of
three-dimensional structures [2]. Different types of dielectrics, such as glasses, crystals or polymers,
can be used to manufacture photonic devices as it is a nonchemical method [3]-[4]. However, the bulk
material must have adequate characteristics for the intended applications, such as broad band range of
transparency or high electro-optic coefficients [5]. Tightly focused femtosecond laser pulses can cause
multiphoton and electron impact ionization into the material. These two processes are the main ones
responsible by the material breakdown and consequent formation of a microplasma. According to ref
[6], two types of damage were produced in LiNbO3 by the incidence of fs laser. Under low laser
fluences, localized defects created in the crystalline lattice cause an increase in the extraordinary
refractive index and can be annealed at moderate temperatures. On the other hand, high laser fluences
focused in the crystal produce localized lattice distortions leading to a volume increase and a
refractive index decrease. The material surrounding region is affected by the structural modification
and is subjected to a stress-induced birefringence. In this scenario, beam defocusing by the
microplasma competes with the self-focusing leading to laser pulses filamentation. In this sense, the
Effects of Birefringence on the
Electromagnetic Guidance of Structures
Produced by Femtosecond Laser
Fernanda Mantuan Dala Rosa de Oliveira1, Ismael Chiamenti1, José Luís Fabris1, Marcia Muller1, Hypolito José Kalinowski2
1
Universidade Tecnológica Federal do Paraná, Curitiba, PR, Brazil e-mails: [email protected], [email protected], [email protected], [email protected]
2
Brazilian Microwave and Optoelectronics Society-SBMO received 15 Dec 2017; for review 19 Dec 2017; accepted 26 Apr 2018
unique properties of the lithium niobate crystal (LiNbO3) have been exploited. It is a crystal with high
Curie temperature, excellent optical transparency in the visible and infrared wavelengths, high
electro-optic coefficients and nonlinear optical susceptibility [7]. This material has a trigonal crystal
structure formed by planes of oxygen atoms in a distorted hexagonal configuration. The octahedral
interstitials formed in the structure are one-third filled by lithium ions, one-third by niobium ions and
one-third are empty. LiNbO3 is a naturally birefringent crystal with characteristics that justifies its
wide use in acoustic wave transducers, acoustic delay lines, acoustic filters, amplitude and optical
phase modulators, second harmonic generators, Q-switches, beam deflectors, phase conjugators,
dielectric waveguides, memory elements, holographic data processing devices, among other devices
[8]. Particularly, erbium doped LiNbO3 crystals allowed the development of an entire class of new
waveguide devices such as modulators, efficient wavelength filters and adjustable lasers [9].
Additionally, it is an excellent material for integrated optics [10]. However, the structure of the
LiNbO3 has intrinsic defects, which make the material very prone to optical damage when irradiated
by high powers of visible light. In this case, MgO has been successfully used as doping agent to
decrease the photorefractive effect in this class of crystals [11].
Femtosecond laser pulses have been recently used to produce waveguides in LiNbO3 crystals
[12]-[18]. Structures were produced for high confinement at 1550 nm in z-cut [14], as well as in x-cut
crystals [15], but disappeared after approximately 30 and 100 days, respectively. The characteristics
of the waveguides depend on the parameters of the writing system. The so-called type I waveguides
associated to the refractive index increase were generated in z- and x-cut LiNbO3 crystals by the
incidence of fs laser with pulse energy below 0.5 µJ, as well as in Er3+, MgO codoped LiNbO3 with
pulse energies from 0.54 µJ to 0.66 µJ. In the later case, guiding in the infrared region occurred only
for the TM mode propagation [16]. Type I waveguides were reported to vanish when annealed at
150 oC for 1.5 h. On the other hand, pulse energy above the damage threshold produces Type II
waveguides [17] that were not subjected to thermal decay at 150 oC for several hours. Guidance in
type II structures occurs along the stress region formed around the laser focus region of decreased
refractive index. Depending on the crystal orientation, both structures can be formed at different
positions along the laser beam path.
Another crystal of interest for the production of waveguides is the lithium fluoride (LiF), an
alkaline halide material of unique properties. Unlike the other halides, LiF crystal presents very low
hygroscopy, has high coefficient of hardness, and its cleavage is difficult. The LiF crystal has cubic
face centered crystal structure, is optically inactive and exhibits high optical transparency for
wavelengths ranging from ~ 150 nm to above 6,000 nm [19]. Color centers can be produced in the material by irradiation with electrons, X-rays or γ -rays, although additive coloring is not feasible. The F-center has absorption band in the ultraviolet region, with peak at 248 nm without an identified
emission band. The main luminescence of color centers in LiF is associated with aggregated F2 and
Brazilian Microwave and Optoelectronics Society-SBMO received 15 Dec 2017; for review 19 Dec 2017; accepted 26 Apr 2018
superimposed absorption bands, called the M band (~ 450 nm). Fluorescence of these aggregated
centers was also observed by optically pumping the F band. Studies on the equilibrium dynamics of
the aggregate centers showed the possibility of provide a selective depopulation of one of the species
[21]. The efficiency of the lithium fluoride optical pumping cycle allows a number of applications
such as waveguides [22]-[27], color center lasers [28], including those with distributed feedback [29]
periodic photorefractive structures [30] and even radiation detectors [31]. Radiation detectors are
particularly interesting for imaging with confocal laser-scanning-microscopy using fluorescent
excitation, allowing better resolution than conventional techniques and greater applicability in
samples.
In the development of color centers lasers in LiF crystals, external cavities formed by mirrors and
also distributed feedback structures based on color centers in an original crystal (pristine) have been
used. Laser emission from approximately 530 nm to 1300 nm [28], [32]-[33] has been obtained.
Adequate modifications in the parameters of the writing technique allowed the fabrication of Bragg
waveguides in LiF crystals with femtosecond laser pulses. Several works focused on the study of the
Bragg waveguide dimensions and the associated refractive index variations [25], the measurement of
light propagation parameters in the range from 458 nm to 1550 nm [26]-[27] and the production of
LiF crystal waveguide lasers [24], [33].
In LiF and MgO single crystals, lattice distortions produced by femtosecond laser were investigated
by the observation of distributions of birefringence around the photoexcited region [34]. Birefringence
was associated to the structural changes caused by strain and stress. The photoexcitation with a
femtosecond laser produces a stress wave associated with the nonlinear ionization at the focal region.
Consequently, cracks and dislocations are expected to appear in the crystal structure as a result of the
thermal stress around the photoexcited region.
Despite the efforts, there are still some features concerning to the optical guidance of structures
produced in LiF and LiNbO3 that must be investigated in order to produce optimized optical devices
and lasers. Laser emission in LiF, for example, can be improved with an investigation of the
polarization of the light guided by the waveguides. On the other hand, the crystal cut and the writing
parameters influence the guiding properties of structures produced in LiNbO3.
In this work, were studied guidance properties of structures recorded in LiNbO3 and LiF crystals
according to the state of polarization of the coupled light.
II. EXPERIMENTAL
Guiding structures were produced in LiF and LiNbO3:0.3%Er2O3:0.5%MgO crystals by a
regenerative amplifier based on Ti:Sapphire (Coherent, Libra-F, at 800 nm with pulses of 140 fs at a
repetition rate of 1 kHz) focused by a 20x microscope objective lens (Thorlabs, LMH-20x, 1064 nm,
0.4 NA). LiNbO3 crystals were cut and polished to eliminate scattering effects on the surface. A
Brazilian Microwave and Optoelectronics Society-SBMO received 15 Dec 2017; for review 19 Dec 2017; accepted 26 Apr 2018
recording process. Each structure was written with a single and continuous translation of the crystal
transversally to the laser beam. Depending on the relative speed, a continuous volume of modified
refractive index that characterizes the waveguide is formed inside the crystal. The recording parameters for the LiF crystal were laser energy of 5 μJ per pulse, focalization depth of 100 μm from the top surface and translation speed of 191 μm/s. For the LiNbO3 crystal the translation speed was 50 μm/s with a laser energy of 2 μJ focalized at 100 μm from the surface.
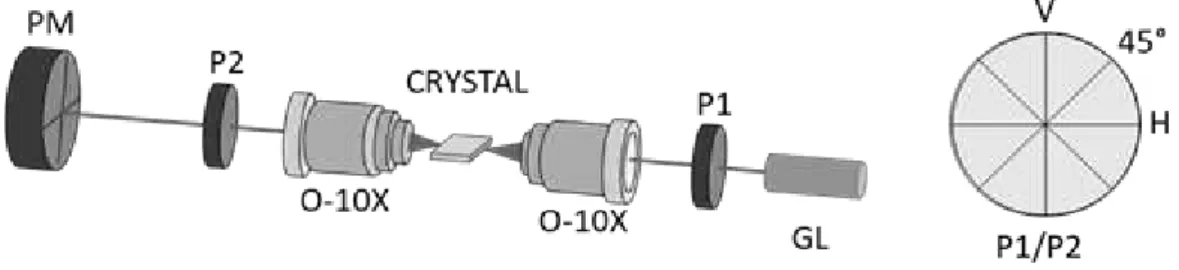
Fig. 1. Schematic diagrams: (left) Experimental set-up for detecting the beam profile at different polarizations; (right) Orientations for the transmission axis of the P1 and P2 polarizers.
Fig. 1 shows the experimental setup used to measure the beam profile of the light emerging from
the structures. The light of a semiconductor laser at 635 nm collimated by a GRIN lens (GL) is
focused at the crystal surface by a microscope objective (O-10X) and coupled to the waveguide. A
second microscope objective (O-10X), positioned at the focal distance from the opposite face of the
crystal, collects the light emerging from the waveguide. The laser beam is then captured by a Profile
Meter (PM) (Thorlabs, BP104-UV, wavelength range from 200 to 1100 nm) positioned in the
collimated region of the laser beam. A XYZ (Newport, ULTRAlign 561D-XYZ) stage provides the
optical alignment of the lenses and a XY stage (Newport, ULTRAlign 561D-YZ) is used for
positioning the crystal. The data acquisition system detects light intensities along the vertical and
horizontal axes. Images of the beam profile are then reconstructed by software (Thorlabs Beam 3.0 for
LiF and 6.2 for LiNbO3 images) from the intensity profiles collected by the Profile Meter. The state of
polarization (SOP) of the light emerging from the waveguide was analyzed with the help of two
polarizers (P1 and P2, extinction ratio of 1:4,000). The transmission axis of P1 assumed only two
orientations, vertical (V) or horizontal (H). For each orientation of P1, the beam profile was recorded in the absence of P2 (ϕ) and also for the P2 transmission axis parallel (VV), perpendicular (VH) and at 45° (V45°) with the P1 axis.
III. RESULTS
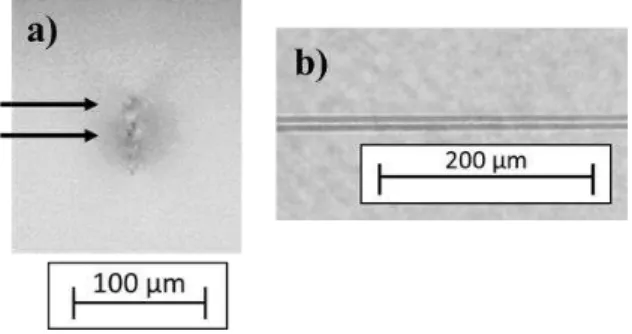
The cross-sectional transmission microscopy image of the structure recorded in LiNbO3 shows dark
regions in the center of the figure indicated by arrows in Fig. 2 (a). Additionally, two lines in the
longitudinal image of Fig. 2 (b), top view, indicate the recording of two parallel structures.
These dark regions are related to the decrease in the refractive index of the material resulting from
Brazilian Microwave and Optoelectronics Society-SBMO received 15 Dec 2017; for review 19 Dec 2017; accepted 26 Apr 2018
the dark ones, result from stress-induced changes that increases the refractive index (Type II
waveguide) [17].
Fig. 2. Images of the structure recorded in LiNbO3 captured by transmission microscopy: (a) cross-sectional image of the
crystal showing the structure of approximately 50 µm of width; (b) image of the structure formed by double lines in a top view of the crystal.
As LiNbO3 crystal is birefringent, changes in refractive index can occur in both the ordinary and the
extraordinary indexes. Structural changes, created in a regime of moderate recording intensity,
increase the extraordinary refractive index whereas the ordinary refractive index decreases. On the
other hand, nonlinear absorption effects at high energy pulses causes heavy damage to the material,
reducing both refractive indexes and resulting in the dark area. Besides, a stress-induced birefringent
region is formed around the damaged region [5],[6]. A critical power for breakdown in LiNbO3 of 0.3
MW corresponding to an energy of 0.12 µJ was reported [6]. Therefore, as the energy per pulse of 2 μJ used to produce the structures in LiNbO3 is higher than the critical energy for nonlinear ionization, filamentation caused by a dynamic balance between self-focusing and plasma defocusing is expected
to occur.
Fig. 3 shows images of the structure recorded in LiF captured by transmission microscopy. It can be
seen in Fig. 3 (a) the elongated transverse profile of the structure, which results from the expected
filamentation due to the recording method [5]. Unlike LiNbO3, the dark region in the longitudinal
profile of the LiF, Fig. 3 (b), exhibits a single line corresponding to the inscribed waveguide.
b)
a)
Fig. 3.Images of the structure inscribed in LiF captured by transmission microscopy (a) cross-sectional image, produced with a laser beam penetrating the crystal from the top surface (b) longitudinal image of the structure formed by a single line
in a top view of the crystal.
In the recording method, the laser beam was launched on the upper surface of the crystal that also
Brazilian Microwave and Optoelectronics Society-SBMO received 15 Dec 2017; for review 19 Dec 2017; accepted 26 Apr 2018
a)
Vϕ
LiNbO
3b) H
ϕ
LiNbO
3c) V
ϕ
LiF
d) H
ϕ
LiF
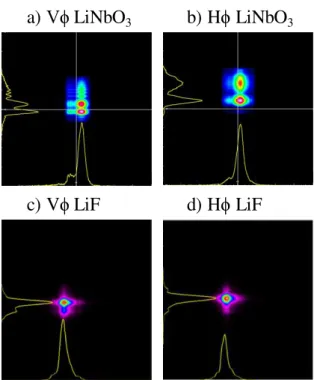
Fig. 4.Reconstructed images of the near field profile of the beam emerging from the structure inscribed in LiNbO3 (a, b)
and in LiF (c, d), for the SOP of the incident light at V and H directions.
Reconstructed images that represents the near field profile of the beam emerging from the structures
inscribed in LiNbO3 and LiF are shown in Fig. 4. These images correspond to the profiles obtained by
controlling only the SOP of the incident light, and therefore, P2 was removed from the setup.
Polarization of light transmitted by P1 was at the V or H directions. The orientations of the images in
Fig. 4 (a), (b) and 4 (c), (d) are equivalent to the actual spatial orientation of the crystals in Fig. 2 (a)
and Fig. 3 (a), respectively. In other words, the upper side of the images corresponds to the upper
surface of the crystal. Fig. 4 (a) and 4 (b), exhibit in the vertical axis an elongated profile along the
crystal depth composed of two main regions of guidance. The profile in the horizontal axis shows
corresponds to the light guided by the whole structure. Nevertheless, modifications in the SOP of the
incident light shifts the xy position of these regions.
The reconstructed images of Fig. 4 (c) and 4 (d), exhibits a near field profile for the LiF with a more
regular shape comprised of one main region of maximum of intensity, therefore, a single waveguide.
Beam profiles of the light guided by the structure in LiNbO3 obtained for P1 and P2 transmission axes
Brazilian Microwave and Optoelectronics Society-SBMO received 15 Dec 2017; for review 19 Dec 2017; accepted 26 Apr 2018 -100 -50 0 50 100
0 5 10 15 1 Intensity ( arb. u nit)
Vertical axis (m)
V VV V45° VH 2 3
-100 -50 0 50 100 0 5 10 15 Intensity ( arb. u nit)
Horizontal axis (m)
V VV V45° VH 4 5
-100 -50 0 50 100
0,0 0,2 0,4 0,6 0,8 1,0 Intensity ( arb. u nit)
Vertical axis (m)
V VV + VH
-100 -50 0 50 100
0,0 0,2 0,4 0,6 0,8 1,0 Intensity ( arb. u nit)
Horizontal axis (m)
V VV + VH
a)
b)
c)
d)
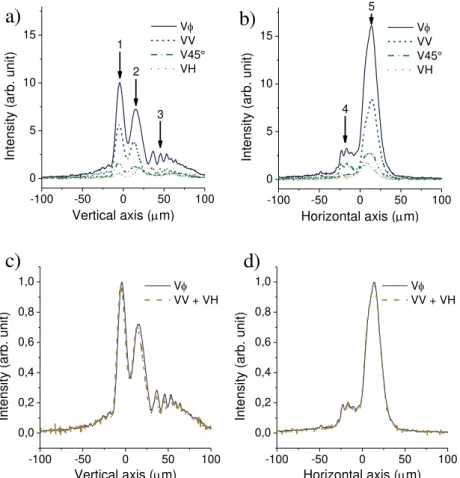
Fig. 5.(a, b) Graphical representations of the near field profile of the beam emerging from the structure inscribed in LiNbO3 for P1 at V direction and P2 absent or at V, 45° and H directions; (c, d) Signal obtained with P1 (V) and without P2
(Φ) compared with the combination of the signals obtained for VV and VH.
For all P1 and P2 arrangements, the intensity and shape of the beam profile remained constant as
can be seen in Fig. 5 (c) and 5 (d). In Fig. 5 (a), the profile on the vertical axis (crystal depth) for P1 aligned at vertical and P2 absent (Vϕ), exhibits three peaks, also shown in Fig. 4 (a). Peak 1, corresponds to the guidance at the innermost region of the structure in the crystal which suffers the
largest decrease of refractive index due to the laser focusing during the inscription. In the region near
to the crystal surface occurs a leakage of the guided power to the external medium, peak 3 of Fig. 5
(a). When the transmission axes of both polarizers are aligned (VV), the overall intensity of the signal
decreases but the profile still exhibits the 3 peaks. For the V45° arrangement, the signal decreases
further, peak 3 almost vanishes and the profile shows only peaks 1 and 2 with approximately the same
intensity. When P1 and P2 directions are orthogonal (VH) an output signal is still detected. Peak 1
becomes less intense than peak 2. Therefore, the guidance shifts towards the surface of the crystal.
The beam profile in the horizontal axis, Fig. 5 (b), exhibits an intense peak 5, corresponding to the
combined intensity of the three peaks (1, 2 and 3) shown in the vertical axis. For Vϕ and VV
arrangements, is observed a lateral lobe 4 which vanishes for V45° and VH. The horizontal and the vertical profiles experimentally obtained for Vϕ, Fig. 5 (c) and 5 (d), are reconstructed through the addition of the profiles obtained for VV and VH configurations. Each anisotropic region of the
Brazilian Microwave and Optoelectronics Society-SBMO received 15 Dec 2017; for review 19 Dec 2017; accepted 26 Apr 2018
polarized incident light, each region of guidance propagates the field components in the directions of
its birefringence axes. As a consequence, the shape of the beam profile changes for different
orientations of the P2 transmission axis.
-50 0 50 100 150
0 10 20 30 40 50 60 1 2 Intensity ( arb. u nit)
Vertical axis (m)
H HV H45° HH
3
-100 -50 0 50 100 0 10 20 30 40 50 60 Intensity ( arb. u nit)
Horizontal axis (m)
H HV H45° HH 4 5
-50 0 50 100 150
0,0 0,2 0,4 0,6 0,8 1,0 Intensity ( arb. u nit)
Vertical axis (m)
H HV + HH
-100 -50 0 50 100
0,0 0,2 0,4 0,6 0,8 1,0 Intensity ( arb. u nit)
Horizontal axis (m)
H HV + HH
a)
b)
c)
d)
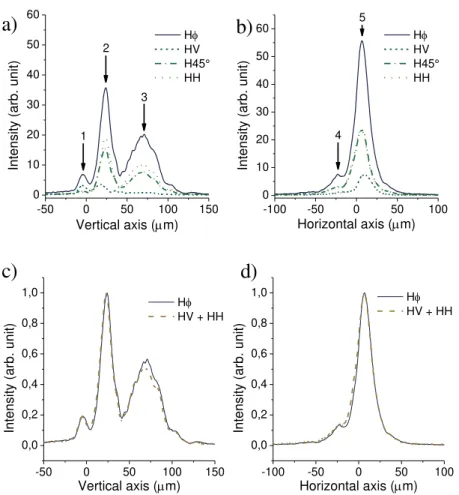
Fig. 6.(a, b) Graphical representations of the near field profile of the beam emerging from the structure inscribed in LiNbO3 for P1 at H direction and P2 absent or at V, 45° and H directions; (c, d) Signal obtained with P1 (H) and without P2
(Φ) compared with the combination of the signals obtained for HV and HH.
In Fig. 6 (a), the beam profile obtained for Hϕ configuration also shows three peaks. However, unlike profile obtained for Vϕ, peaks 2 and 3 are the most intense. In this case, light preferentially propagates in the guidance regions nearly to the surface of the crystal. For the H45° and HH
configurations, peak 1 vanishes. For HV, peaks 1 and 2 have approximately the same amplitude and
peak 3 vanishes. Therefore, the innermost portion of the structure produced in the crystal guides
preferentially light linearly polarized at the vertical direction. On the other hand, the region nearly to
the surface guides preferentially light linearly polarized at the horizontal direction. Additionally,
leakage of the light occurs preferentially for the horizontal polarization.
The beam profile at the horizontal axis, Fig. 6 (b), shows peak 5 which corresponds to the combined
intensity of the three peaks in the vertical axis (Fig. 6 (a)). For this case, the lateral lobe 4 decreases
for HV and HH, and vanishes just for V45°.
For incident light linearly polarized at the horizontal direction, the beam profile obtained without
Brazilian Microwave and Optoelectronics Society-SBMO received 15 Dec 2017; for review 19 Dec 2017; accepted 26 Apr 2018 -100 -50 0 50 100
0 5 10 15 1 Intensity ( arb. u nit)
Vertical axis (m)
V VV V45° VH 2 3
-100 -50 0 50 100 0 5 10 15 Intensity ( arb. u nit)
Horizontal axis (m)
V VV V45° VH 4 5
-100 -50 0 50 100
0,0 0,2 0,4 0,6 0,8 1,0 Intensity ( arb. u nit)
Vertical axis (m)
V VV + VH
-100 -50 0 50 100
0,0 0,2 0,4 0,6 0,8 1,0 Intensity ( arb. u nit)
Horizontal axis (m)
V VV + VH
a)
b)
c)
d)
Fig. 7.(a, b) Graphical representations of the near field profile of the beam emerging from the structure inscribed in LiF
for P1 in V direction and P2 absent or at V, 45° and H directions; (c, d) Signal obtained with P1 (V) and without P2 (Φ)
compared with the combination of the signals obtained for VV and VH.
Beam profiles of Fig. 7 and 8 reveal the induced birefringence of the structure inscribed in lithium
fluoride crystal. As it can be seen, guidance is obtained even for orthogonal directions of P1 and P2
transmission axes, VH arrangement.
Fig. 7 (a), shows the beam profile at the vertical axis composed of two main peaks. As peak 2 is the
most intense, guidance occurs preferentially in the region of the inscribed structure close to the crystal surface for Vϕ, VV and V45° configurations. However, for VH, guidance occurs in the innermost region of the crystal. In the horizontal axis, the beam profile for Vϕ, VV and V45° shows a pronounced peak 4 with a lateral lobe 3. For VH lobe 3 vanishes and peak 4 shifts to the right. Beam profile for Vϕ is reconstructed by adding the VV and VH profiles (Fig. 7 (c) and 7 (d)) as occurred with LiNbO3.
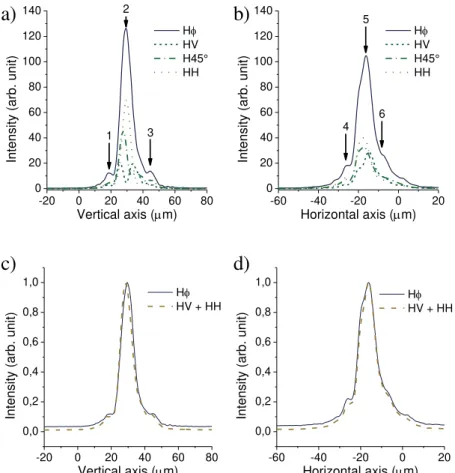
Fig. 8 (a) exhibits the beam profile obtained with Hϕ, HH and H45° configurations. For Hϕ there
are two lateral lobes, 1 and 3. For HH and H45° lobe 1 vanishes, but there is some guidance
corresponding to lobe 3. Profiles at the horizontal axis, Fig. 8 (b), exhibit the intense peak 5 with two
Brazilian Microwave and Optoelectronics Society-SBMO received 15 Dec 2017; for review 19 Dec 2017; accepted 26 Apr 2018 -20 0 20 40 60 80
0 20 40 60 80 100 120 140 Intensity ( arb. u nit)
Vertical axis (m)
H HV H45° HH 1 2 3
-60 -40 -20 0 20
0 20 40 60 80 100 120 140 Intensity ( arb. u nit)
Horizontal axis (m)
H HV H45° HH 4 6 5
-20 0 20 40 60 80 0,0 0,2 0,4 0,6 0,8 1,0 Intensity ( arb. u nit)
Vertical axis (m)
H HV + HH
-60 -40 -20 0 20
0,0 0,2 0,4 0,6 0,8 1,0 Intensity ( arb. u nit)
Horizontal axis (m)
H HV + HH
a)
b)
c)
d)
Fig. 8. (a, b) Graphical representations of the near field profile of the beam emerging from the structure
inscribed in LiF for P1 at H direction and P2 absent or at V, 45° and H directions; (c, d) Signal obtained with P1
(H) and without P2 (Φ) Compared with the combination of the signals obtained in SOP in HV and HH.
IV. CONCLUSION
The intrinsic birefringence of the bulk material influences the guidance properties of structures
produced in crystals by femtosecond laser. The anisotropy caused by the highly focused writing beam
superimposes an induced birefringence to the intrinsic LiNbO3 birefringence, affecting the SOP of
light propagating in the structure. Even for a non-birefringent crystal, as LiF, the induced
birefringence leads to changes in the SOP of the guided light.
Structures produced in LiF and LiNbO3 by the femtosecond laser are composed of anisotropic
regions with different birefringence. Choosing adequately the writing parameters and the bulk
material as well as the SOP of the coupled light, it can be constrained to propagate in a previously
determined region of the crystal. Such characteristic may allow tailoring the waveguides for a specific
application, e.g. an evanescent field sensor where the light propagation can be confined close to the
material surface, enhancing the interaction with the surrounding medium.
ACKNOWLEDGMENT
We thank the UTFPR for support received during the work realization. This work was supported by
Brazilian Microwave and Optoelectronics Society-SBMO received 15 Dec 2017; for review 19 Dec 2017; accepted 26 Apr 2018
REFERENCES
[1] K. M. Davis, K. Miura, N. Sugimoto, K. Hirao, “Writing waveguides in glass with a femtosecond laser,”Optics Letters, vol. 21, pp. 1729-1731, 1996.
[2] S. Nolte, M. Will, J. Burghoff, A. Tuennermann, “Femtosecond waveguide writing: a new avenue to three-dimensional integrated optics,” Appl. Phys. A: Materials Science & Processing, vol. 77, pp. 109-111, 2003.
[3] K. Miura, J. Qiu, H. Inouye, T. Mitsuyu and K., Hirao, “Photowritten optical waveguides in various glasses with ultrashort pulse laser,”Appl. Phys. Lett., vol. 71, pp. 3329-3331, 1997.
[4] M. Ams, G.D. Marshall, P. Dekker, J.A. Piper and M.J. Withford, “Ultrafast laser written active devices,” Laser Photonics Rev., vol. 3, no. 6, pp. 535-544, 2009.
[5] J. Burghoff, S. Nolte, A. Tuennermann, “Origins of waveguiding in femtosecond laser-structured LiNbO3,” Appl. Phys.
A: Materials Science and Processing, vol. 89, pp. 127-132, 2007.
[6] J. Burghoff, H, Hartung, S. Nolte, A. Tuennermann, “Structural properties of femtosecond laser-induced modifications in LiNbO3,”Appl. Phys. A: Materials Science and Processing, vol. 86, pp. 165-170, 2006.
[7] P. Rabiei and P. Gunter, “Optical and electro-optical properties of submicrometer lithium niobate slab waveguides
prepared by crystal ion slicing and wafer bonding,” Appl. Phys. Lett., vol. 85, no. 20, pp. 4603-4605, 2004.
[8] R. S. Weis, T. K, Gaylord, “Lithium niobate: summary of physical properties and crystal structure,” Appl. Phys. A: Materials Science & Processing, vol. 37, pp. 191-203, 1985.
[9] I. Baumann, S. Bosso, R. Brinkmann, R. Corsini, M. Dinand, A. Greiner, K. Schäfer, J. Söchtig, W. Sohler, H. Suche,
and R. Wessel, “Er-Doped integrated optical devices in LiNbO3,” IEEE J. Sel. Top. Quant. Electron., vol. 2, no. 2, pp.
355–366, 1996.
[10] W. Sohler, B. K. Das, D. Dey, S. Reza, and H. Suche, “Erbium-Doped lithium niobate waveguide lasers,”IEICE Trans. Electron.,
no. 5, pp. 990–997, 2005.
[11]R. K Choubey, P. Sen, P. K. Sen, R. Bhatt, S. Kar, V. Shukla, K. S. Bartwal, “Optical properties of MgO doped LiNbO3
single crystals,” Opt. Materials, vol. 28, pp. 467-472, 2006.
[12]L. Gui, B. Xu, and T. C. Chong, “Microstructure in lithium niobate by use of focused femtosecond laser pulses,” IEEE Photonics Technol. Lett., vol. 16, no. 5, pp. 1337–1339, 2004.
[13]H. Chen, T. Lv, A. Zheng, and Y. Han, “Directly writing embedded waveguides in lithium niobate by a femtosecond
laser,” Opt. - Int. J. Light Electron Opt., vol. 124, no. 3, pp. 195–197, 2013.
[14]R. R. Thomson, S. Campbell, I. J. Blewett, a. K. Kar, and D. T. Reid, “Optical waveguide fabrication in z-cut lithium
niobate (LiNbO[sub 3]) using femtosecond pulses in the low repetition rate regime,” Appl. Phys. Lett., vol. 88, pp. 111109-1 - 111109-3, 2006.
[15]S. Bhardwaj, K. Mittholiya, A. Bhatnagar, R. Bernard, J.A. Dharmadhikari, D. Mathur and A.K. Dharmadhikari,
“Inscription of type I and depressed cladding waveguides in lithium niobate using a femtosecond laser,” Appl. Optics, vol. 56, no. 20, pp. 5692-5697, 2017.
[16]J. Lv, X. Hao and F. Chen, “Green up-conversion and near-infrared luminescence of femtosecond-laser-written waveguides in Er3+, MgO co-doped nearly stoichiometric LiNbO3 crystal,”Optics Express, vol. 24, no. 22, pp.
25482-25490, 2016.
[17]J. Burghoff, C. Grebing, S. Nolte and A. Tuennermann, “Efficient frequency doubling in femtosecond laser-written waveguides in lithium niobate,” Appl. Phys. A: Materials Science and Processing, vol. 89, pp. 081-108, 2006.
[18]J. Qi, P. Wang, Y. Liao, W. Chu, Z. Liu, Z. Wang, L. Qiao, and Y. Cheng, “Fabrication of polarization-independent single mode waveguides in lithium niobate crystal with femtosecond laser pulses,”Optical Materials Express, vol.6, no.8, pp. 2554-2559, 2016.
[19]G. Baldacchini, “Colored LiF: an optical material for all seasons,”Journal of Luminescence, vol. 100, pp. 333–343, 2002.
[20]J. Nahum and D. A. Wiegand “Optical properties of some F-aggregate centers in LiF,”Phys. Rev. pp. 154 817, 1967. [21]H. J. Kalinowski, R. M. Montereali, M. A. Vincenti and R. N. Nogueira, “Visible photoluminescence in coloured
lithium fluoride under ultra-violet continuous wave excitation,”J. Phys. C:Conf. Series, 249, 2010, pp. 012002. [22]R. A. Nunes, H. J. Kalinowski, S. Paciornik, A. M. Souza, and L. C. Scavarda do Carmo, “Electron-beam production of
colour centres on alkali halide crystals and films,” Nucl. Instrum. Methods Phys. Res. B, vol. 32, pp. 222, 1988. [23]R. M. Montereali, A. Mancini, G. C. Righini, and S. Pelli, “Active stripe waveguides produced by eléctron beam
lithography in LiF single crystals,” Opt. Commun., vol 153, pp. 223, 1998.
[24]T. Kurobori, T. Sakai, S. A. Aoshima, “A narrow band, green-red colour centre laser in LiF fabricated by femtosecond laser pulses,” Phys. Stat. Sol., vol. 204a, no. 3, pp. 699–705, 2007.
[25]I. Chiamenti, F. Bonfigli, R. M. Montereali and H. J. Kalinowski, “Dimensions and refractive index estimates of deeply buried optical waveguides in lithium fluoride,” J. Microw. Optoelectr. Eletromag. Appl., vol.13, no. 1, pp. 47-54, 2014. [26]I. Chiamenti, F. Bonfigli, A. S. L. Gomes, R. M. Montereali, L. N. Costa and H.J. Kalinowski, “Broadband optical
active waveguides written by femtosecond laser pulses in lithium fluoride,”Chin. Phys. Lett., vol. 31, no.1, pp. 014201, 2014.
[27]] I. Chiamenti, F. Bonfigli, A. S. L. Gomes, F. Michelotti, R. M. Montereali and H.J. Kalinowski, J. Appl. Phys vol. 115, pp. 023108, 2014.
[28]T. Kurobori, K. Inabe, and N. Takeuchi, “Room temperature visible distributed-feedback colour centre laser,” J. Phys. D: Appl. Phys., vol. 16, no. L121, 1983.
Brazilian Microwave and Optoelectronics Society-SBMO received 15 Dec 2017; for review 19 Dec 2017; accepted 26 Apr 2018
[30]M. A. Vincenti, S. Almaviva, R. M. Montereali, H. J. Kalinowski, and R. N. Nogueira, “Permanent luminescent micropatterns photoinduced by low-power ultraviolet irradiation in lithium fluoride,” Appl. Phys. Lett., Vol. 89, pp. 241125, 2006.
[31]R.M. Montereali, F. Bonfigli, E. Nichelatti, M.A. Vincenti, "Versatile lithium fluorde thin-film solid-state detectors for nanoscale radiation imaging," Nuovo Cimento C, vol 36, no. 2, pp. 35, 2013.
[32]V. V. Ter-mikirtychev, “Stable room-temperature LiF:F2+ tunable color-center laser for the 830–1060–nm spectral range pumped by second-harmonic radiation from a neodymium laser,”Applied Optics, vol. 34, no. 27, pp. 6114–6117, 1995.
[33]Y. Obayashi, et al. “Red and green distributed-feedback LiF color center lasers fabricated by interference of femtosecond laser pulses,”The Review of Laser Engineering, vol. 36, pp. 1226– 1229, 2008.
[34]M. Sakakura, Y. Shimotsuma, N. Fukuda, K. Miura, “Transient strain distributions during femtosecond laser-induced