Crop Breeding and Applied Biotechnology 12: 60-66, 2012 Brazilian Society of Plant Breeding. Printed in Brazil
Received 4 May 2010
Accepted 30 June 2011
QTL detection of yield-related traits of cashew
José Jaime Vasconcelos Cavalcanti1*, Francisco Herbeth Costa dos Santos2, Fanuel Pereira da Silva2 and Cássia Renata Pinheiro3
NOTE
Abstract - The identification of quantitative trait loci (QTL) and marker-assisted selection with a view to breeding programs have aroused great interest, including for cashew improvement. This study identified QTL for yield-related traits: nut weight, male and hermaphrodite flowers. The traits were evaluated in 71 F1 genotypes of the cross CCP 1001 x CP 96. The methods of interval mapping and multiple QTL mapping were applied to identify QTL. Eleven QTL were detected: three for nut weight, four for male flowers and four for hermaphrodite flowers. The QTL accounted for 3.79 to 12.98 % of the total phenotypic variance and had phenotypic effects of -31.81 to 34.25 %. The potential for marker-assisted selection of the QTL hf-2f and hf-3m is great and the phenotypic effects and percentage of phenotypic variation higher than of the others.
Key words:Anacardium occidentale, genetic improvement, marked-assisted selection.
INTRODUCTION
1 Embrapa Algodão, CP 174, 58.428-095, Campina Grande, PB, Brazil. *E-mail: jaime@cnpa.embrapa.br 2 Universidade Federal do Ceará, Departamento de Fitotecnia, CP 6035, 60.451-970, Fortaleza, CE, Brasil 3 Universidade de São Paulo, Departamento de Genética, CP 83, 13.418-900, Piracicaba, SP, Brasil
The cashew tree (Anacardium occidentale L.) is a species widely grown in the semi-arid regions of northeastern Brazil and is an important source of employment and income in the states of Ceara, Piaui and Rio Grande do Norte. However, one of the main difficulties in cashew orchards is the low productivity (Paula Pessoa et al. 1995, Ferreira-Silva et al. 2009). To solve this problem, the efforts of the Brazilian breeding program have been focused on the development of more productive cashew cultivars. The reduced number of genotypes in use, originated froma narrow genetic base, indicates genetic vulnerability, in view of the expansion of cashewto different agro-systems in Brazil, due to the success of the crop. In this sense, the
With the development of genetic maps and statistical approaches to the mapping of quantitative trait loci (QTL), genetic loci controlling complex traits can be identified and screened. Information of QTL mapping provides the minimum number of genetic loci that may be related to a particular trait, the location on the genetic map of these loci and estimates of their effects on the trait, which are useful information for breeders. Molecular markers associated with QTL may be useful in assisted selection to develop new cultivars (Timmerman-Vaughan et al. 2005). Based on the a priori knowledge of linkage between marker loci and yield traits, undesirable plants can be eliminated from the progeny group in early stages, i.e., when the seedlings develop the first leaves (Wang et al. 2000). This makes the selection process more efficient, reducing the number of plants and progenies to be evaluated and the time required until a clone is finally released for commercial production resulting in cost savings.
A QTL analysis must begin with the construction of a genetic linkage map with a sufficiently high density of molecular markers for a representative genome coverage (Kenis and Keulemans 2005). Genetic maps were developed for cashew by Cavalcanti and Wilkinson (2007), using a population of 85 F1 plants from the cross between the dwarf cashew clone CCP 1001 and the mother plant of common cashew CP 96. These maps represent an initial platform for the identification of QTL associated with economically important traits of this crop.
Marker-assisted selection is particularly promising for cashew improvement, since it may contribute to the solution of specific problems, being faster, cheaper and more efficient. Due to the genetic complexity of cashew yield, the detection of QTL is rather difficult, since this trait is highly polygenic and influenced by the environment. To overcome this problem, the purpose of this study was to identify QTL of yield-related traits with a simpler genetic basis i.e., controlled by fewer genes and less affected by environmental interference, e.g.: nut weight, male and hermaphrodite flowers.
MATERIAL AND METHODS
The experiment was conducted in an experimental area of Embrapa Agroindústria Tropical /Embrapa Tropical agroindustry, in Pacajus, CE, Brazil, in 2006 (lat
4° 10' S, long 38° 27' W and alt 60 m asl). The climate is predominantly dry/sub-humid (C2), according to the Thornthwaite climate classification. The average rainfall is 1,100 mm per year, mostly concentrated in summer/ fall. The soil of the experimental area is Eutrophic Red Yellow Podzolic with weak A horizon and sandy/medium texture.
The cashew population consisted of 85 F1 full-sib progenies, from a controlled cross between CCP 1001 and CP 96, in September 2000, planted in March 2001. The female parent CCP 1001 is a commercial dwarf cashew clone CP 96 and the male parent genotype a giant cashew tree, both from the Cashew genebank of Embrapa Tropical Agroindustry. Of the population, 71 plants were evaluated and mapped under field conditions. To obtain the nut weight, a sample of 20 nuts per plant was weighed on a digital balance Mark 3100, and the results expressed in grams. The number of male and hermaphrodite flowers was determined based on four panicles per plant, from the mid-third of the plant, i.e., one from each cardinal point.
The QTL were mapped using Multiple QTL Mapping (MQM) analysis (Janser 1993, Janser 1994, Janser and Stam 1994), an extension of Interval Mapping (IM) analysis (Lander and Botstein 1989). The analyses considered all markers of genetic linkage maps developed by Cavalcanti and Wilkinson (2007). The maps were constructed based on the methodology of the pseudo-testcross for markers segregating at a ratio of 1:1 (Grattapaglia and Sederoff 1994) and markers with different classes of segregation (ratio 3:1, 1:2:1 and 1:1:1: 1), according to Maliepaard et al. (1997). A total of 205 genetic markers were used, with 194 AFLP and 11 SSR. Two maps were constructed separately, representing each genome of the parents (i.e. CCP 1001 and CP 96). The QTL were detected and mapped using software MapQTL 5 (Van Ooijen 2004).
defined by confidence intervals of 1.0 and LOD score of 2.0, corresponding to a probability of 90 and 95 %, respectively. These were located on maps using software MapChart (Voorrips 2002). The proportion of phenotypic variation explained by the trait-marker association was estimated by the formula (Ukrainetz et
al. 2008): where R2 is the coefficient of
determination for the proportion of variation explained by the QTL; SSG is the sum of squares of the genotype (QTL); and SSTotal is the total sum of squares.
The phenotypic effect of the QTL-associated marker was estimated by the equation (Broman
2001): where PE (%):
percentage of phenotypic effect; : mean of the subpopulation consisting of genotypes with the marker;and : mean of the subpopulation consisting of genotypes withno marker.
RESULTS AND DISCUSSION
The range of variation in the plants was great for all traits (nut weight 4-11 g, male flowers 10-59, hermaphrodite flowers 1-27), confirming the quantitative character of these traits and consequently demonstrating the viability of this population for genetic mapping studies to identify QTL associated to the traits under study (Figure 1).
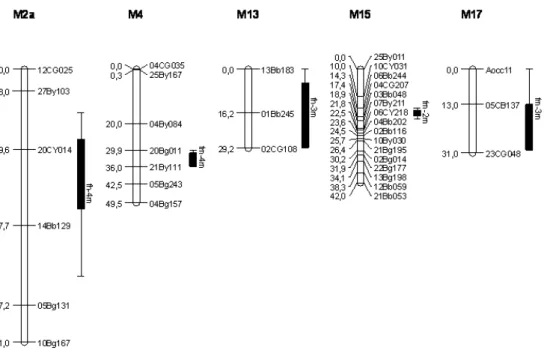
The QTL mapping analysis detected 11 loci with LOD score 3.0 (Table 1, Figures 2 and 3); three associated with QTL for nut weight (NW), four for male flowers (MF) and four for hermaphrodite flowers (HF). The proportion of variation of a trait explained by an individual QTL is probably the most important obstacle to the implementation of marker-assisted selection. In this study, the percentages of phenotypic variation (R2) explained by the associations between the marker locus and the QTL ranged from 4.55 to 9.95 % for NW, 3.79 to 9.85 % for MF and 6, 04 to 12.98 % for HF (Table 1). Most QTL studies reveal moderate effects (R2 of 10 – 20 %) in one or few loci, while several other loci explain less than 10 % of the variation (Anderson et al. 2007), as similarly observed in this study, where only the R2 effects of the QTL hf-2f and hf-3m were moderate (12.98 and 10.11 %, respectively). Most QTL identified explained less than 10 % of the variation, i.e, small-effect QTL. Similar results have been reported in
studies on QTL of yield traits in other crops (Siviero et al. 2002, Zalapa et al. 2007).
Table 1. QTL description for yield traits detected in the maps of the female (F) and male parents (M), by the method of multiple QTL mapping
1 QTL position based on the maximum LOD score; 2 R2: percentage of the total phenotypic variation explained by the marker closest to the QTL; 3 PE: phenotypic effect.
Figure 2. Location of the QTL identified for yield traits on the linkage map of the female parent – CCP 1001. On the right and left side of the linkage group the marker identification and its position (cM), respectively. Vertical bars and line segment to the right of the linkage group define the confidence intervals at levels of 90 % (LOD 1.0) and 95 % (LOD 2.0), respectively. nw: nut weight; mf: male flowers; hf: hermaphrodite flowers.
% for NW, -20.41 to 17.08 % for MF and -31.81 to 34.25 % for HF (Table 1). These results reflect the importance of the QTL identified in the trait expression and strongly support the existence of true QTL.
The purpose of the cashew breeding program is to increase the traitsNWand HF, and reduce MF. In this sense, for the first two,plants should be selected with the presence of markers associated with QTL with positive phenotypic effects (nw-1f, nw-2f, nw-3f, hf-1f, hf-3m and hf-4m) and absence of markers associated with QTL with negative effects (hf-2f). ForMF, plants with markers for negative QTL (mf-1f and mf-2m) and absence of markers for positive QTL (mf-3m and mf-4m) should be selected.
The low number of genotypes assessed certainly affected the estimates, particularly overestimating the QTLeffects and underestimating the number of QTL identified. Another important aspect is the effect of QTL x environment interaction, which according to Bernard (2008) may alter QTL detection and estimates when the evaluation environment is changed, although minor problems are expected for these traits, as the heritability estimates are high. Regardless of these considerations, the QTL detected in this study provide important information for the cashew breeding program.
It is therefore suggested that the QTLidentified should be validated using other populations and environments with a view to a routine use in cashew breeding program to identify desirable genotypes. This will increase the selection efficiency, as plants are selected when still in the nursery stage and the possibility of obtaining elite populations with higher yields and better product quality is greater.
CONCLUSIONS
1. Three QTL candidates were detected for nut w e i g h t , f o u r f o r m a l e f l o w e r s a n d f o u r f o r hermaphrodite flowers, explaining 3.79 to 12.98 % of the total phenotypic variation associated with significant phenotypic effects.
2. These QTL can be used in marker-assisted selection. However, further studies are required to validate the QTL detected in this study.
ACKNOWLEDGEMENTS
The authors thank the National Council for Scientific and Technological Development (CNPq) for financial support.
Identificação de QTLs relacionados a caracteres de componentes de
produção do cajueiro
Resumo - A identificação de locos de caráter quantitativo (QTLs) e a seleção assistida por marcadores têm despertado grande interesse em programas de melhoramento, inclusive para o cajueiro. Esta pesquisa objetivou identificar QTLs relacionados a características de componentes de produção: peso da castanha, flores masculinas e hermafroditas. Avaliaram-se 71 plantas F1 originadas do cruzamento CCP 1001 x CP 96. Para a detecção de QTLs foram utilizadas as metodologias de mapeamento de intervalo e mapeamento de QTLs múltiplos. Onze QTLs foram identificados: três para peso da castanha, quatro para flores masculinas e quatro para flores hermafroditas. Os QTLs explicaram entre 3,79 e 12,98 % da variação fenotípica total e apresentaram efeito fenotípico variando entre -31,81 e 34,25 %. Os QTLs fh-2f e fh-3m têm grande potencial para seleção assistida por marcadores, apresentando os maiores efeitos fenotípicos e as maiores explicações da variação fenotípica.
Palavras-chave: Anacardium occidentale, melhoramento genético, seleção assistida por marcadores.
REFERENCES
Anderson JA, Chao S and Liu S (2007) Molecular breeding
using a major QTL for Fusariumhead blight resistance in
wheat. Crop Science 47: 112-119.
Barros LM, Cavalcanti JJV, Paiva JR and Crisóstomo JR
(2009) Hibridação de caju. In Borém A (ed.) Hibridação
artificial de plantas. Editora UFV, Viçosa, p. 214-250.
Bernardo R (2008) Molecular markers and selection for complex traits in plants: learning from the last 20 years. Crop Science48: 1649-1664.
Broman KW (2001) Review of statistical methods for QTL
mapping in experimental crosses. Lab Animal30: 44-52.
Cavalcanti JJV and Wilkinson MJ (2007) The first genetic
maps of cashew (Anacardium occidentale L.). Euphytica
157: 131-143.
Cavalcanti JJV, Pinto CABP, Crisostómo JR and Ferreira DF (2000) Análise dialélica para avaliação de híbridos
interpopulacionais de cajueiro. Pesquisa Agropecuária
Brasileira 35: 1567-1575.
Ferreira-Silva SL, Voigt EL, Viégas RA, Paiva JR and Silveira JAG (2009) Influência de porta-enxertos na resistência
de mudas de cajueiro ao estresse salino. Pesquisa
Agropecuária Brasileira 44: 361-367.
Grattapaglia D and Sederoff R (1994) Genetic linkage maps of Eucalyptus grandis and Eucalyptus urophylla using a pseudo-testcross: mapping strategy and RAPD markers. Genetics137: 1121-1137.
Janser RC (1993) Interval mapping of multiple quantitative trait loci. Genetics 135: 205-211.
Janser RC (1994) Controlling the type I and type II errors in mapping quantitative trait loci. Genetics 138: 871-881.
Janser RC and Stam P (1994) High resolution of quantitative traits into multiple loci via interval mapping. Genetics
136: 1447-1455.
Kenis K and Keulemans J (2005) Genetic linkage maps of two apple cultivars (Malus x domestica Borkh.) based on
AFLP and microsatellite markers. Molecular Breeding
15: 205-219.
Lander ES and Botstein D (1989) Mapping Mendelian factors underlying quantitative traits using RFLP linkage maps. Genetics121: 185-199.
Maliepaard C, Janser J and Ooijen JWV (1997) Linkage analysis in a full-sib family of an outbreeding plant species:
overview and consequences for applications. Genetical
Research 70: 237-250
Melo LC, Santos JB and Ferreira DF (2002) Mapping and stability of QTL for seed weight in common beans under
different environments. Crop Breeding and Applied
Biotechnology2: 227-236.
Paiva JR, Barros LM, Cavalcanti JJV, Lima AC, Corrêa MCM, Melo DS and Porto ZB (2005) Seleção de clones de cajueiro-anão precoce para plantio comercial no Município de Aracati, CE. Ciência Agronômica 36: 338-343.
Paiva JR, Crisóstomo JR and Barros LM (2003) Recursos
Paula Pessoa PFA, Leite LAS and Pimentel CRM (1995) Situação atual e perspectivas da agroindústria do caju. In
Araújo JPP and Silva VV (eds.) Cajucultura: modernas
técnicas de produção. Embrapa Agroindústria Tropical, Fortaleza, p. 23-42.
Siviero A, Cristofani M, Boava LP and Machado MA (2002) Mapeamento de QTL associados à produção de frutos e sementes em híbridos de Citrus sunki vs. Poncirustrifoliata. Revista Brasileira de Fruticultura 24: 741-743.
Timmerman-Vaughan GM, Mills A, Whitfield C, Frew T, Butler R, Murray S, Lakeman M, Mccallum J, Russell A and Wilson D (2005) Linkage mapping of QTL for seed yield, yield components, and developmental traits in pea. Crop Science 45: 1136-1344.
Ukrainetz NK, Ritland K and Mansfield SD (2008) Identification of quantitative trait loci for wood quality and growth across eight full-sib coastal Douglas-fir families. Tree Genetics & Genomes 4: 159-170.
Van Ooijen JW (2004) MapQTL 5: Software for mapping of
quantitative trait loci in experimental populations. Wageningen, Kyazma B.V.
Voorrips RE (2002) MapChart. Software for the graphical
presentation of linkage maps and QTLs. Journal of
Heredity93: 77-78.
Wang D, Karle R and Iezzoni AF (2000) QTL analysis of
flower and fruit traits in sour cherry. Theoretical and
Applied Genetics 100: 535-544.
Zalapa JE, Staub JE, McCreight JD, Chung SM and Cuevas H (2007) Detection of QTL for yield-related traits using recombinant inbred lines derived from exotic and elite US
Western Shipping melon germplasm. Theoretical and