Vol.50, n. 2 : pp.329-337, March 2007
ISSN 1516-8913 Printed in Brazil BRAZILIAN ARCHIVES OF
BIOLOGY AND TECHNOLOGY
A N I N T E R N A T I O N A L J O U R N A L
The Potential of Denitrification for the Stabilization of
Activated Sludge Processes Affected by Low Alkalinity
Problems
Heike Hoffmann*, Tatiana Barbosa da Costa, Delmira Beatriz Wolff, Christoph Platzer and Rejane Helena Ribeiro da Costa
Departamento da Engenharia Sanitária e Ambiental; Universidade Federal de Santa Catarina; Campus Universitário Trindade; [email protected]; 88010-970; Florianópolis- SC - Brasil
ABSTRACT
In this study, the problems provoked by nitrification of wastewater with low alkalinity were analyzed in a pilot sequencing batch activated sludge reactor (SBR). Decrease in pH resulted in disappearence of protozoa. De-flocculation of the activated sludge floc started below pH 6.5, resulting in enhanced effluent turbidity and loss of bacteria. Nitrification efficiency was affected below pH 6.2. The denitrification activity was not sufficient to keep up the pH, due to a low C/N ratio of the wastewater. Based on alkalinity and ammonia concentration of the wastewater and the necessary denitrification rate to prevent operational problems, was developed a prognostic diagram. The applicability of this diagram was tested for the SBR with excellent results. The diagram could be applied to optimize the operation of wastewater treatment plants affected by problems with low alkalinity wastewater.
Key words: Alkalinity, activated sludge, nitrification, denitrification
* Author for correspondence
INTRODUCTION
Brazilian environmental legislation contemplates
an ammonium reduction down to 20 mg NH4-N/ L
(CONAMA, 2005). To fulfill this requirement, only the nitrification of wastewater is necessary. The nitrification is the oxidation of ammonia to nitrate but ammonia has more harmful effects on natural water systems than nitrate. The activated sludge system is the most used treatment among the available systems to achieve nitrification. To guarantee nitrification, activated sludge systems need relatively large volumes and a sufficient aeration, due to the low growth rate of the nitrifying bacteria, and their high sensitivity against alterations of pH, lack of oxygen, high
organic loads and toxic substances and low temperatures (Nitrogen Control, 1993, Wolff et al., 2005).
/L in the effluent is the limit in order to avoid operational problems in the treatment process, as deflocculation or destruction of activated sludge flocs. The pH can be stabilized with a continuous addition of carbonate (lime). A more economic solution would be the stabilization of the process
through the use of denitrification. The
denitrification process has the capacity to recuperate half of the lost alkalinity in result of nitrification (ATV-Manual, 1997; Von Sperling, 1997). Although denitrification is not demanded by the Brazilian legislation (CONAMA, 2005), it is absolutely recommendable for all activated sludge systems, because of its economic and operational advantages, such as: lower production of excess sludge, less energy for the aeration, better settling of the sludge and besides of all facts, denitrification can be integrated easily in the activated sludge process, especially in the SBR-Process (ATV-Manual, 1997, Nitrogen Control, 1993). The denitrification capacity of wastewater treatment is always limited by two factors. The first limitation is the C (COD): N (TKN) ratio of the wastewater. A relation of 10 C to 1 N is considered sufficient for a full denitrification
(ATV-Manual, 1997). On the other hand, a 100% denitrification is not possible, due to the configuration of activated sludge systems, which is the second limitation. The only way to achieve a 100 % denitrification is a post-denitrification using an artificial carbon source. The most common configuration without carbon source is the
pre-denitrification, where the efficiency of
denitrification depends on the volume of return sludge flow:
ηηηηDN = VSR+RC / (VSR+RC + 1) (1)
where : VSR+RC = Volume of sludge return and sludge recirculation flow (ATV-Manual, 1997). Another possibility is the cascade denitrification where the efficiency of denitrification depends on the number of cascades.
ηηηηDN = 1 - (1/ (nC (1 + VSR)), (2) where nC = number of cascades
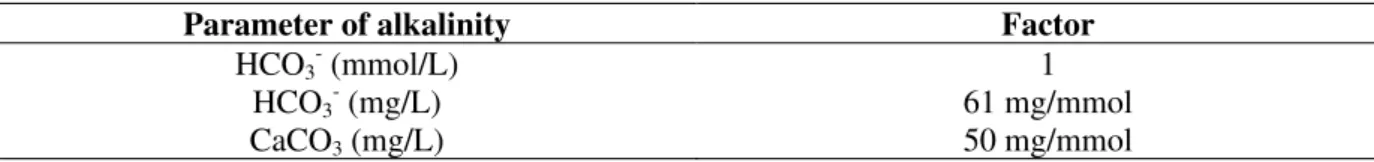
VSR = Volume of sludge return flow The alkalinity depends on the relation between bicarbonate and carbonic gas and it is determined by the amount of HCl necessary to adjust 1 liter of water to a pH of 4.3. Depending on the type of carbonate, there are different parameters with different dimensions, as shown in Table 1.
Table 1 - Equivalent parameters of alkalinity: Ks (ATV Manual 1997)
Parameter of alkalinity Factor
HCO3- (mmol/L) 1
HCO3- (mg/L) 61 mg/mmol
CaCO3 (mg/L) 50 mg/mmol
The alkalinity of wastewater results directly of the
alkalinity of the drinking water. The
ammonification (or TKN hydrolysis) increases the alkalinity of the wastewater:
NTK + H2O NH4 +
+ OH- (3)
Von Sperling (1997) mentioned the alkalinity of raw wastewater in Brazil with 110-170 mg CaCO3/L, (or 2.2 – 3.4 mmol HCO3- /L). This is, for example, half of the alkalinity of common wastewater in Germany (ATV manual, 1997). The nitrification process consumes alkalinity; the nitrification of 1 mol NH4-N produces exactly 2
mol of H+:
NH4 +
+ 2O2 NO3
+ H2O + 2H +
(4)
The bicarbonate/carbonic gas system reacts in the form:
2 H+ + 2 HCO3- 2 H2O + 2 CO2 (5)
By this 1 mol NH4+ (14 mg NH4-N/L) uses 2 mol HCO3- (or 122 mg HCO3-/L, or 100 mg CaCO3/L), what means that 1 mg NH4-N/L consumes 0.14
mmol HCO3-/L (7.14 mg CaCO3/L). As the
also increases the alkalinity (adapted of the ATV Manual, 1997):
NO3
+ H+ 0.5 N2 + 0.5 H2O + 2.5 (O) (6)
That means that the denitrification of 1 mol nitrate recuperated 1 mol HCO3, (or 0.07 mmol HCO3-/L or 3.57 mg CaCO3/L for 1 mg NO3-N/L) accurately the half of what was used for the nitrate production.
It can be concluded that the final alkalinity after the biological process in a nitrifying reactor depends on the natural alkalinity (Ks) and the
ammonia concentration (NH4-No) of the
wastewater. The difference between the
ammonium concentration of the wastewater (NH4-No) and the treated effluent (NH4-Ne) is the
resulting nitrate concentration (NO3-Ne).
Considering these facts the calculation for the alkalinity in the effluent (Ks,e) follows the equation (Manual ATV 1997):
Kse = Kso – 0.07 (NH4-No – NH4-Ne +NO3-Ne) mmol HCO3- /L (7)
Kse = Kso – 3.57 (NH4-No – NH4-Ne +NO3-Ne)
mg CaCO3
/L (8)
The concentration of NH4-N which is oxidized to NO3-N and not reduced (denitrification) has to be considered twice (because 2 mol H+ are produced), while the concentration of NH4-N, which is
oxidized and reduced to N2 gas has to be
considered only once (because 1mol H+ is
recuperated). This correlation was used for the evaluation of the alkalinity in system RSB.
The objective of this work was to analyze the potential of denitrification on the stabilization of the activated sludge process operating with wastewater with low alkalinity.
MATERIALS AND METHODS
SBR pilot reactor and integration of
denitrification
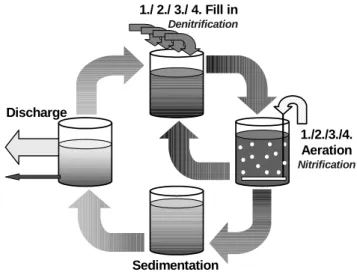
A pilot SBR with volume of 1.3 m³ was situated in the campus of the University (UFSC, Universidade Federal de Santa Catarina). It was operated with wastewater colleted from a public sewer. The wastewater was pretreated in a septic tank with a retention time of 2-3 days. The SBR worked in three cycles a day, each cycle of 8 h, receiving 400L wastewater (1,200 L per day). The operation of a full cycle (charge, aeration, settling and discharge) was totally automatic and in order to reach a efficient denitrification, the charge and aeration was divided in four steps (repeating the charge and aeration four times). Modeled on the well known cascade denitrification process, this SBR filling strategy was called "cascade filling". In order to obtain a total denitrification of resistant nitrate of the sludge (Fig. 1) the first chargeof the cycle was larger than the three following (1 x 250 L and 3 x 50 L).
1./ 2./ 3./ 4. Fill in Denitrification
1./2./3./4. Aeration Nitrification
Sedimentation Discharge
In order to determine a correlation of alkalinity and denitrification efficiency the following analyses program was carried out:
• Three times per week parameters of influent and
effluent: Alkalinity, COD and SS
according to the Standard Methods (1998); NH4 -N, NO3-N, NO2-N, PO4-P with colorimetric method (kit of Merck).
• Once a week a cycle of 8 h was analyzed, with control of pH, O2 and temperature and sampling at the end of the anoxic and aerobic phases (sample of filtered sludge) for analyses of: COD, NH4-N, NO3-N, NO2-N, and alkalinity.
• SVI30 (Sludge Volume Index) and microscopy analyses of the activated sludge were carried out once a week. After the first negative experiences with low pH values, for pH values below 7.0 lime was added. Approximately 50 g of lime per week were used to keep pH around 7.0.
Denitrification efficiency
According to Fig. 1 in the SBR process with the principle of cascade filling, theoretically only the volume of the last filling can’t be denitrified, that means a denitrification efficiency of :
ηηηηDN = 1 - ((Vfeed/ Vlaststep) (9) where Vfeed = Volume of total cycle filling
Vlast step = Volume of last step filling The pilot SBR with filling in four steps (350L : 50L) would have a theoretically maximum
denitrification efficiency of 87.5%.
RESULTS AND DISCUSSION
Operation of the pilot SBR
Nitrification started a week after the inoculation of the pilot reactor with activated sludge. After five weeks and temperatures around 20-25°C, the nitrification process was stabilized with effluent concentrations below 1 mg NH4-N/L. Probably the relatively long stabilization time was due to the low pH and other inhibitory factors. Without limewater addition, it was observed that:
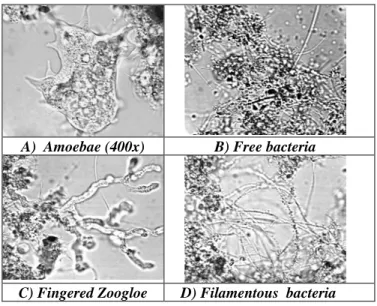
Between a pH of 6.8 - 6.0 the protozoa’s disappeared. The last surviving organisms were amoebae (Fig. 2A)
Below 6.5 the activated sludge flocs started to disintegrate (deflocculation), resulting in turbid effluent and enhanced bacterial loss
Between pH of 6.2 – 6.0 the nitrification was affected and an intensive growth of fingered and amorphous zoogleal organisms was observed (Fig. 2B).
Filamentous bacteria (Fig. 2D), like type 021N and sulfur bacteria (Jenkins et al., 1993) were observed during all the operation. This organism contributed to an increasing SVI30 (Sludge Volume Index), which increased from 120 to 180 mL/g, indicating bulking sludge and sedimentation problems.
A) Amoebae (400x) B) Free bacteria
C) Fingered Zoogloe D) Filamentous bacteria
The most important objective of further
investigations was the improvement of
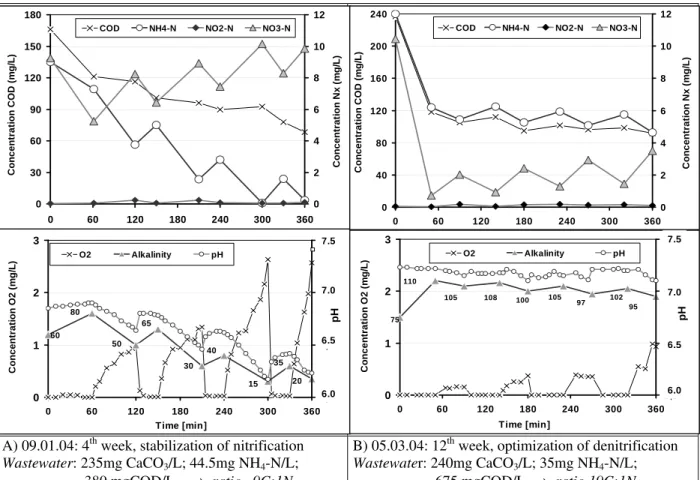
denitrification until the theoretical technical limitation of 87.5% (equation 9) to keep the pH constant without addition of lime. But the results showed that the denitrification was limited by the low COD/BOD5 concentration (low C/N ratio), reported also by Hoffmann et al (2004). Fig. 3A shows one of the first cycle results, done at the beginning of nitrification stabilization (4th week). The cycle in Fig. 3B was obtained two months later, accidentally a day with high COD concentration in wastewater.
Fig. 3A shows the same nitrification velocity in all the four aerated nitrification phases. The denitrification velocity was higher in the first anoxic phase with the higher organic load (250L wastewater) and decreased in the three following anoxic phases with load of 50L wastewater.
Although the denitrification seemed to have a high efficiency, nitrate concentration at the end of the cycle was higher than in the beginning. Sometimes nitrate concentration increased up to 20 mg NO3-N/L (Table 2).
The wastewater in Fig. 3B had a higher COD/N ratio. At first high loading phase, an efficient denitrification process was observed and at subsequent following phases, the denitrification was lower, but the cycle resulted in lower nitrate concentration than at the beginning. The problem in example 3B was the nitrification. To improve the denitrification, the aeration was reduced to guarantee the total absence of oxygen during the anoxic phases, as shown in the second diagram. With uncommonly high organic load of the wastewater, this aeration was not sufficient for total nitrification; the nitrification was limited by the oxygen lack.
A) 09.01.04: 4th week, stabilization of nitrification Wastewater: 235mg CaCO3/L; 44.5mg NH4-N/L; 380 mgCOD/L, → ratio 9C:1N
B) 05.03.04: 12th week, optimization of denitrification Wastewater: 240mg CaCO3/L; 35mg NH4-N/L; 675 mgCOD/L, → ratio 19C:1N
Figure 3 - Results of monitoring of 2 cycles of 8 h (6 h denitrification and nitrification, 1 h sedimentation and 1 h for removing of treated wastewater)
Also, the alkalinity and the pH were analyzed, (Fig. 3). For better visualization, the alkalinity in
0 1 2 3
0 60 120 180 240 300 360
Time [min]
6,0 6,5 7,0 7,5
O2 Alkalinity pH
60 80 50 65 15 40 30 35 20 C on c e nt ra ti on O 2 ( m g/ L ) 6.5 6.0 7.5 7.0 p H 0 30 60 90 120 150 180
0 60 120 180 240 300 360
0 2 4 6 8 10 12
COD NH4-N NO2-N NO3-N
C on c e n tr a ti on C O D ( m g /L) C o nc e nt ra ti o n N x ( m g/ L ) 0 40 80 120 160 200 240
0 60 120 180 240 300 360
0 2 4 6 8 10 12
COD NH4-N NO2-N NO3-N
C o n c e n tr a ti o n C O D ( m g /L ) C o n c e n tr a ti o n N x ( m g /L ) 0 1 2 3
0 60 120 180 240 300 360
Time [min]
6,0 6,5 7,0 7,5
O2 Alkalinity pH
75 110
105 108 100 105
97 102 95
3A and 3B was calculated in mmol HCO3-/L (Table 1), the more common unit in Brazil being mg CaCO3/L, which was noted in the Figure. In Fig. 3A, the two parameters showed high alterations, pH and alkalinity increase clearly in the anoxic filling phase and decrease during the nitrification. As a result of the first nitrification phase, the alkalinity reduced to the recommended value for operation stability of 75 mg CaCO3/L. This cycle finished with 20 mg CaCO3/L. Alterations of this type characterized a wastewater with an insufficient natural alkalinity.
Fig. 3B did not show these high alterations of pH and alkalinity, whereas the alkalinity of the wastewater was nearly the same. The lower nitrification activity (lower concentration of NH4 -N0 in the wastewater as well as higher concentration of NH4-Ne in the effluent) and the strong increase of alkalinity in the first denitrification phase resulted in a stabilization of pH and in an alkalinity value above 75 mg CaCO3/L during the whole operation cycle.
Correlation between Nitrification, Alkalinity and Denitrification
The results of all of the monitoring cycles of the pilot SBR were analyzed through the equation 9, which calculated the theoretical alkalinity after nitrification and denitrification. The objective was to compare analytical results and the theoretical values. Table 2 shows the results of the analyses
and calculation during three months of
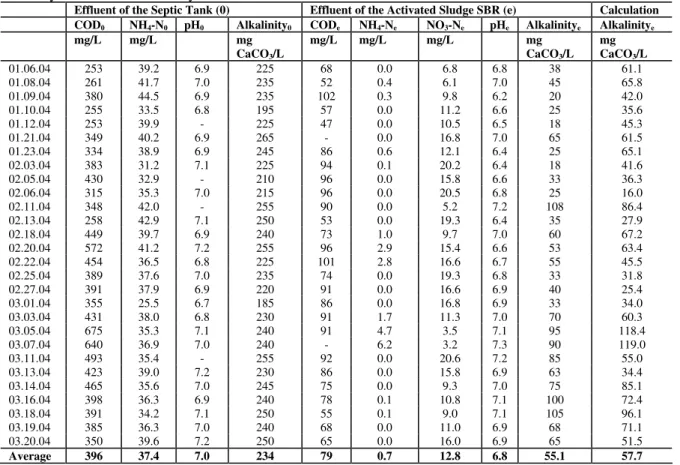
operation.After the anaerobic pretreatment in the septic tank, the wastewater showed an average alkalinity of 234 mg CaCO3/L, with a minimum of 185 mg CaCO3/L and a maximum of 275 mg CaCO3/L and a pH value of 7.0. The COD concentration in wastewater showed a variation between 253 and 673 mg COD/L, ammonia concentrations between 25.5 and 44.4 mg NH4-N/L, resulting in an average COD : N ration of about 10:1 but it is a well known fact that not the whole COD was available for denitrification. The treated effluent showed:
A concentration of 79 mg COD/L as non degradable COD in this process with a sludge age of 25 days.
An almost complete nitrification was achieved. Some times the higher ammonia effluent concentrations were provoked by an insufficient aeration.
The average denitrification efficiency was about 65%, with nitrate concentration in the treated effluent of 12.8 mg NO3-N/L (Table 2).
Even on days with higher denitrification rates, as the day 09/01/04 (Table 2 and Fig. 3A) with 78% denitrification, a decreasing alkalinity during the cycle was observed, due to the total nitrification of the wastewater with high ammonia concentration (44.5 mg NH4-N) and low alkalinity (235 CaCO3/L) on this day. The days with high alkalinity and low ammonia concentration, for example at days 05/03, 07/03, 11/03, 14/03, 16/03 and 18/03/04 the alkalinity in the reactor was kept above 75 mg CaCO3/L, which was the limit for stable operation. In most of the days, the alkalinity of the treated wastewater was below this limit at the end of the process (Table 2).
The last column shows the result of the calculation of the value of theoretical alkalinity at the end of the process (Ks,e , given in equation 8). A good correlation between the real and theoretical value was observed, even if 5% higher values were analyzed with calculation. The reduced alkalinity in the real treatment could be explained for example by the formation of organic acids and H2S in the septic tank. Analyses showed concentrations up to 50 mg H2S/ L in the effluent of septic tank. In one case presence of filamentous sulfur bacteria was also noted in the activated sludge system (Fig. 2D) which oxidized sulfite (S2-) in the aerobic phase to sulfate (SO42-) (Jenkins et al. 1997). Despite this temporary problem, there were cycles with good accordance between the calculated and analyzed value of alkalinity, as on the days 21/01, 5/02, 11/02, 13/02, 20/02, 25/02, 01/03, 13/03, 14/03, 18/03, 19/03 and 20/03.
Table 2 -Characterization of influent and effluent wastewater of the pilot SBR and comparison of the calculated alkalinity with the real alkalinity
Effluent of the Septic Tank (0) Effluent of the Activated Sludge SBR (e) Calculation COD0 NH4-N0 pH0 Alkalinity0 CODe NH4-Ne NO3-Ne pHe Alkalinitye Alkalinitye
mg/L mg/L mg
CaCO3/L
mg/L mg/L mg/L mg
CaCO3/L
mg CaCO3/L
01.06.04 253 39.2 6.9 225 68 0.0 6.8 6.8 38 61.1
01.08.04 261 41.7 7.0 235 52 0.4 6.1 7.0 45 65.8
01.09.04 380 44.5 6.9 235 102 0.3 9.8 6.2 20 42.0
01.10.04 255 33.5 6.8 195 57 0.0 11.2 6.6 25 35.6
01.12.04 253 39.9 - 225 47 0.0 10.5 6.5 18 45.3
01.21.04 349 40.2 6.9 265 - 0.0 16.8 7.0 65 61.5
01.23.04 334 38.9 6.9 245 86 0.6 12.1 6.4 25 65.1
02.03.04 383 31.2 7.1 225 94 0.1 20.2 6.4 18 41.6
02.05.04 430 32.9 - 210 96 0.0 15.8 6.6 33 36.3
02.06.04 315 35.3 7.0 215 96 0.0 20.5 6.8 25 16.0
02.11.04 348 42.0 - 255 90 0.0 5.2 7.2 108 86.4
02.13.04 258 42.9 7.1 250 53 0.0 19.3 6.4 35 27.9
02.18.04 449 39.7 6.9 240 73 1.0 9.7 7.0 60 67.2
02.20.04 572 41.2 7.2 255 96 2.9 15.4 6.6 53 63.4
02.22.04 454 36.5 6.8 225 101 2.8 16.6 6.7 55 45.5
02.25.04 389 37.6 7.0 235 74 0.0 19.3 6.8 33 31.8
02.27.04 391 37.9 6.9 220 91 0.0 16.6 6.9 40 25.4
03.01.04 355 25.5 6.7 185 86 0.0 16.8 6.9 33 34.0
03.03.04 431 38.0 6.8 230 91 1.7 11.3 7.0 70 60.3
03.05.04 675 35.3 7.1 240 91 4.7 3.5 7.1 95 118.4
03.07.04 640 36.9 7.0 240 - 6.2 3.2 7.3 90 119.0
03.11.04 493 35.4 - 255 92 0.0 20.6 7.2 85 55.0
03.13.04 423 39.0 7.2 230 86 0.0 15.8 6.9 63 34.4
03.14.04 465 35.6 7.0 245 75 0.0 9.3 7.0 75 85.1
03.16.04 398 36.3 6.9 240 78 0.1 10.8 7.1 100 72.4
03.18.04 391 34.2 7.1 250 55 0.1 9.0 7.1 105 96.1
03.19.04 385 36.3 7.0 240 68 0.0 11.0 6.9 68 71.1
03.20.04 350 39.6 7.2 250 65 0.0 16.0 6.9 65 51.5
Average 396 37.4 7.0 234 79 0.7 12.8 6.8 55.1 57.7
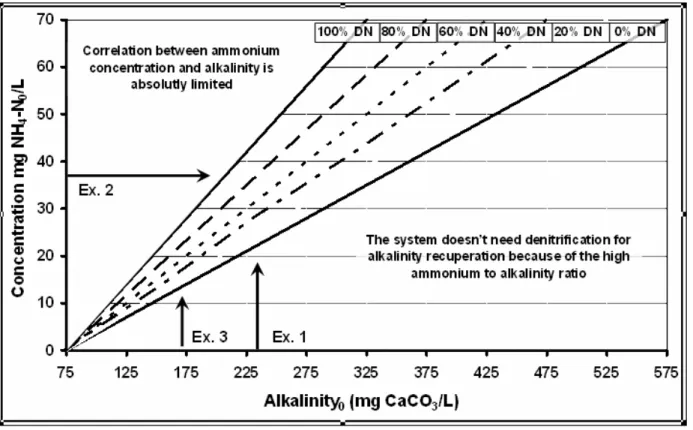
It was calculated 100% nitrification (100% oxidation of ammonia-N to nitrate-N), as it was normal for dimensioning of wastewater treatment plant. Fig. 4 shows the result of the calculation. The area below the line "without DN" was characterized by such an high ammonia to alkalinity ratio that did not need denitrification for alkalinity recuperation. The area above the line "100% DN" characterized the area where the correlation between ammonia concentration and alkalinity was limited and even in case of 100% denitrification the alkalinity would be reduced below 75 mg CaCO3/L. However, a denitrification of 100% only could be reached with a post-denitrification by an additional carbon source. The denitrification rates between these two limits (20, 40, 60 and 80%) determined the possibility to keep the alkalinity and pH (Fig. 4):
1 Example 1: The wastewater in case of the investigated pilot SBR with 235 mg CaCO3/L (Table 2) would not need any denitrification until a nitrification of 22 mg NH4-N/L. The denitrification of 65% would be sufficient to neutralize the acid, produced as a result of
nitrification of 32 mg NH4-N in the influent wastewater.
2 Example 2: In reality the pilot plant had to nitrify on average 37.4 mg NH4-N /L, (Table 2) this would need about 80% denitrification with the given alkalinity of 235 CaCO3/L (example 1). With the realized denitrification of 65%, an alkalinity of approximately 260 CaCO3/L would be necessary to stabilize the operation.
3 Example 3: According Von Sperling (1997), an
alkalinity of 170 mg CaCO3/L is normal in the Brazilian wastewater. Corresponding to the
calculation, a nitrification of only
Figure 4 - Prognostic diagram for the denitrification necessity, resulting of the necessity to keep the alkalinity in the rector above of 75 mg CaCO3/L
CONCLUSION
The results obtained with an activated sludge of a pilot SBR showed that decreasing values of pH, provoked by acid formation during the nitrification have negative effects of process stability, destruction of activated sludge flocs was observed and the loss of active biomass. Alkalinity of more than 75 mg CaCO3/L could prevent the rise of pH during the operation. The wastewater with the average alkalinity of 234 mg CaCO3/L and ammonium concentration of 37 mg NH4-N/L did not have a sufficient natural alkalinity to keep up the pH during the nitrification process. The presented diagram showed that a constant denitrification of at least 80% would be necessary to keep up the pH. This would be the absolute maximum for a denitrification without external carbon sources. In the pilot SBR with the principle of cascade filling in three steps, a denitrification of 87%
increased the pH significantly and hence, it was a secure way to prevent operational problems. It could save energy and produce lower sludge excess volume in activated sludge systems.
ACKNOWLEDGEMENTS
We thank to the CAPES and to the CNPq for the concession of grants, and to the German foundation "Oswald Schulze" and Rotária do Brasil Ltda. for the equipment supply.
RESUMO
Os problemas provocados pela nitrificação no esgoto com baixa alcalinidade foram analisados num reator piloto do tipo lodos ativados seqüencial por batelada (RSB), alimentado por esgoto urbano. A diminuição do pH se mostrou em três níveis: com pH de 6,8 - 6,0 os protozoários, responsáveis para a filtração da fase liquida, desaparecerem; os flocos de lodos ativados começaram a se destruir abaixo pH 6,5 resultando em elevação da turbidez no efluente final e abaixo de pH 6,2-6,0 a nitrificação foi afetada. A influência da desnitrificação para manter o pH foi analisada.
Devido a baixa relação C:N no esgoto pré-tratado, a desnitrificação não se mostrou suficiente para manter o pH estável. Este trabalho apresenta o cálculo da alcalinidade que considera a influência da nitrificação e desnitrificação, de acordo com os resultados obtidos no RSB. Baseado nesse cálculo, foi desenvolvida uma recomendação na forma
gráfica para usar em ETE´s afetadas por baixa alcalinidade.
REFERENCES
ATV Manual (1997). ATV Handbuch Biologische und Weitergehende Abwassereinigung 4. Auflage 1997, Ernst and Sohn, Berlin, ATV, Hennef (Germany).
CONAMA (2005): Conselho Nacional do Meio Ambiente, Resolução N°357, de 17 de março de 2005.
Hoffmann, H; Wolff; D.B.; Costa; T.B.; Weitz J.; Platzer, C.; Costa, R.H.R. (2004): Avaliação de Reatores Seqüenciais por Batelada do Tipo Lodo Ativado como Sistemas Descentralizados para a Remoção de Nutrientes, in IV Simpósio Internacional de Qualidade Ambiental, Porto Alegre. [CDROM].
Jenkins, D.; Richard, G.R.; Glen, T.D (1993): Manual on the causes and control of activated sludge bulking and foaming, 2nd Ed., Lewis Publishers Inc.
Nitrogen Control-EPA Manual (1993). Technomic Publishing, Pennsylvania, USA.
Standard Methods for the Examination of Water and Wastewater (1998) 20th Ed. APHA, AWWA, WEF. Washington, DC, USA.
Wolff, D.; Ochoa, J.C.; Paul, E.; Costa, R.H.R. (2005) Nitrification in Hybrid Reactor with a Recycled Plastic Support Material. Brazilian Archives of Biology and Technology, 48: Special n, 243-248.
Von Sperling, M. (1997) Lodos Ativados. Belo Horizonte: Departamento de Engenharia Sanitária e Ambiental, UFMG.