Universidade Federal de Uberlˆ
andia
Faculdade de Engenharia El´
etrica
Programa de P´
os-Graduac
¸˜
ao em Engenharia El´
etrica
Carlos Galv˜
ao Pinheiro J´
unior
Assistive technology for the severely motor impaired by
using online processing of motor unit action potentials
of facial muscles
Uberlˆ
andia - Minas Gerais
Carlos Galv˜
ao Pinheiro J´
unior
Assistive technology for the severely motor impaired by
using online processing of motor unit action potentials
of facial muscles
A Thesis submitted to the graduate program in Electrical Engineering of Universidade Federal de Uberlˆandia
for the degree of Doctor in Science.
Supervisor: Prof. Dr. Adriano de Oliveira Andrade
Co-Supervisor: Prof. Dr. Guy Bourhis
Carlos Galv˜
ao Pinheiro J´
unior
Assistive technology for the severely motor impaired by
using online processing of motor unit action potentials
of facial muscles
A Thesis submitted to the graduate program in Electrical Engineering of Universidade Federal de Uberlˆandia
for the degree of Doctor in Science.
Carlos Galv˜ao Pinheiro J´unior
Prof. Dr. Edgard A. Lamounier J´unior
Graduate program coordinator
Examining committee:
Prof. Dr. Adriano de Oliveira Andrade
Supervisor
Prof. Dr. Guy Bourhis
Co-supervisor
Prof. Dr. Alcimar Borbosa Soares Prof. Dr. Teodiano Freire Bastos Filho
Prof. Dr. Fran¸cois Cebestaing Prof. Dr. Eduardo Lazaro Martins Naves
Prof. Dr. Rui Loureiro Prof. Dr Yann Morere
Acknowledgment
At this point sitting in front of the computer I believe it is much harder to write this text than it was to write the thesis conclusion. More than methods, algorithms, equations I start to think about the people I met in the last years. And people are more important than any equation. By far!
I start thanking my supervisors Adriano de Oliveira Andrade and Guy Bourhis. They have showed me a new meaning for excellence and hard work. Their support were not restricted to technical matters and were of great importance during my stay at Metz and Uberlˆandia.
It is impossible to forget Prof. Adriano Alves helping me out to identify and eliminate the background noise that haunted me for months. Thank you, wizard!
To all friends at BioLab in Brazil, thank you for the healthy and pleasent work environment. Something quite unique indeed.
Life in a foreign country is not always easy. Fortunately, I’ve found amazing and helpful people at the LASC with patience and ready to help me out. I need to thank specially my fellows Fred and Amine for the interchange of knowledge and the funny talks at the end of the day.
Resumo
Em determinadas circunstˆancias, um indiv´ıduo pode ser privado de suas habilidades naturais, tais como andar e falar, no caso de amputa¸c˜oes, les˜oes na medula espinhal ou doen¸cas degenerativas. Dispositivos de tecnologia assistiva permitem que indiv´ıduos com restri¸c˜oes motoras a superem suas limita¸c˜oes promovendo maior independˆencia. Partic-ularmente adequados ao quadro de restri¸c˜ao motora severa, sinais bioel´etricos tem sido usados com sucesso para operar dispositivos de comunica¸c˜ao alternativa. Por mais de meio s´eculo, informa¸c˜oes extra´ıdas do sinal eletromiogr´afico com o prop´osito de operar um determinado dispositivo n˜ao considera a unidade b´asica do m´usculo: a unidade mo-tora. O objetivo deste estudo ´e investigar como a performance do operador ´e afetada ao utilizar informa¸c˜oes do sinal eletromiogr´afico provenientes diretamente de unidades mo-toras. A hiptese ´e que a metodologia proposta seja capaz de gerar sinais de controle mais precisos quando comparados com a abordagem tradicional que usa informa¸c˜oes globais obtidas por m´etodos tradicionais de aquisi¸c˜ao e tratamento do sinal eletromiogr´afico. Um sistema capaz de detectar e tratar os potenciais de a¸c˜ao de unidades motoras em tempo real foi desenvolvido, incluindo o projeto do eletrodo e a performance foi avaliada ao medir o tempo para execu¸c˜ao de tarefas de controle de cursor. As especifica¸c˜oes da tarefa de controle de cursor foram retiradas de um estudo anterior, que usava m´etodos tradicionais de processamento do sinal eletromiogr´afico. A compara¸c˜ao dos resultados dos dois estudos demonstrou que o novo m´etodo oferece melhor controle, sendo at´e 27% mais r´apido na tarefa mais dif´ıcil.
Palavras-chave: Eletromiografia, Tecnologia assistiva, Intera¸c˜ao
Abstract
In some circumstances, a person may be deprived of natural abilities, such as walking and speaking, perhaps due to limb amputation, spinal cord injuries (SCI), or degener-ative diseases. Assistive technology devices allows motor-impaired people to overcome their limitations promoting greater independence. Particularly suitable in the case of people with severe motor impairment, electrical biosignals have been successfully utilised to operate alternative communication devices. For over half a century, information ex-tracted from the electromyographic signal for the purpose of operating a given device has not considered the information provided by the basic unit of the muscle: the mo-tor unit. The objective of this study is to investigate how accessing information at motor unit level would improve the operator’s performance during a given task. The hypothesis is that the proposed methodology would allow generating more precise con-trol commands, when compared to traditional approaches relying on global information obtained by conventional electromyographic signal acquisition and processing. A system to detect motor unit action potentials from the electromyographic signal was devised, including the electrode design, and the performance evaluated by measuring the time taken to perform several cursor control tasks. The specifications of the cursor control task were extracted from a different study, which used the traditional electromyographic signal-processing approach. Comparing the results from both studies proved that the novel approach provides better control than the traditional one, being 27% faster in the most difficult task.
Contents
1 The use of electromyography in assistive technology 1
1.1 Assistive devices based on sEMG signals . . . 3
1.1.1 Switched-based control devices . . . 5
1.1.2 Cursor control . . . 7
1.1.3 Automatic speech recognition (ASR) . . . 14
1.2 The research objective . . . 17
1.3 Thesis structure . . . 18
1.4 Publications . . . 18
2 The electromyographic signal generation and acquisition 20 2.1 The motor unit . . . 21
2.2 The action potential . . . 23
2.3 sEMG signal . . . 26
2.4 Force control mechanisms . . . 27
2.5 Signal detection . . . 29
2.5.1 Electrode geometry . . . 31
2.5.2 Sampling Rate . . . 32
3.2 Signal pre-processing . . . 36
3.3 Data epoching . . . 39
3.4 Feature extraction tools . . . 42
3.5 Classification . . . 45
3.6 MUAP detection . . . 47
3.7 Using MUAP as source of information . . . 54
4 Experiment and Results 55 4.1 The proposed task . . . 56
4.2 Subject recruiting . . . 60
4.3 EMG acquisition and processing . . . 61
4.3.1 MUAP detection . . . 64
4.4 Protocol . . . 72
4.5 Results . . . 72
4.5.1 Time . . . 73
4.5.2 Path, Overshooting and Errors . . . 78
4.5.3 Improvements over the traditional method . . . 79
5 Conclusions 90 5.1 Discussion . . . 90
List of Figures
1.1 Forms of Augmentative and Alternative Communication. . . 3 1.2 Original approach by Fitts where the subject should tap a target (Width=W)
distant D units from the other target. . . 12 2.1 sEMG signal recorded at 10 kHz from the Frontalis muscle. By visual
inspection it was estimated that muscle activity begins at 0.2 s. . . 21 2.2 The motor unit is composed by thealpha-motoneuron and all the fibers
innervated by it. The motor end plate is the area where motor nerve fibers and muscle fibers meet. . . 22 2.3 Action potential . . . 23 2.4 Actual motor unit action potential recorded by the equipment used in
this study. The signal was acquired from a tetraplegic subject over the
Frontalis muscle and sampled at 10 kHz. . . 24 2.5 Activity of three motor units and the sum of those three signals when
2.6 EMG decomposition. The level of contraction rises from rest up to 40% of MVC. A total of 34 MUs enumerated in order of appearance and their MUAPs are observed at left. It is possible to see that they are sorted also based on their amplitude, reflecting the Henneman’s size principle. It is also possible to visualize the firing rate for each MU (colored bars) and how MUs recruited first have higher firing rate than the ones recruited last. Used with permission from the publisher. . . 29 2.7 Effect of increasing the electrode surface area. If it is increased, further
muscle fiber will be in range. . . 31 2.8 Two distinct action potentials recorded at 10 kHz are shown at left. The
two following images show the same action potentials subsampled at 2.5 kHz and 625 Hz. The loss of information is clear in the last case. . . 33 3.1 sEMG signal is acquired and epochs are extracted. Features are extracted
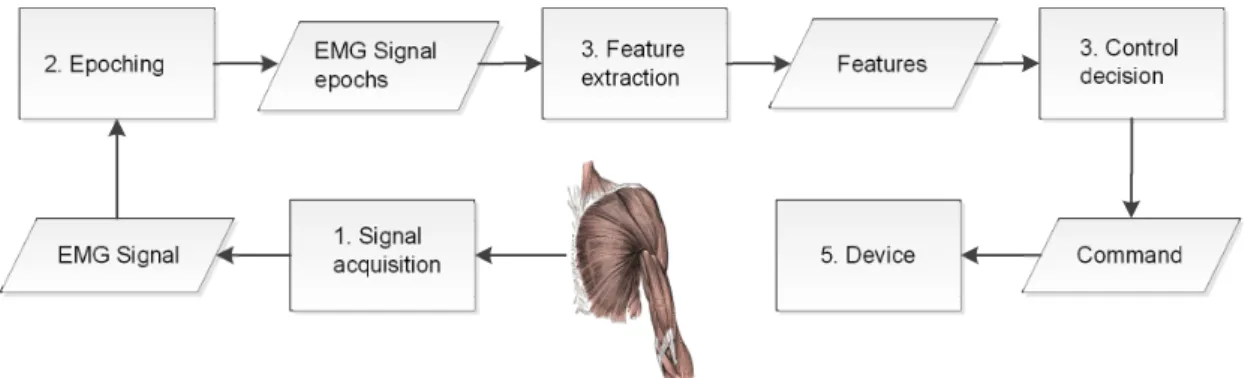
from epochs and feed a control decision system setting the command to the controlled device. . . 36 3.2 Original sEMG signal (gray) and the de-noised signal (black) using the
empiric mode decomposition method. acquired and epochs are extracted. Features are extracted from epochs and feed a control decision system setting the command to the controlled device. . . 38 3.3 EMG signal with 200 ms adjacent epochs. The signal was sampled at 10
kHz which is the rate the signal processing unit must work (10 thousand values per second). . . 39 3.4 EMG signal with 200 ms overlapping epochs and 100 ms increment time
3.5 sEMG signal (a) with adjacent epochs (b), and overlapping epochs with
τ=100 ms (c) and τ=20 ms (d). . . 41 3.6 The sEMG signal (a) was sampled at 10 kHz and presents areas of muscle
contraction (Area I) and rest (Area II). The PSD was estimated and the MNF calculated for each 500 ms epochs representing muscle contraction (b) and muscle resting (c). . . 44 3.7 Regions of activity detected using the signal envelope. . . 49 3.8 Regions of activity detected using variance. The information extracted
from the signal is affected by the size of the sliding window. . . 50 3.9 Regions of activity detected using amplitude and slope. During
depolar-ization and repolardepolar-ization, small amplitude are considered as part of the MUAPs because of the slope. . . 51 3.10 Regions of activity detected using amplitude. Gaps are created during
MUAPs in cases of small amplitude samples. Those imperfections must be corrected using a postprocessor that will fill gaps smaller than a threshold, e.g. 2 ms. . . 53 4.1 Timeline for both studies compared in this document. The first study
using traditional sEMG processing and interpretation, resulted in a sys-tem called Muscle Academy and it was developed in 2010 with results available in 2011. At the beginning of 2011, the software for the present study was finalized and trials were carried out in 2012. The results from both experiments are compared in 2013. . . 56 4.2 Interface screenshot. The image at the left shows the guidelines and
4.3 Simplified representation of the state machine. At state 1, the cursor stands by. The state 2 evokes the rotation procedure, rotating the cursor icon 90 clockwise. The state 3 evokes the click event and state 4 displace the cursor towards the direction indicated by the cursor. . . 57 4.4 The EFSM above controls the emulated mouse events. Two counters are
employed: TC and TR referring to contraction and relaxing, respectively. Those two counters are compared to two preset thresholds: THC and THR with values of 300 ms and 1 s. This EFSM is fed by the output of the sEMG signal processing, where input 0 refers to no activity and 1 to muscle contraction. . . 59 4.5 A signal with a long (approximately 1 s) and a short contraction
(approx-imately 200 ms). Above the graph, the numbers represent the state of the EFSM. The signal is interpreted as a cursor movement and a rotation. The click occurs only after the short contraction as the interval between both contractions is shorter than 1 s. States 2 and 3 are transitory and represent the rotate and click events, respectively. . . 60 4.6 The electrode was placed over the Frontalis muscle belly, at about 3 cm
above the eyebrow (a). The wire was fixed using a elastic band. (b) . . 62 4.7 Two first designed electrodes, with thin tips. . . 63 4.8 Concentric electrode with small inter-electrode distance offering high
se-lectivity. . . 63 4.9 Synthetic EMG signal composed by 3 (a) and 5 (b) motor units activity. 66 4.10 MUAP detection methods compared. 1 - Amplitude, 2 - Envelope
ampli-tude, 3 - Variance, 4 - Amplitude and slope . . . 67 4.11 The system overview. The sEMG signal is acquired and feature extraction
4.12 The control module composed by graphs of the signal acquired, the MUAPs detected and the binary commands generated. . . 69 4.13 Epochs of sEMG signals recorded during trials. A long contraction (a),
and a short contraction (b) from the same user. . . 70 4.14 Epochs of sEMG signals recorded from a candidate. Between two short
contractions (a), several MUAPs caused by involuntary muscle activity were detected (b). The zoomed area has at least three detectable MUAPs. 71 4.15 Learning curve represented by mean time for each one of the three
dif-ferent protocols using the novel method. Error bars represent the 95% confidence interval. Each point was estimated from the data of the 12 subjects in each session/protocol. . . 73 4.16 PCA analysis for: (a) the first session only, (b) the last session only and
(c) the five sessions overall. Subject 12 is tetraplegic and the subject 3 participated in both trials (traditional and novel method).The lines are the contour plot of the 2D gaussian surface estimated from the scores of PC1 and PC2 and the last line represents the 95% interval. . . 76 4.17 Dendrogram for: (a) the first session only, (b) the last session only and
(c) the five sessions overall. Subject 12 is tetraplegic and the subject 3 participated in both trials (traditional and novel method). . . 77 4.18 Cursor positions during five sessions for (a) the fastest user; (b) a user
that even for large targets (Protocols 1 and 2) the guidelines were the preferred path and (c) the slowest user. Lighter points in the image represents positions occupied by the cursor more often. . . 80 4.19 Average overshooting per target for each one of the three different
4.20 Average incorrect click events per target for each one of the three dif-ferent protocols using the novel method. Error bars represent the 95% confidence interval. Each point was estimated from the data of the 12 subjects in each session/protocol. . . 82 4.21 Learning curve represented by mean time for each one of the three
dif-ferent protocols using traditional sEMG signal processing. Error bars represent the 95% confidence interval. . . 84 4.22 Mean time compared for the traditional and novel method on each one
of the three different protocols. Error bars represent the 95% confidence interval. . . 85 4.23 Mean time increasing for protocol 2 compared to protocol 1 and protocol
3 compared to protocol 2. Error bars represent the 95% confidence interval. 86 4.24 Learning for each protocol between the first and the last session. Error
List of Tables
4.1 Summary statistics of subject demographics. . . 61 4.2 In each of the five sessions the protocols 1, 2 and 3 are compared using
the Mann–Whitney–Wilcoxon test. If H=1, it means the null hypothesis was rejected. . . 74 4.3 Mean time and its 95% confidence interval based on BootStrap . . . 88 4.4 Comparing experiments using traditional sEMG signal-processing and the
List of Abbreviations
AAC Augmentative and Alternative Communication
ACh AcetylCholine
ALS Amyotrophic Lateral Sclerosis
ANN Artificial Neural Network
AP Action Potential
ASR Automatic Speech Recognition
AutoCorrAbs Non-normalized Autocorrelation
BCI Brain Computer Interface
CNS Central Nervous System
DWT Discrete Wavelet Transform
EEG Electroencephalographic
EFSM Extended Finite State Machine
EMG Electromyographic
FSM Finite State Machine
HMM Hidden Markov Model
IED Inter-Electrode Distance
ID Index of Difficulty
IP Index of Performance
MAV Mean Absolute Value
MDF Median Frequency
MFAP Muscle Fiber Action Potential
MFCC Mel-Frequency Cepstral Coefficients
MNF Mean Frequency
MS Multiple Sclerosis
MU Motor Unit
MUAP Motor Unit Action Potential
MUAPT Motor Unit Action Potential Train
MVC Maximum Voluntary Contraction
NMAV Normalized Mean Absolute Value
OS Operating System
PC Principal Component
PCA Principal Component Analysis
RMS Root-Mean Square
sEMG Surface EMG
SBC Switch-based control
SCI Spinal Cord Injury
SENIAM Surface EMG for Non-Invasive Assessment of Muscles
SNR Signal to Noise Ratio
SR Sampling Rate
StdAbs Standard deviation of the Absolute value
Chapter 1
The use of electromyography in
assistive technology
Muscle activity is the main biological pathway for the human being to act upon the environment around him. At first, one may argue that speech is more relevant, but even this essential communication tool depends on the movements of facial muscles and the diaphragm. Beyond communication, a person must move around the environment and handle objects, obviously, using the skeletal muscle system1. Actually, besides brain
activity, it is hard to imagine another form of self-expression without involving muscle activity.
In some circumstances, a person may be deprived of those abilities in various degrees, perhaps due to limb amputation, spinal cord injuries (SCI), or degenerative diseases. In these cases, assistive devices are relevant tools to aid individuals to improve their functional capacities.
The idea of using muscle activity in assistive technology devices consists in decoding such activity in order to execute specific actions, which differ from the original purpose
1The human body has three types of muscle tissue: cardiac, smooth and skeletal. The first two
of a given muscle. For instance, the contraction of the Frontalis muscle is related to facial expressions, although it could be employed to control a device, such as a switch. Before muscle activity may be used in this manner, it must be detected by means of specific sensors (electrodes and circuit for signal conditioning). The detected signal, named electromyographic (sEMG) signal, is then interpreted, generating commands to be applied to assistive devices. If surface electrodes are used in the process, the signal is named surface EMG (sEMG).
Muscle activity is not the only source of information available for assistive devices. Brain activity, represented by electroencephalographic (EEG) signals are used in brain computer interfaces (BCIs) [1] providing a channel of communication for subjects with severe motor impairments. A suitable scenario for using EEG is the case of total locked-in syndrome, locked-in which the patient is aware and awake but cannot move or communicate verbally due to complete paralysis. Other possible channel of communication is using eye movements, registered by electrooculographic (EOG) signals [2] or cameras, as in gaze based devices. Finally, in some circumstances, elaborated systems involving bioelectrical activity and signal processing tools are not needed at all and low-tech solutions, such as a push button may be employed to provide the subject with the desired channel of interaction with the surrounding world.
Unaided
Augmentative and Alternative Communication
Aided
High-Tech Low-Tech
Figure 1.1: Forms of Augmentative and Alternative Communication.
1.1
Assistive devices based on sEMG signals
One of the most well-known applications of the sEMG signal on assistive devices is the control of prosthetic limbs. Pioneering work goes back in the 1950s [3] achieving simple but reliable control for open and close actions of artificial hands. The necessary infor-mation is extracted from the remaining muscles to operate the artificial limb. Prosthesis control has grown in complexity to include targeted muscle reinnervation [4] and has expanded in capacity to include finger control [5].
Beyond prosthetics limbs, sEMG signal processing is also present in AAC. The AAC term covers any methods used to supplement or replace speech or writing for those with impairments in the production or comprehension of spoken or written language [6][7]. Primary classification divides AAC into unaided and aided devices 1.1. Unaided systems do not require an external tool, and include facial expression, vocalizations, gestures and sign languages. An AAC aid system is any device, either electronic (high-tech) or non-electronic (low-(high-tech), that is used to compose and transmit or to receive messages. Therefore, AAC systems relying on sEMG signal processing are classified as high-tech AAC devices.
so the ideal AAC device for a given subject depends on several factors, among them the subject dexterity over muscle control. sEMG based devices can be subdivided into three major groups:
❼ Switch-based control (SBC) device;
❼ mouse emulation;
❼ speech recognition.
An SBC device transmits binary signals to the assistive device, utilizing the technology that has been applied for its conception. Such systems work only as a tool to scan various possibilities and make a selection, with the major difficulty being then to decide the scanning delay value [8]. Any muscle still under control are eligible candidates for this kind of application.
Computer interfaces have been operated mainly by mouse and keyboard since the 1980s; therefore, mouse emulation is a natural task when it comes to communication devices. Muscles used in rotation movement, as seen in a joystick, e.g., the neck muscles used to rotate the head [9, 10, 11] and the arm muscles used to rotate the hand, provide an intuitive way of controlling the cursor direction of displacement, since this movement is omnidirectional. Facial muscles are also explored, though the trend is that the cursor movement will be orthogonal as subjects find difficulty in giving two directions, e.g., UP and LEFT, at the same time.
Speech recognition uses the activity of the facial muscles involved in the task. Denby
❼ Works in silence: Can the device be operated silently?
❼ Works in noise: Is the operation of the device affected by background noise?
❼ Works for laryngectomy: Can the device be used by post-laryngectomy patients? It may be useful for other pathologies as well, but laryngectomy is used as a baseline.
❼ Non-invasive: Can the device be used in a natural fashion, without uncomfortable or unsightly wires, electrodes, etc.?
❼ Ready for market: Is the device close to being marketed commercially? This also takes into account in a natural way the current technological advancement of the technique, responding, in essence, to the question,“How well is this technology working as of today?”.
❼ Low cost: is the final product economical?
This axis also takes into account the current technological advancement of the tech-nique, responding, in essence, to the question: how well is this technology working, as of today? The answer will depend, among other factors, on whether any exotic technolo-gies or procedures are required to make the device function, as well as cost, performance in noisy environments, and invasiveness.
1.1.1 Switched-based control devices
A subject able to carry out residual movements with his or her head, or at least one limb, may use a pressure device. The same principle can be applied to sEMG signals where the pressure action can be replaced by muscle contraction. Electromyography has been considered previously as an assessment tool for patients with disorders of con-sciousness, indicating its use as a channel of communication [13]. Using computational solutions, one can generate binary signals, with ‘1’ being associated with muscle activity and ‘0’ assigned otherwise.
One approach consists of composing messages with some kind of code, e.g., the Morse code. Although this seems to be an unnatural mode of communication, the procedure may be extremely valuable for subjects with severe motor impairments. Any biosignal that can be interpreted as a two-state information source is a potential candidate for the use of this code. From the Morse-based code, the subject can control devices and communicate in several ways, depending upon the strategy adopted. Studies using sources other than the sEMG signal have shown that applying the Morse code [14, 15] can be a good option for AAC. Since maintaining a steady typing rate is difficult for disabled subjects, modified forms of the code may be adopted [15].
Park et al. [16] developed a system utilizing movements of the Massetter muscle of the chin. The signal acquired from these movements is transformed into dot or dash symbols, depending upon the duration of the contraction, and the sequence is decoded into characters that are fed into a voice synthesizer. This study includes a method for fatigue adaptation, an important concern when using sEMG. The major caveat to this system is that humans are not capable of chewing and pausing quickly; therefore, the transfer information rate is low, although not reported in numbers.
available for purchase since April 2011.
When comparing the scanning and the code-based approaches, we can observe that both are based in simple signal-processing techniques. The difference lies in the cognitive effort required from the subject: the scanning approach transfers the complexity of the message-generation process to the system interface; whereas, with code-based devices, the subject has to learn the sequence of symbols necessary to compose each character or command.
1.1.2 Cursor control
Since the 1980s, the mouse and keyboard have been the standard input devices for computer operation. Then, the number of studies to develop devices replacing physical keyboards with virtual ones to provide point-and-click functions is understandable. For some studies, though the goal is to provide a hands-free alternative to healthy subjects, the solution could be adapted for a subject with a disability.
Using muscles in the pointing task can be described as a three-step process: 1. Identification of the suitable muscles to be explored;
2. definition of types of control that can be obtained;
3. choice and processing of sEMG signals to generate the command.
In the case of subjects with severe motor disabilities, facial muscles are a common option, as these muscles can be activated. This is true even in the case of subjects suffering from a severe SCI.
and the subject’s ability to control the muscles. If an analogical device is used, and the subject has the dexterity necessary to control all four muscles at once, the cursor control will be omnidirectional. If an SBC device is employed with the same subject, the cursor can move in eight different directions. Finally, if the SBC device is operated by someone with poor muscle control, it is likely that the cursor will move to only four different directions. The most commonly used facial muscles in the pointing task are the Corrugator, the left and right Frontalis, the left and right Temporalis and the left and right Zygomaticus major. Traditional approaches use pairs of muscles to control displacement over the XY axis. Others strategies for exploring the sEMG signal are possible, such as 2-dimensional (2D) control from only one muscle [18]. In fact, in this thesis the task proposed is to control the cursor using only theFrontalis muscle.
Another detailed study that considered multimodal approaches compared a standard mouse and a hybrid device [24]. The cursor position was controlled by gaze and the object selection (left-click) was activated by frowning. The two solutions were compared using Fitts’ Law [25]: for small distances a standard mouse showed superior performance, although there was no statistical difference among the devices over large distances.
In [26] the goal was also to provide a pointing device controlled by facial muscles. A continuous wavelet transform measured the activation level of each muscle, providing four direction displacements - associated with both sides of the Orbicular, Massetter
and Mentalis muscles. Left and right-click operations were associated with opposite directions executed at the same time (up+down = right click and left+right = left click). The use of the wavelet transform was justified by the shape similarity between the wavelet mother and the motor unit action potentials (MUAPs, to be discussed in Chapter 2). However, this strategy can be questioned, as the system performance was not compared with traditional signal features, e.g. the Root-Mean Square (RMS) value. The study also lacks information about electrodes dimensions and geometry, thus, it is impossible to estimate the electrodes selectivity and therefore if MUAPs could be extracted from the sEMG signal.
Using four muscles to control horizontal and vertical displacement seems a very straightforward idea. Nevertheless, in a novel approach [18] the authors employed the sEMG signal recorded from only one muscle, the Auricularis Superior, to control the cursor position in the X and Y axis. The power levels of two different frequency bands extracted from this signal were utilized. The strategy adopted is quite different from the others described earlier, as the absence of muscle activity sets the cursor position to coordinates (0,0) while the contraction moves the cursor. User training is mandatory, because the subject should learn how the contractions affect the cursor position, and also because different subjects present different bands of interest.
may be the only option. However, a subject with a condition such as tetraplegia may a manifest residual control of his or her neck, shoulders, and even arms.
Additionally, using facial muscles seems an unnatural way of controlling a cursor, when compared to using standard mouse. As an example, diagonal movements tend to be accomplished through horizontal and vertical movements [11] when using sEMG signals as source of control. Head motion [27], on the other hand, could be compared to a joystick operation.
In [28, 29], five different motions of the neck and shoulder could be recognized with 95% mean recognition rate and response time of about 0.17s. Two pairs of electrodes were placed over theSternocleidomastoid and theTrapezius muscles, on each side of the body.
In [11] three methods offering pointing device control were compared: a standard mouse, head-orientation using an accelerometer and the sEMG-based approach. The
Platysma, left Trapezius and the Frontalis muscles were utilized. Cursor speed was a continuous variable, with a maximum value attributed to 70% of Maximum Voluntary Contraction (MVC). As expected, the mouse was superior and the sEMG approach was generally inferior to the head-orientation method, especially due to the difficulty of performing diagonal movements.
In [30] the angle of the head was estimated through linear interpolation of the sEMG signal extracted from the Sternocleidomastoid muscle. For small angle rotations, the sEMG signal was too weak to offer any useful information. For this reason a camera was used in its place and the angle was estimated by the relative position of the pupils. In fact, if a subject presents good head and neck control, the camera-based solution seems to be more appropriate, as the software is already available for download and only requires an ordinary webcam.
signals recorded from the forearm. An artificial neural network (ANN) was used to orient the cursor, while the muscular contraction level controlled the cursor velocity. A recent study involving the Microsoft Corporation [32] presents a similar approach using the sEMG signal in game interfaces and in busy-hands situations, which could also be utilized for subjects presenting some level of disability. The implication of this research by a company highly bound with the field of computing indicates the potential for use of the sEMG signal in computing interfaces. However, solutions for subjects presenting with good arm control are outside the scope of this thesis and, even in the case of adopting an assistive device, an adapted mouse or joystick would be more appropriate for this subject type.
An interesting method is found in [33], as three muscles in the forearm control a 2D cursor with variable speed. The first two muscles rotate the cursor, while the third moves the cursor forward. This approach is similar to the one adopted in the protocol described in Chapter 4.
One final observation concerns the system dimensionality. The above studies cover only 2D cursor operation, qualifying these systems to work on traditional Operating Systems (OS), which may not be suitable for motor impaired users. Scanning based interfaces could be adapted to use 1D cursor control, sliding forward and backwards to select options instead of scanning. The 1D approach is common for BCIs as referred by Wolpaw [34].
Fitts’ Law
It was noticed that some studies lack a method to measure performance, therefore impeding the comparison of different approaches. Fitts’ Law has been used to compare different pointing devices [35] and has been used in several studies. Measurements of precision while drawing over templates is also suggested [31].
is a model of human movement that predicts the time to move to a target, depending on the target distance and dimension, as seen in the following equations.
T =a+b·ID (1.1)
ID=log2(1 + D
W) (1.2)
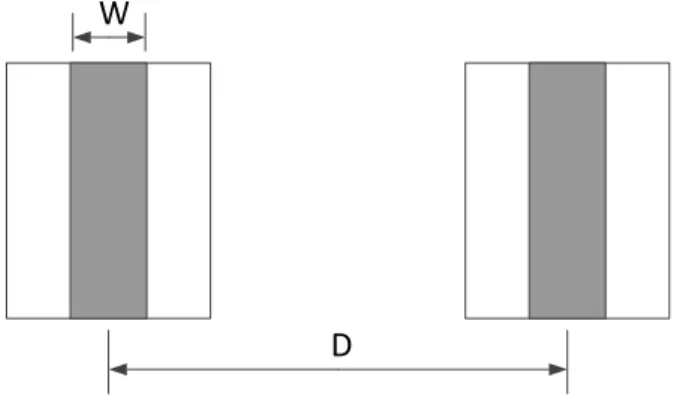
with D representing the distance, W representing the target dimension and ID repre-senting the index of difficulty of the proposed task. The values ofa and bare estimated after testing different values of W and D. The original approach by Fitts is shown in Figure 1.2 where the subjects move a stylus alternately back and forth between two separate target regions, tapping targets at the end of each movement.
D
W
Figure 1.2: Original approach by Fitts where the subject should tap a target (Width=W) distant D units from the other target.
Based on information theory concepts Fitts evaluated the human motor system using tasks such as pin and discs transfers. It was only in the seventies that Card, English and Burr [36] first used Fitts’ law to compare different pointing devices. Currently, the ISO 9241-9 standard on the evaluation of pointing device uses the fundamentals of Fitts’ law.
quickly pointing can be done. This is defined in two ways:
IP = 1
b (1.3)
or
IP = IDavg
M Tavg
(1.4) whereIDavg is theIDmean for all tasks proposed andMTavg is the mean time measured
during movements. In this case,IP is also called throughput (TP).
Speed control
Efficient, natural cursor control depends on speed variability. When far from the target, the cursor moves at higher speed than when the target is nearby. In studies aiming to increase cursor motion efficiency, movement speeds were controlled voluntarily by modulating muscle contractions [33]. Using the following non-linear formula, stronger contractions move the cursor much more quickly than weak ones:
Speed=Speedmax·
tanh((N M AV −0.5)∗5) + 1
2 (1.5)
where NMAV is the normalized mean absolute value and Speedmax is the maximum
speed, set to 1000 pixels per second. Both able-bodied and SCI subjects were capable of using the devised system. However, the improved efficiency brought by modulated speed values is still a matter of discussion, as the experiment results were not compared with the static-speed option.
for subsequent movements was reduced to a minimum. As in the previous study, no comparisons were made between static and variable cursor speed.
Still, many studies adopt static values for cursor control velocity. This strategy is supported by two factors: fatigue and cognitive effort. Muscle fatigue is an inevitable factor when working with sEMG-based assistive devices, although it varies from subject to subject and between sessions. However, muscle fatigue affects amplitude values found in the sEMG signal. If the speed is modulated by the signal amplitude, then different values are produced, even though the subject is exerting the same level of force.
The use of static values also minimizes the cognitive effort necessary for the subject to perform the task. This is especially true if the dynamics of the original task performed by the muscles involved do not resemble those for cursor control, as in the case of facial muscles. The subjects effort is focused on controlling muscles in a fashion that is completely different than the original.
1.1.3 Automatic speech recognition (ASR)
Since the late 1960s, efforts have been made to achieve a system for speech recognition [34]. Several pieces of software are available in the market and modern OSs for personal computers now offer built-in speech recognition. There are, however, a few drawbacks to the use of typical ASR systems:
❼ the audible speech prohibits confidential conversation;
❼ it is not advised to use such systems during meetings or inside a library;
❼ the performance decays severely in adverse environments such as crowded places;
❼ some clinical conditions hinder voice communication.
phonemes, and therefore words. This is not an easy task, as the act of speech employs several facial muscles, such as theMentalis, Depressor anguli oris,Massetter,Digastric,
Zygomaticus major,Levator anguli oris,Platysma, andOrbicularis oris muscles. Studies on silent speech interfaces usually regard subjects with voice impairment, such as total laryngectomy patients[37] or those working in situations where the ambi-ent noise impedes communication (e.g. by fire fighters and pilots). Therefore, whether the level of disability compromises the control over the muscles involved in the speech process must be carefully analyzed. An example of this type of subject is a tetraplegic patient using a ventilator system that is adjusted to accommodate cardiopulmonary requirements but is not optimal for speech. Speech produced with typical ventilator adjustments is often characterized by short phrases, long pauses between phrases, ab-normal loudness, and poor voice quality [38]. In a study conducted by Denbyet al. [12] over silent speech interfaces, seven technologies were compared, and the sEMG-based system had the highest overall evaluation.
In [39], hidden Markov Models (HMM) were used to map muscle activation into phonemes. The features extracted from the sEMG signal were Mel-Frequency Cepstral Coefficients (MFCC), as previous studies showed that discrete wavelet transform (DWT) coefficients were superior but slightly different. Only three channels were used with respect to the muscles Levator anguli oris, Zygomaticus major, and Depressor anguli oris. The muscles used and the electrodes were defined heuristically. To evaluate the system a limited vocabulary of 60 words was used and an accuracy of up to 85% was achieved.
theLevator anguli oris, theZygomaticus major, thePlatysma, theDepressor anguli oris, and the anterior belly of the Digastric. No criteria were indicated for choosing muscles or the electrode position. The vocabulary used was extremely restricted, with only 10 words.
In [41] only vowels were used, as the shapes of the lips and the mouth cavity were stationary. Three channels were used, with information recorded from the Mentalis,
Depressor anguli oris and Massetter muscles, since those are the most active muscles during vowel pronunciation. An ANN using the back-propagation algorithm was used to associate the RMS of the sEMG signal with the vowels. Other studies provide the recognition of isolated words in a small vocabulary [42, 43, 44]. In [44], the aim was to recognize speech of pilots that could be interpreted as commands, and electrodes were embedded in a pilot oxygen mask. The error rate was very low, ranging from 0% to 10.4%, during a speech-recognition task using the numbers zero to nine.
The probability that electrodes are repositioned in the same place as the previous session is very low. In [42], a normalization method found that among sessions, the accuracy decreases by about 10%, yet, without the method, the accuracy decreased more than 21%. Eight channels of information were extracted from the following muscles:
Levator angulis oris, the Zygomaticus major, the Platysma, the Depressor anguli oris, the anterior belly of theDigastricand the tongue. The vocabulary consisted only of the numbers 09.
Wandet al. [45] and Jouet al. [46] implemented continuous speech recognition using an HMM algorithm. The vocabulary was phonetically balanced and consisted of 108 words. A total of six channels were used. When compared to features from frequency and time-frequency domains, the Wavelet transform showed a slightly advantage.
control extremely useful. If 60 words could be associated to different actions, common sense dictates that even this would be extremely helpful for daily activities.
Another issue is that the data used to test each system were obtained under highly controlled situations, with the subjects being under supervision. During normal opera-tion, the subjects will likely be less focused, the pronunciation might be less clear, and the system may not respond very well.
As the goal is to associate phonemes with the activation of related muscles, it is interesting to define some criteria for determining which muscles should be used, as well the electrode positioning which would minimize crosstalk. Although not applied to ASR, in [47] the assessment was conducted for better positioning of electrodes in the forehead, so both electrodes could gather information from different muscles with minimum interference.
1.2
The research objective
The previous section indicates the myriad of applications that are possible using sEMG signals as the source of information for device control. Yet, those systems are not largely disseminated specifically because off issues with lack of stability on the electrode-skin interface and the need for skin preparation and properly electrode placement.
The typical sEMG signal used in those applications represents the ensemble of the activity of several units in the muscle (see Chapter 2) by using large and non-selective electrodes. Although useful, this sEMG signal hides the essential information present.
The objective of this study is to investigate if accessing information at motor unit level would improve the operator’s performance during a given task.
To test the hypothesis, a cursor-control approach is used, and the results using the traditional and the proposed approach are compared.
1.3
Thesis structure
The chapters of this document are organized as follows:
❼ Chapter 2: aspects of the sEMG signal generation and acquisition are introduced, including physiological factors.
❼ Chapter 3: the traditional approaches of the sEMG signal-processing are pre-sented, as well the details on the methods used in this research. It also discusses the possibilities of using motor action potentials to generate command signals.
❼ Chapter 4: the task proposed to verify the hypothesis is described, covering the protocol and its analysis from the point of view of Fitts’ Law. Also, the experi-mental protocol for sEMG signal acquisition and processing is presented.
❼ Chapter 5: the results found are compared to the results found using the traditional approach, which corroborates the hypothesis.
❼ Chapter 6: the conclusions are presented and future works are discussed.
1.4
Publications
The following papers have been published as a result of the present work:
❼ Pinheiro, C.G., Andrade, A.O.“The simulation of click and double-click through EMG signal”, Proceedings of the Annual International Conference of the IEEE Engineering in Medicine and Biology Society, EMBS , art. no. 6346345, San Diego - USA, pp. 1984-1987, 2012
Chapter 2
The electromyographic signal
generation and acquisition
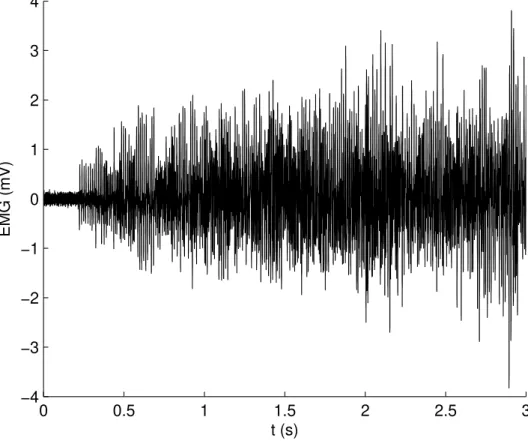
The sEMG signal is the representation of muscle activity captured by surface electrodes placed over the activated muscle. A sample of the traditional sEMG signal is shown in Figure 2.1.
0 0.5 1 1.5 2 2.5 3 −4
−3 −2 −1 0 1 2 3 4
t (s)
EMG (mV)
Figure 2.1: sEMG signal recorded at 10 kHz from the Frontalis muscle. By visual inspection it was estimated that muscle activity begins at 0.2 s.
2.1
The motor unit
A motor unit (MU) consists of an alpha-motoneuron in the spinal cord and the muscle fibers it innervates (Figure 2.2).
Muscle fibers Motoneuron
}
Motor Unit MuscleMotor end plate
Figure 2.2: The motor unit is composed by the alpha-motoneuron and all the fibers innervated by it. The motor end plate is the area where motor nerve fibers and muscle fibers meet.
that different MUs vary greatly in force generating capacity, with a 100-fold or greater difference in twitch force [50].
Muscle fibres vary in size and length between various muscles in the body and be-tween individuals, considering gender, build and age. In a normal adult the mean cross-sectional fibre areas are between 2500 µm2
(small woman) and 7500 µm2
(large man), representing a variation in diameter of about 50 to 100 µm[51].
Based on physiological properties such as speed of contraction and sensitivity to fatigue, there are three types of muscle units [52]: fast-twitch, fatigue-resistant (FR or type IIa); fast-twitch, fatigable (FF or type IIb); and slow-twitch (S or type I), which is the type most resistant to fatigue. Muscle fiber composition depends on the muscle function. Antigravity muscles tend to be predominantly type I, while muscles fit to rapid movements have similar proportions of the two fiber types.
In [53] facial muscles were classified based on the muscle fiber type found and three groups emerged:
❼ phasic muscles comprised of over 80% type II fibers, such as theOrbicularis oculi, theNasalis and theProcerus;
Corrugator, which are involved in functions requiring sustained facial tonus;
❼ an intermediate group composed of muscles such as theZygomaticus andLevator anguli oris.
2.2
The action potential
The action potential (AP) is a localized event that occurs in excitable cells, notably in neuron and muscle cells. The underlying dynamics of the action potential is described briefly, and its general waveform is shown in Figure 2.3. An actual AP is presented in Figure 2.4.
Depola riz
ation
Repola
riz a tion
Failed initiations Threshold
Resting State
Figure 2.3: Action potential
0 5 10 15 20 −1
−0.5 0 0.5 1
t (ms)
EMG (mV)
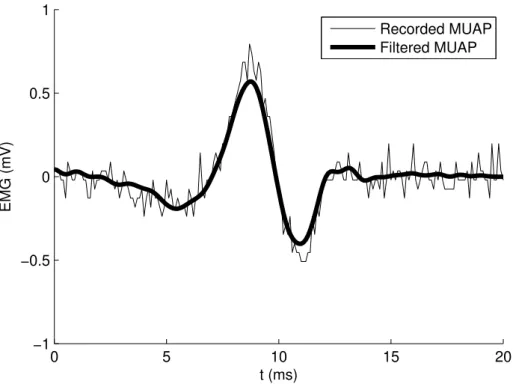
Recorded MUAP Filtered MUAP
Figure 2.4: Actual motor unit action potential recorded by the equipment used in this study. The signal was acquired from a tetraplegic subject over theFrontalis muscle and sampled at 10 kHz.
When the channels open, they allow an inward flow of sodium ions. This current depolarizes the membrane voltage. The process continues until all available ion channels are open, resulting in a large rise in the membrane potential. The rapid influx of sodium ions causes the polarity of the plasma membrane to reverse, and the ion channels then rapidly close. As the sodium channels close, sodium ions can no longer enter the neuron, and they are actively transported out of the plasma membrane. Potassium channels are then activated, and there is an outward current of potassium ions, returning the electrochemical gradient to the resting state. After an AP has occurred, there is a transient negative shift, named the refractory period, which prevents the AP from traveling in the reverse direction. The whole process occurs over a few milliseconds.
as the most basic bit of information in the human body. Also, APs are responsible for activating internal cell processes. In fact, a neuronal AP is responsible for generating the AP in muscle cells, which in turn stimulates muscle contraction.
The synaptic cleft at the neuromuscular junction separates the motor neuron axon and the motor end plate-membrane. When an AP arrives at the axon terminal, vesicles filled with the neurotransmitter acetylcholine (ACh) are released upon the muscle cell membrane, or sarcolemma. Those neurotransmitters bind with receptors to open the sodium ion gates, causing an AP in the muscle cell membrane, as explained previously. Specifically in a muscle cell, the AP propagates down to the sarcoplasmic reticulum, releasing calcium ions that are ultimately responsible for muscle contraction.
As stated before, the membrane potential rapidly returns to its steady state, but the AP can be seen as a propagating wave along the membrane as described earlier. The region where the AP takes place will be depolarized with respect to distant parts of the cell. This difference in electrical potential is followed by a current flow inside the cell, i.e., positive charges will move out from the region of depolarization, generating the AP in other regions. The velocity at which the AP travels over the muscle fiber is termed muscle fiber conduction velocity, and ranges from 2 to 6 m/s [54]. Several factors affects this velocity, including temperature, muscle length and fiber type.
2.3
sEMG signal
The AP occurring on the muscle fiber is called muscle fiber AP (MFAP), and its proper-ties depend on the physiological aspects of the fiber. Also, in terms of signal detection, the electrode geometry (to be discussed later) and positioning plays an important role on the signal waveform.
A single alpha-motoneuron is capable of innervating several muscle fibers, and this functional unit of cells is called a MU. Therefore, an AP in the muscle fiber is termed a motor unit AP (MUAP). The MUAP waveform is the sum of all MFAPs belonging to the same MU. Then, the MUAP may be represented as
M U AP =
F
X
i=1
M F APi(t−τ) (2.1)
whereτ represents the temporal offset, which is affected by the conduction velocity and the location of the neuromuscular junction. The variable F is the number of active muscle fibers.
During a muscle contraction, in order for the force to be maintained or increased, the active MU fires a series of sequential MUAPs, called MUAP train (MUAPT).
M U AP Tj = N
X
k=1
M U APk(t−σk) (2.2)
whereN is the number of active motor units andσkthe time of firing of the k-th motor
unit.
The tissues separating the muscle cells and the electrode act as a volume-conducting medium. Thus, finally, the sEMG signal can be defined as
sEM G=
M
X
j=1
M U AP Tj+n(t) (2.3)
the electrode range. The value of M is highly dependent on the electrode geometry configuration and its position. Electrodes with a small detection surface area may record the activity of a single MU. This may be appropriate for specific applications, such as medical diagnostics. On the other hand, especially for surface electrodes, as electrode surface area decreases, impedance and recorded background noise increases. Obviously, MUAPs from different MUs are superposed in time. In cases of partially superposed MUAPs, multiphase waveforms may be detected.
Figure 2.5 shows the activity of three motor units and the sum of those MUAPs detected by the same electrode. MUAP superposition can be seen along the combined signal. If the research objective is to discriminate between each MUs activity, which is not true for this study, these superposed signals must be isolated.
1.2 1.25 1.3 1.35 1.4 1.45 1.5
x 104 −1
0 1
1.2 1.25 1.3 1.35 1.4 1.45 1.5
x 104 −1
0 1
1.2 1.25 1.3 1.35 1.4 1.45 1.5
x 104 −1
0 1
1.2 1.25 1.3 1.35 1.4 1.45 1.5
x 104 −1 0 1 MU1 MU1 MU2 MU3 Sum MUAP superposition
Figure 2.5: Activity of three motor units and the sum of those three signals when registered by the same electrode.
2.4
Force control mechanisms
important point is that fine motor control is more easily reached with low contraction levels, as the higher the force, larger the size of the next group of MUs recruited.
However, recruitment depends on the type of muscle, and larger muscles tend to recruit all MU at 80% of the MVC [56]. Smaller muscles may use all motor units at about 50% of the MVC and rely more on rate coding - the regulation of the MU firing rate - for force modulation. Minimal and maximal values range from 5-10 impulses/s and above 50 impulses/s, respectively, and are dependent of a series of physiological factors (muscle type, size, age, etc.). As the force required increases, the firing rates of previously recruited MUs also increase. Although the unit impulses/s is appropriate from a physiological point of view, firing rate is commonly indicated using Hertz (Hz), especially in texts from an engineering background. During constant isometric contrac-tion the firing rate is quite regular and presents an approximately Gaussian distribucontrac-tion withσ = 10-20% of the mean [57].
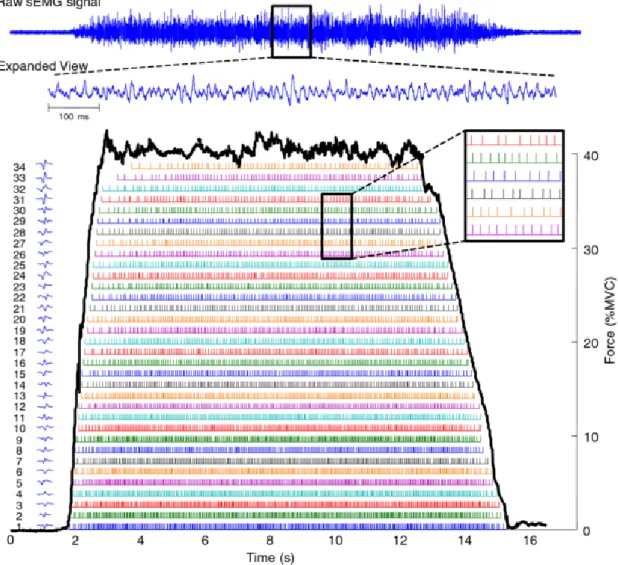
Figure 2.6 [58] presents an EMG signal decomposition in which these aspects of force modulation are observed.
Figure 2.6: EMG decomposition. The level of contraction rises from rest up to 40% of MVC. A total of 34 MUs enumerated in order of appearance and their MUAPs are observed at left. It is possible to see that they are sorted also based on their amplitude, reflecting the Henneman’s size principle. It is also possible to visualize the firing rate for each MU (colored bars) and how MUs recruited first have higher firing rate than the ones recruited last. Used with permission from the publisher.
2.5
Signal detection
size are determinant in the action potential waveform and amplitude. But there are many other issues of concern that influence the signal characteristics.
❼ Signal-to-noise ratio: this parameter describe the ratio of the wanted signal to the noise, which can be considered as those electrical signals that are not part of the EMG activity.
❼ Ambient noise: this noise originates from sources of electromagnetic radiation (i.e. 60 Hz or 50 Hz). The ambient noise signal may have amplitude that is one to three orders of magnitude greater than the EMG signal. While some equipments allow the use of a notch-filter for noise removal, its use is not recommended as part of the signal information is also removed.
❼ Anatomical considerations: the correct positioning of electrodes on the muscle in analysis is essential. The choice of an incorrect electrode placement site may lead to unexpected results. The SENIAM [59] project offers some recommendations for electrode positioning.
❼ Cross-talk: this refers to the source of EMG signals residing at some distance from the site in analysis, that is, the energy from one muscle group travels over into the recording field of another muscle group.
❼ Tissue-filtering: when the sEMG signal is recorded, the amplitude and frequency are affected by the intervening tissue between the electrodes and the muscle fiber, as this tissue acts as a low-pass filter. This effect is responsible for MUAPs from different motor units presenting similar waveform in the sEMG signal.
2.5.1 Electrode geometry
Electromyographic signals may be detected via two possible types of electrodes: in-dwelling and surface electrodes. Inin-dwelling electrodes may be used for the analysis of deep muscles and they allow for detection of signals from individual motor units. However, they are invasive and needle movements during the examination may cause great discomfort to user. Conversely, surface electrodes provide a safer, easier, and non-invasive method of detecting the signal. However, they are more susceptible to the cross-talk phenomenon, thus, it is more difficult to extract information about the or-chestration of the muscle function. Since AAC devices must be operated several hours a day, the following information is restricted to surface electrodes, and more precisely, bipolar ones.
The electrode geometry determines the sEMG signal registered. Therefore two aspects of electrode geometry should be analyzed: electrode surface area and inter-electrode distance (IED). The number of signals from active MUs recorded in the sEMG signal is directly proportional to the electrode area: the tissue between the muscle fibers attenuates the MUAP; therefore, if the distance between the muscle fiber and the elec-trode is too great, the amplitude of the MUAP will not exceed the background noise and MU activity will not be detected. The electrode can be designed with larger surface area so that the amount of tissue between the electrode and the muscle fiber is no longer an obstacle as seen in Figure 2.7. Conversely, the caveat of decreasing electrode surface area is that impedance increases, resulting in background noise contamination.
Muscle fiber in range Muscle fiber out of range
The IED affects the electrode selectivity, which is the ability to record muscle activity from the desired site instead of cross-talk from neighboring muscle fibers. In keeping the IED as short as possible, the amplitude and frequency components from more distant fibers are attenuated [60]. Typical values of IED when detecting MUAPs with surface electrodes are usually within the range of 2-10 mm [61]. The surface EMG for non-invasive assessment of muscles (SENIAM) [59] project recommends IED≤20 mm.
Other features extracted from the sEMG signal are also affected by the IED. In [62], a significant change in sEMG amplitude and in the signal power spectra was observed. The electrode acts as a spatial filter, and short IED results signal of smaller amplitude and higher frequency when compared with the signal resulting from a longer IED.
2.5.2 Sampling Rate
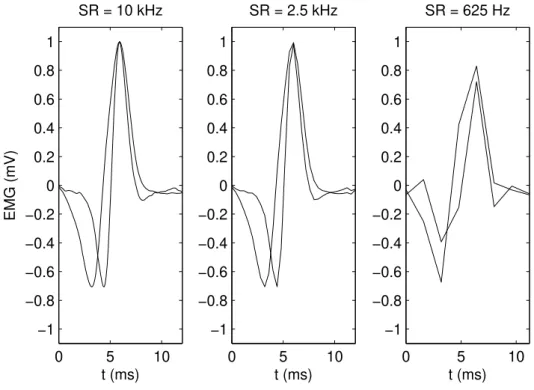
The appropriate choice of the sampling rate (SR) value depends on the Nyquist-Shannon’s sampling theorem. This theorem states that in order to preserve the signal information, the SR must be twice the value of the highest frequency found in the signal spectrum.
The energy levels of EMG signals mainly range between 0 and 500 Hz; therefore, SR values around 1 kHz are common in the literature.
In this study, the SR must conform to a more important requirement: the need to properly represent a two-phase wave in the time-domain. The length of the typical AP is not a constant, as different studies present varying values. It is generally accepted that an AP will be longer than 5 ms and shorter than 15 ms.
Although the focus of this project is on using sEMG signals for control purposes, several principles are shared with EMG signal decomposition techniques, since both must detect APs. For the task of EMG signal decomposition, values from 10 kHz to 25 kHz are used. Considering an extremely fast AP with a length of 5 ms, those values of SR would provide 50 and 125 samples respectively.
kHz and subsampled at 2.5 kHz and 625 Hz.
0 5 10
−1 −0.8 −0.6 −0.4 −0.2 0 0.2 0.4 0.6 0.8 1 EMG (mV) t (ms) SR = 10 kHz
0 5 10
−1 −0.8 −0.6 −0.4 −0.2 0 0.2 0.4 0.6 0.8 1
SR = 2.5 kHz
t (ms)
0 5 10
−1 −0.8 −0.6 −0.4 −0.2 0 0.2 0.4 0.6 0.8 1
SR = 625 Hz
t (ms)
Figure 2.8: Two distinct action potentials recorded at 10 kHz are shown at left. The two following images show the same action potentials subsampled at 2.5 kHz and 625 Hz. The loss of information is clear in the last case.
In the end, the SR must be set with the intended application in mind. For offline clustering analysis to estimate the number of MU present in an EMG signal, an SR of 25 kHz would provide much more information than an SR of only 10 kHz. For systems that must operate in real-time, the amount of data to be processed must comply with signal-processing unit limitations and must be kept as low as possible, without compromising efficiency.
muscle activity at the MU level, used signal SR of 25 kHz [64] and 10 kHz [65]. In [66], an SR of 2.048 kHz was used; however the objective was simply to detect the AP occurrence to estimate firing rate and conduction velocity.
For studies not concerned with MU activity, the average SR was 1.484 kHz with the minimum and maximum values being 500 Hz [67] and 3.5 kHz [68] respectively.
Chapter 3
Myoelectric control-based devices
In the few decades, several myoelectrical control-based devices have been developed. Almost all of these are of an assistive nature, such as prostheses [4, 69], wheelchairs [70], basic communication devices [14, 16, 71, 15, 72], cursor-control devices [18, 73] and generic On/Off devices. From all of these possibilities, prostheses are the only devices to available in the consumer market, while the rest have not advanced beyond pilot studies. One of the few AAC commercial solutions based on sEMG signal [17] was a scanning based device and it was available until April 2011.
The steps commonly found in myoelectrical control-based devices are depicted in Figure 3.1 and are explained in the following sections, with consideration of the typical approaches found in the literature.
Figure 3.1: sEMG signal is acquired and epochs are extracted. Features are extracted from epochs and feed a control decision system setting the command to the controlled device.
3.1
sEMG acquisition
An assistive device should be designed for daily use, several hours a day; therefore, only surface electrodes are suitable for this application. The SENIAM project [59] found that most studies detailing electrode configuration adopted Ag/AgCl electrodes of 1 cm in diameter. The preferred IED found was 2 cm. As discussed in Chapter 2, the use of this IED provides a sEMG signal composed of the activity of several MUs. The SR does not vary by a large amount, and is commonly found around 1 kHz, as most of the energy signal is assumed to be below 500 Hz.
3.2
Signal pre-processing
In some cases, the signal may be prepared for later processing. Usually this stage involves some kind of noise reduction techniques. But simple operations such as half-wave rectification and envelope estimation for later Mean-average-value extraction is also considered as a pre-processing technique.
LPD eligible for real-time applications. The filter is represented by the equation 3.1.
yk= N
X
n=1
xk+n−xk−n (3.1)
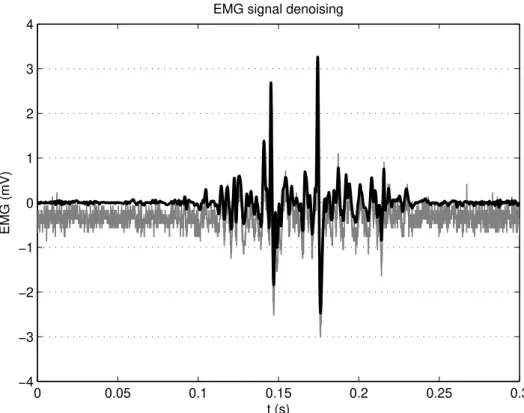
But as the LPD filter is not an ideal filter, there will exist severe Gibbs phenomenon: the leakage of energy frequency out of the filter pass-band. Under conditions of low signal-to-noise ratio the relatively strong high frequency noise (background activity) may be accentuated. Other possible approaches are based Wavelet de-noising and empiric mode decomposition (EMD) [75]. An example of signal de-noising is shown in Figure 3.2. It is important to remember that the term ”signal denoising” is usually devoted to the recovery of a digital signal that has been contaminated by additive white Gaussian noise (AWGN).
A wavelet is a wave-like oscillation with an amplitude that starts out at zero, in-creases, and then decreases back to zero. Unlike the sines used in Fourier transform for decomposition of a signal, wavelets are generally much more concentrated in time. They usually provide an analysis of the signal which is localized in both time and frequency, whereas Fourier transform is localized only in frequency. As in the Fourier transform, the Wavelet transform describes the signal in terms of coefficients and their functions (version of the original wavelet): detail and approximation coefficients, the latter ones representing ’low-frequency’ terms that usually contain important components of the signal, and are less affected by the noise. The de-noise action occurs when detail coeffi-cients are eliminated when smaller than a threshold.
0 0.05 0.1 0.15 0.2 0.25 0.3 −4
−3 −2 −1 0 1 2 3 4
t (s)
EMG (mV)
EMG signal denoising
Figure 3.2: Original sEMG signal (gray) and the de-noised signal (black) using the empiric mode decomposition method. acquired and epochs are extracted. Features are extracted from epochs and feed a control decision system setting the command to the controlled device.
the local maxima (upper envelope) and the other by the local minima (lower envelope), is zero. IMFs are thresholded and the signal is then reconstructed.
3.3
Data epoching
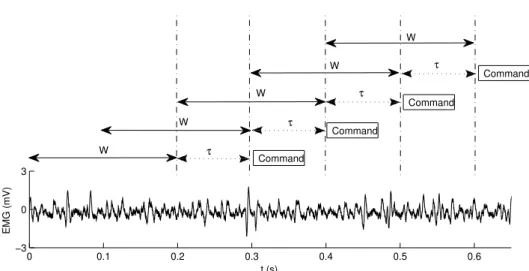
Out of the continuous flow of data coming from the signal acquisition system, an epoch is extracted and processed to generate a command. At this point, the researcher must make two decisions with respect to epoch length and epoch overlapping.
First, the epoch length should provide adequate available data for the extraction of reliable information. Second, the system must comply with real-time constraints of the required processing time, and the adjacent epoch length should be≤300 ms. Because the muscle activity is composed by the rest-contraction transition and steady intervals, the epoch length is also a key factor when interpreting the EMG signal, specially for devices using pattern-recognition classification, such as prosthesis control. Devices operating by onset intervals will benefit from small-length epochs with higher temporal resolution.
Two approaches for data epoching stands out: adjacent as shown in Figure 3.3 and overlapping epoching, shown in Figure 3.4.
0 0.1 0.2 0.3 0.4 0.5 0.6
−3 0 3
t (s)
EMG (mV)
Command
τ
τ
W
W
τ
Command W
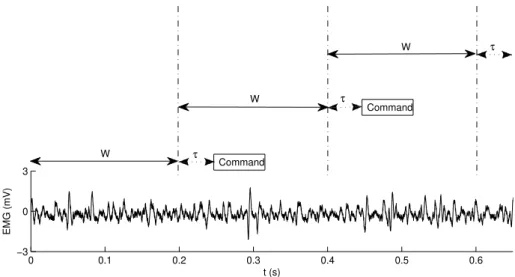
Figure 3.3: EMG signal with 200 ms adjacent epochs. The signal was sampled at 10 kHz which is the rate the signal processing unit must work (10 thousand values per second). Using adjacent epochs with W length, the system responds with a command every
0 0.1 0.2 0.3 0.4 0.5 0.6 −3
0 3
t (s)
EMG (mV)
W
W
W
τ W
W
τ
τ
τ
Command
Command
Command
Command
Figure 3.4: EMG signal with 200 ms overlapping epochs and 100 ms increment time (50% overlap). The signal was sampled at 10 kHz, and with 50% overlapping, the signal processing element must compute 20 thousand values per second.
constant. In the overlapping epoch technique, the next epoch overlaps the previous one every (W-τ) seconds, but in this scenario, the system provides a command at every
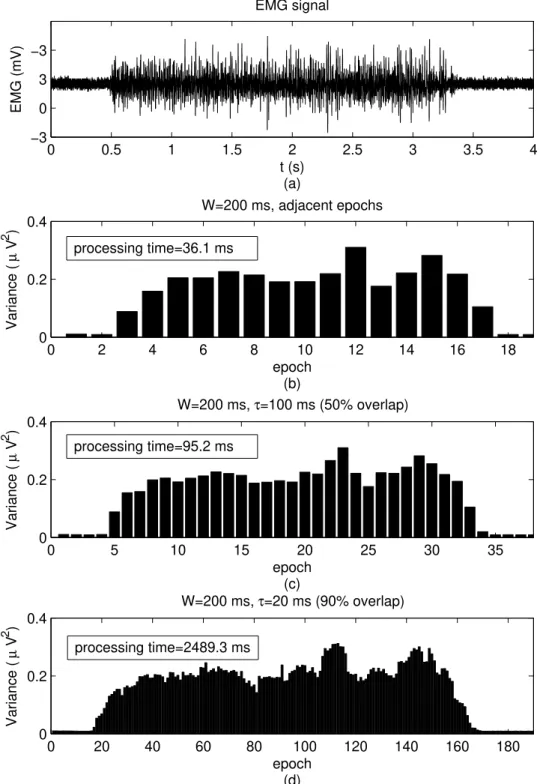
τ seconds assuming the signal-processing and decision-making processes are able to compute the data before the next epoch is available. If this is not the case, thenτ must be increased. As superposition increases, so does the commands redundancy and time resolution. The effects of increasingτ is seen in Figure 3.5 in which the variance of each epoch is estimated from an sEMG signal.
0 0.5 1 1.5 2 2.5 3 3.5 4 −3 0 3 −3 t (s) (a) EMG (mV) EMG signal
0 2 4 6 8 10 12 14 16 18
0 0.2 0.4
W=200 ms, adjacent epochs
epoch (b) Variance ( µ V 2 )
0 5 10 15 20 25 30 35
0 0.2 0.4
W=200 ms, τ=100 ms (50% overlap)
epoch (c) Variance ( µ V 2 )
0 20 40 60 80 100 120 140 160 180
0 0.2 0.4
W=200 ms, τ=20 ms (90% overlap)
epoch (d) Variance ( µ V 2 )
processing time=36.1 ms
processing time=95.2 ms
processing time=2489.3 ms
Figure 3.5: sEMG signal (a) with adjacent epochs (b), and overlapping epochs with
3.4
Feature extraction tools
The detected sEMG signal, as presented in Chapter 2, is composed by several MUAPs superposed and contaminated by background noise. It is considered a complex and non-stationary signal. A sample data feature computed over the epoch is a biased approximation of the true value. Amplitude and related features are investigated in time-domain analyses and frequency-domain is related to power spectrums features. Between these are wavelet-extracted features in a time-scale domain.
Several time-domain features are used to estimate of amplitude. Mean absolute value (MAV) and RMS are well-known options. While RMS is suitable for constant force and non-fatiguing contraction, MAV is preferred when the signal is modeled as a Laplacian process, and is usually associated with fatigue and low levels of contraction [79].
Several time-domain features can be combined, as in [80] where the epoch is de-scribed as a three-dimensional (3D) vector, composed of the MAV, the non-normalized autocorrelation function of the signal and the absolute value of the standard deviation. Time-domain features are the straight forward approach to analyze the signal as amplitude increases during a contraction. But frequency-domain features also suffer changes during contraction as the power spectral density (PSD) shifts to the left when compared to the background noise PSD.
The PSD is defined as the Fourier transform of the signal autocorrelation function. Two features extracted from the PSD provide information about the signal changing over time: mean frequency (MNF; shown in Figure 3.6) and median frequency (MDF). MNF is an average frequency calculated as the sum of product of the EMG power spectrum and the frequency divided by the total sum of the power spectrum. The definition of MNF is given by Eq. 3.2.
M N F =
PM
i=1fiPi
PM
i=1Pi