Vol.51, n. 2 : pp.263-269, March-April 2008
ISSN 1516-8913 Printed in Brazil BRAZILIAN ARCHIVES OF
BIOLOGY AND TECHNOLOGY
A N I N T E R N A T I O N A L J O U R N A L
Relationship between the Mass of Organic Matter and
Carbon in Soil
Silmara R. Bianchi, Mario Miyazawa*, Edson L. de Oliveira and Marcos A. Pavan
Instituto Agronômico do Paraná - IAPAR,; C. P,: 481; 86001-970; miyazawa@iapar.br; Londrina - PR - Brasil
ABSTRACT
The quantity of soil organic matter (SOM) was estimated through the determination of soil organic carbon (SOC) times a factor, which assumes that 58% of the SOM was formed by carbon. A number of soil samples with wide range of SOC content collected in the state of Paraná, Brazil were evaluated in the laboratory. SOC was measured by Walkley-Black method and the total SOM by loss on ignition. The SOC was positively correlated with SOM. The SOM/SOC ratio varied from 1.91 to 5.08 for the soils. It shows that Brazilian SOM has greater oxidation degree. Although, the SOM and SOC decreased with soil depth the SOM/SOC ratio increased. It showed that SOM in the subsoil contained more oxygen but less carbon than the SOM in the upper soil surface. The CEC/SOC also increased with depth indicating that the functional groups of the SOM increased per unity of carbon.
Key words: Organic carbon, tropical soils, soil analysis
INTRODUCTION*
The soil organic matter (SOM) is a product from the decomposition of plant residues, roots, and soil organisms whether living or dead (Brady, 1974). Organic matter has been termed as the lifeblood of soil. It has tremendous impact on the chemical, physical, and biological properties of soil. The soil organic matter consists of humic and fulvic acids and humin, which contain functional groups such as R-COO-, R-C=O, R-COH, R-SH, and others. These functional groups posses cation exchange properties similar to those of clay particles and adsorb metal cations on their surfaces. The difference is that the surface area and adsorptive capacity of SOM are much greater than those of clay. Three macro plant food nutrients, nitrogen, phosphorus, and sulfur, are constituents of soil organic matter (Brady, 1974). These nutrients become available through decay activities.
*
Author for correspondence
Recently, considerable attention has been dedicated to SOM research in Brazilian soils due to its relation with Ca transport into the soil (Miyazawa et al., 2000a) and Mn solubility (Andrade et al., 2002).
Soil organic matter is estimated by the determination of soil organic carbon (SOC) content. The principal method used for the determination of soil organic carbon is Walkley-Black (Jackson, 1964) and the principal method used for the determination of soil organic matter is the loss on ignition (LI), or gravimetric method (Ball, 1964, Jackson, 1964; Ben-Dor & Banin, 1989). The gravimetric method assumes that weight lost upon ignition is due only to loss of organic matter. The following reaction occurs: C6H12O6 (Organic Matter) + 6 O2 + Heat → 6 CO2
+ 6 H2O.
The principle of this method is that oxidizable matter in the soil is oxidized by Cr2O72- and the
reaction is facilitated by the heat generated when concentrated H2SO4 is mixed with K2Cr2O7
solution. The excess of Cr2O72- is determined by
titration with standard FeSO4 solution and the
quantity of substances oxidized is calculated from the amount of Cr2O72- reduced. It is estimated that
from 90 to 95% of the total carbon in soil is oxidized and measured by this procedure. The following reaction takes place:
C6H12O6 (Organic Matter) + K2Cr2O7→ 6 CO2 +
Cr2(SO4)3 + K2SO4 + 6 H2O
Percent of soil organic matter (%SOM) is calculated as follows:
% SOM = 10 (1 – S / B) x F
Where S = sample titration, ml ferrous solution, B = blank titration, ml ferrous solution, and F = factor. Jackson (1964) suggested a factor of 1.724 for North America soils, Miyazawa et al. (2000b) 3.72for State of Paraná soils, and Conceição et al. (1999) 3.18 for the State of Rio de Janeiro soils. This state of confusion in the factor used for the calculation of SOM is probably because of the higher oxidation degree of the SOM molecules in the tropics than in the temperate conditions. The objective of this work was to study the relationship between the mass of organic matter and carbon in Brazilian soils.
MATERIAL AND METHODS
Soil samples
Forty five soil samples were selected in the State of Paraná, Brazil (from 22° 30’ S to 26° 30’S and from 48° 30’ W to 54° 30’ W) with wide variation in the organic carbon content (from 1.5 to 65.0 g kg-1). Soil samples were collected from the 0 – 20 cm horizon. The organic carbon content was determined by WB procedure (Jackson, 1964) and mass loss by the LI (350oC during 1.5 h) procedure (Ball, 1964). The mass loss was assumed to be the loss of SOM.
Evaluation of SOM in the soil profile
Another six different soils were selected in the agricultural areas of the State of Paraná being two soil types from Campo Mourão city. Soil samples were collected from the 0-10, 10-20, 20-40, 40-60,
loss by LI procedure and cation exchange capacity (CEC) by the ∑ Ca+Mg+K+H+Al.
Partial oxidation of SOM
Three soils were selected from the States of Paraná and one soil from the Santa Catarina State and two soils from Japan with organic carbon varying from 14 to 93 g kg-1. The SOM was partially oxidized with H2O2 30% at 0/1, 1/1, 2/1,
and 4/1 ratio (H2O2/soil – v/w) (Schumacher,
2002). The samples were dried, ground to pass 1mm sieve and analyzed for the organic carbon by WB method, the mass loss by LI method and the CEC. Each determination was made in duplicate.
RESULTS AND DISCUSSION
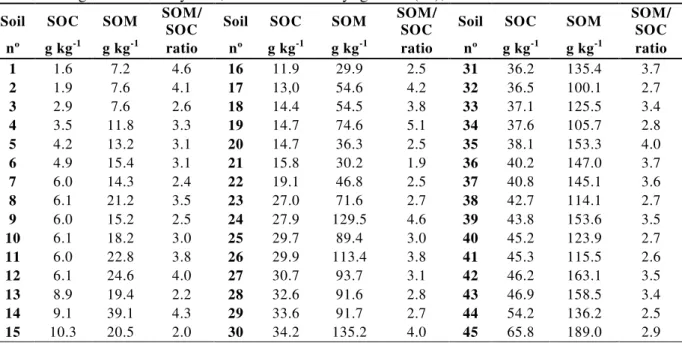
Table 1 shows the results of the organic carbon content determined by WB and the mass loss by LI methods for the 45 soil samples from the State of Paraná. The organic carbon determined by WB varied from 1.6 to 65.8 g kg-1 and the weight lost by ignition varied from 7.2 to 189.0 g kg-1.
The WB procedure was positively correlated with the LI procedure (Figure 1). This confirmed the high correlation between the two methods corroborating data presented in previous study with Brazilian soils (Miyazawa et al., 2000b). Table 1 also shows the SOM/SOC ratio varying from 1.9 to 5.1. These data were higher than that reported by Jackson (1964), who found a value of 1.724 for North American soils. The difference in the factor used for estimating the organic matter content in Brazilian and North American soils was probably due to greater oxidation degree of the organic matter of the soils from the State of Paraná. Thus, the factor used for estimating the SOM from organic carbon determination for tropical soils must to be higher than that currently used by the Brazilian soil laboratories. Raij & Quaggio (1983) and Silva et al. (1999) recommended for Brazilian soil the same factor 1.724 as suggested by Jackson (1964) for North American soils.
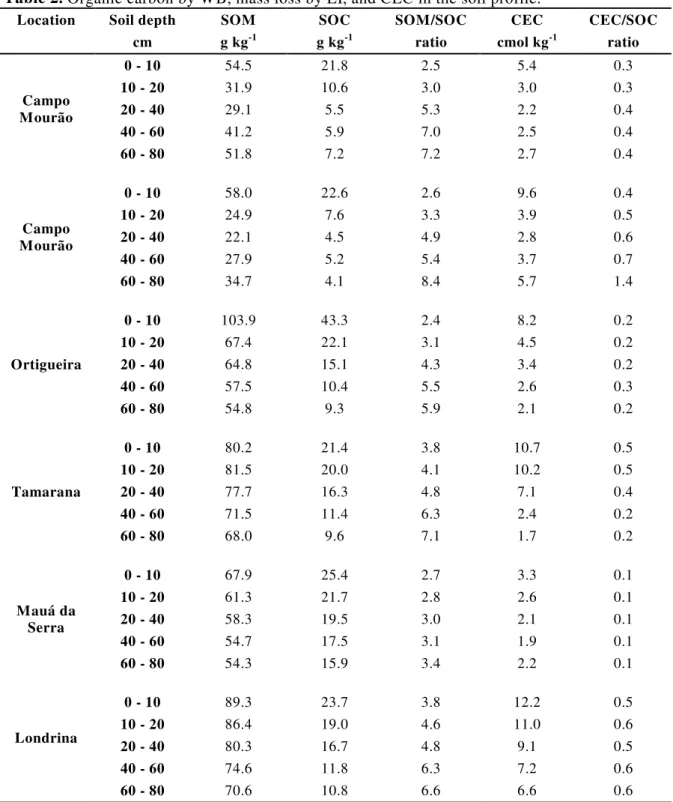
although the SOM content decreased the SOM/SOC ratio increased considerably with the soil depth. Assuming that the upper soil layers were higher aerated than the lower soil layers, a decrease in the SOM/SOC ratio was expected. However, SOM/SOC ratio increased with the depth, which was probably the result of increasing the mobility of high oxidized organic molecules from the surface to subsurface soil layers. This
explanation was reasonable because high oxidized organic molecule had polar behavior enhancing its mobility in the soil profile. Table 2 also shows the CEC values in the soil profile. Following the same trend of the SOM concentration in the soil profile, the CEC also decreased with increasing the soil depth.
Figure 1 - The correlation between organic carbon measured by WB method and the total mass loss by LI method
Table 1. Organic carbon by WB, total mass loss by ignition (LI), and LI/WB ratio.
Soil SOC SOM SOM/
SOC Soil SOC SOM
SOM/
SOC Soil SOC SOM
SOM/ SOC nº g kg-1 g kg-1 ratio nº g kg-1 g kg-1 ratio nº g kg-1 g kg-1 ratio
1 1.6 7.2 4.6 16 11.9 29.9 2.5 31 36.2 135.4 3.7
2 1.9 7.6 4.1 17 13,0 54.6 4.2 32 36.5 100.1 2.7
3 2.9 7.6 2.6 18 14.4 54.5 3.8 33 37.1 125.5 3.4
4 3.5 11.8 3.3 19 14.7 74.6 5.1 34 37.6 105.7 2.8
5 4.2 13.2 3.1 20 14.7 36.3 2.5 35 38.1 153.3 4.0
6 4.9 15.4 3.1 21 15.8 30.2 1.9 36 40.2 147.0 3.7
7 6.0 14.3 2.4 22 19.1 46.8 2.5 37 40.8 145.1 3.6
8 6.1 21.2 3.5 23 27.0 71.6 2.7 38 42.7 114.1 2.7
9 6.0 15.2 2.5 24 27.9 129.5 4.6 39 43.8 153.6 3.5
10 6.1 18.2 3.0 25 29.7 89.4 3.0 40 45.2 123.9 2.7
11 6.0 22.8 3.8 26 29.9 113.4 3.8 41 45.3 115.5 2.6
12 6.1 24.6 4.0 27 30.7 93.7 3.1 42 46.2 163.1 3.5
13 8.9 19.4 2.2 28 32.6 91.6 2.8 43 46.9 158.5 3.4
14 9.1 39.1 4.3 29 33.6 91.7 2.7 44 54.2 136.2 2.5
15 10.3 20.5 2.0 30 34.2 135.2 4.0 45 65.8 189.0 2.9
y = 3,08x + 2,52 R2 = 0,912
0 80 160 240
0 25 50 75
Or gani c car b on (g kg-1)
M
a
s
s
lo
ss
(
g
k
g
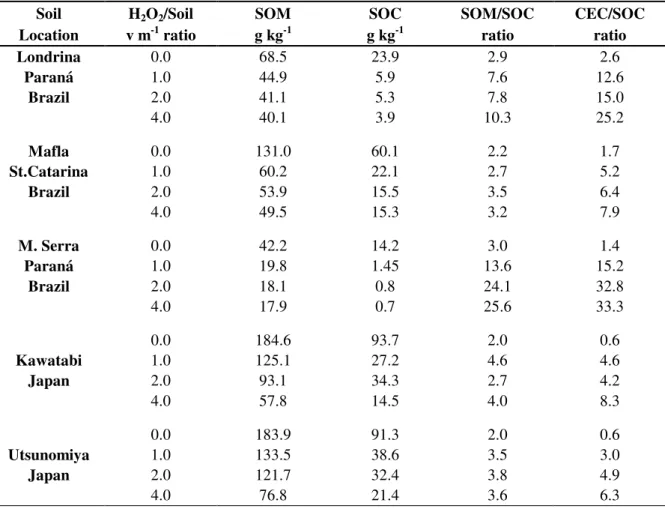
It is well know that the CEC of the Brazilian soils is highly dependent on the SOM content. Except for the soil from Tamarana, the CEC/SOC ratio increased with the depth. Again, reinforced the theory of the mobility of high polarized organic molecules. It was likely that soil organic matter in the subsoil layers contained more O but less C than the soil organic matter in the soil surface, which meant that the humic fraction dominated in the upper soil layers and fulvic fraction dominated in the lower soil layers. This hypothesis was based on the analytical characteristics of the humic substances where humic acid contained 56.4%C and 33.9%O while fulvic acid contained 50.9%C and 44.8%O (Schnitzer, 1991). The total acidity and COOH content of the fulvic acid were appreciably higher than those of the humic acid (Schnitzer, 1991). Thus, the increase in the CEC/SOC ratio with soil depth indicated that the functional groups content of SOM increased per unit of carbon. Table 3 presents data on the effects of H2O2 inthe partial oxidation of soils. Increasing
the H2O2/Soil ratio from 0 to 4 decreased the mass
Table 2. Organic carbon by WB, mass loss by LI, and CEC in the soil profile.
Location Soil depth SOM SOC SOM/SOC CEC CEC/SOC
cm g kg-1 g kg-1 ratio cmol kg-1 ratio 0 - 10 54.5 21.8 2.5 5.4 0.3
10 - 20 31.9 10.6 3.0 3.0 0.3
20 - 40 29.1 5.5 5.3 2.2 0.4
40 - 60 41.2 5.9 7.0 2.5 0.4
Campo Mourão
60 - 80 51.8 7.2 7.2 2.7 0.4
0 - 10 58.0 22.6 2.6 9.6 0.4
10 - 20 24.9 7.6 3.3 3.9 0.5
20 - 40 22.1 4.5 4.9 2.8 0.6
40 - 60 27.9 5.2 5.4 3.7 0.7
Campo Mourão
60 - 80 34.7 4.1 8.4 5.7 1.4
0 - 10 103.9 43.3 2.4 8.2 0.2
10 - 20 67.4 22.1 3.1 4.5 0.2
20 - 40 64.8 15.1 4.3 3.4 0.2
40 - 60 57.5 10.4 5.5 2.6 0.3
Ortigueira
60 - 80 54.8 9.3 5.9 2.1 0.2
0 - 10 80.2 21.4 3.8 10.7 0.5
10 - 20 81.5 20.0 4.1 10.2 0.5
20 - 40 77.7 16.3 4.8 7.1 0.4
40 - 60 71.5 11.4 6.3 2.4 0.2
Tamarana
60 - 80 68.0 9.6 7.1 1.7 0.2
0 - 10 67.9 25.4 2.7 3.3 0.1
10 - 20 61.3 21.7 2.8 2.6 0.1
20 - 40 58.3 19.5 3.0 2.1 0.1
40 - 60 54.7 17.5 3.1 1.9 0.1
Mauá da Serra
60 - 80 54.3 15.9 3.4 2.2 0.1
0 - 10 89.3 23.7 3.8 12.2 0.5
10 - 20 86.4 19.0 4.6 11.0 0.6
20 - 40 80.3 16.7 4.8 9.1 0.5
40 - 60 74.6 11.8 6.3 7.2 0.6
Londrina
CONCLUSIONS
The soils from the State of Paraná had greater oxidation degree than North American soils. The SOM/SOC ratio increased with soil depth as the result of increasing the mobility of hitgh oxidized organic molecule from the surface to subsoil.
AKNOWLEDGEMENT
The first author wishes to thank CNPq for the award of the scientific initiation scholarship.
RESUMO
O teor de matéria orgânica do solo (MOS) é
carbono. Amostras de solos apresentando grande variação no teor de COS foram avaliadas no laboratório. O COS foi determinado pelo método de Walkley-Black (WB) e a MOS pela perda de massa por ignição (PMI). A MOS foi positivamente correlacionada com o COS. A relação MOS/COS variou de 1,91 a 5,08. Este resultado mostra que a MOS brasileiros apresentam maior grau de oxidação. Embora a MOS e o COS tenham diminuído a relação MOS/COS aumentou com a profundidade do solo. Este resultado demonstrou que a MOS da subsuperfície contem mais oxigênio e menos carbono que a MOS da superfície do solo. A relação CTC/COS também aumentou com a profundidade, indicando um aumento nos grupos funcionais da MOS por unidade de carbono.
Table 3. Partial soil oxidation with H2O2.
Soil H2O2/Soil SOM SOC SOM/SOC CEC/SOC
Location v m-1 ratio g kg-1 g kg-1 ratio ratio
Londrina 0.0 68.5 23.9 2.9 2.6
Paraná 1.0 44.9 5.9 7.6 12.6
Brazil 2.0 41.1 5.3 7.8 15.0
4.0 40.1 3.9 10.3 25.2
Mafla 0.0 131.0 60.1 2.2 1.7
St.Catarina 1.0 60.2 22.1 2.7 5.2
Brazil 2.0 53.9 15.5 3.5 6.4
4.0 49.5 15.3 3.2 7.9
M. Serra 0.0 42.2 14.2 3.0 1.4
Paraná 1.0 19.8 1.45 13.6 15.2
Brazil 2.0 18.1 0.8 24.1 32.8
4.0 17.9 0.7 25.6 33.3
0.0 184.6 93.7 2.0 0.6
Kawatabi 1.0 125.1 27.2 4.6 4.6
Japan 2.0 93.1 34.3 2.7 4.2
4.0 57.8 14.5 4.0 8.3
0.0 183.9 91.3 2.0 0.6
Utsunomiya 1.0 133.5 38.6 3.5 3.0
Japan 2.0 121.7 32.4 3.8 4.9
REFERENCES
Andrade, E.; Miyazawa, M.; Pavan, M. A. and Oliveira, E. L. de (2002), Effect of organic matter on manganese solubility. Brazilian Archives of Biology and Technology, 45,17-20.
Ball, D.F. (1964), Loss-on-ignition as an estimate of organic matter and organic carbon in non-calcareous soils. Journal of Soil Science, 15, 84 -92.
Ben-Dor, E. & Banin, A. (1989), Determination of organic matter content in arid zone using a simple loss-on-ignition method. Commun. Soil Sci. and Plant Anal., 20, 1675-1695.
Brady, N. C. (1974), Organic matter of mineral soils. In: Buckman, H. O. and Brady N. C. ed. The nature and properties of soils. Macmillan Publishing Co., New York, p. 137-163.
Conceição, M. da, Manzatto, C.V., Martin Neto, L., Saab, S.C., Cunha, T.J.F. and Freixo, A.A. (1999), Estudo comparativo de métodos para determinação do teor de matéria orgânica em solos orgânicos do Estado do Rio de Janeiro. ComunicadoTécnico, Rio de Janeiro, n. 2. Disponível em <www.cnps.embrapa.br./search/pesqs/comtec/ ComTec2.pdf>.
Jackson, M.L. (1964), Determinaciones de Materia Orgánica en los Suelos. In - Analisis Químico de Suelos. Ediciones Omega, Barcelona, 282-310.
Miyazawa, M.; Pavan, M. A. and Franchini, J. C. (2000a), Evaluation of plant residues on the mobility of surface applied lime. Brazilian Archives of Biology and Technology, 45, 251-256.
Miyazawa, M., Pavan, M.A., Oliveira, E.L. de, Ionashiro, M. and Silva, A.K. (2000b), Gravimetric determination of soil organic matter. Brazilian Archives of Biology andTechnology, 43, 475-478. Raij, B. van & Quaggio J.A. (1983), Métodos de análise
de solo para fins de fertilidade. Campinas: IAC, 31p. (Boletim Técnico. 81).
Schnitzer, M. (1991), Soil organic matter-The next 75 years. Soil Science, 151, 41-58.
Schumacher, B. A. (2002), Methods for the determination of total organic carbon (TOC) in soils and sediments. Ecological Risk Assessment Support Center. US. Environmental Protection Agency 23p. Silva, F.C.da; Eira, P.A. da; Raij, B. van; Silva, C.A.;
Abreu, C.A. de; Gianello, C.; Pérez, D.D.; Quaggio, J.A.; Tedesco, M.J.; Abreu, M.F. de and Barreto, W. de O. (1999), Análises químicas para avaliação da fertilidade do solo. In - Manual de análisesquímicas de solo, plantas e fertilizantes. Embrapa Comunicação para Transferência de Tecnologia, Brasília, 152-155.