http://www.uem.br/acta ISSN printed: 1679-9275 ISSN on-line: 1807-8621
Doi: 10.4025/actasciagron.v37i4.19598
The mixture volume sprayed by hydraulic and centrifugal energy
nozzles for the control of Asian soybean rust
Lilian Lúcia Costa1*, Marcelo da Costa Ferreira1, Henrique Borges Neves Campos1, Giorge
Gomes França de Carvalho1 and José Calos Barbosa2
1
Departamento de Fitossanidade, Núcleo de Estudo e Desenvolvimento em Tecnologia de Aplicação, Faculdade de Ciências Agrárias e Veterinárias, Universidade Estadual Paulista "Júlio de Mesquita Filho", Via de Acesso Prof.Paulo Donato Castellane, s/n,14884-900, Jaboticabal, São Paulo, Brazil. 2Departamento de Ciências Exatas, Faculdade de Ciências Agrárias e Veterinárias, Universidade Estadual Paulista "Júlio de Mesquita Filho", Jaboticabal, São Paulo, Brazil. *Author for correspondence. E-mail: [email protected]
ABSTRACT. The objective of this work was to evaluate a means of controlling ASR (Phakopsora pachyrhizi H. Sydow & P. Sydow) by applying reduced fungicide volumes in association with spray nozzles using either hydraulic or centrifugal energy. Two experiments resulted from that objective: soybean plants (Glycine max (L.) Merril) of the ‘BRS Valiosa RR’ cultivar were grown at the Experimental Farm of the University of São Paulo State (Unesp) in Jaboticabal, Brazil. The treatments were distributed in the field according to a randomized complete block design with four replications. The treatments consisted of the volumes of 50, 100, and 150 L ha-1 (droplets resulting from hydraulic energy) and 17, 35, and 50 L ha-1
(droplets resulting from centrifugal energy). An additional treatment was applied without fungicide (i.e., baseline treatment). The volume of 150 L ha-1 with droplets formed by hydraulic energy permitted the best
pathogen control using the fungicide azoxystrobina and cyproconazole in comparison with the other treatments. The volume of 17 L ha-1 with the droplets formed by centrifugal energy was the least efficient
and resulted in the highest rust severity and the lowest grain yield.
Keywords: spray nozzle, coverage, deposition, Glycine max, Phakopsora pachyrhizi, disease severity.
Volume de calda em pulverização por energia hidráulica e centrífuga empregado no
controle da ferrugem asiática da soja
RESUMO. O objetivo da realização deste trabalho foi avaliar o controle da ferrugem asiática da soja (Phakopsora pachyrhizi H. Sydow & P. Sydow) em função do uso de menores volumes de aplicação associados a bicos de pulverização de energia hidráulica e centrífuga. Foram conduzidos dois experimentos com a cultura da soja (Glycine max (L.) Merril) cultivar “BRS Valiosa RR’, em área experimental da Unesp, Câmpus de Jaboticabal, São Paulo, no delineamento de blocos ao acaso com sete tratamentos e quatro repetições. Os tratamentos foram constituídos pelos volumes de 50, 100 e 150 L ha-1 (gotas produzidas por
energia hidráulica) e 17, 35 e 50 L ha-1 (gotas produzidas por energia centrífuga), mais um tratamento
adicional sem aplicação do fungicida. O volume de 150 L ha-1 com gotas formadas por energia hidráulica
proporcionou maior controle do patógeno pelo fungicida azoxystrobina e cyproconazole em relação aos demais tratamentos. Aplicações com o volume de 17 L ha-1 com gotas formadas por energia centrífuga foi
menos eficiente com maior severidade da ferrugem asiática e menor produtividade.
Palavras-chave: bico de pulverização, cobertura, deposição, Glycine max, Phakopsora pachyrhizi,severidade da doença.
Introduction
Soybean (Glycine max (L.) Merril) is the most important oilseed crop in the world (CONAB, 2012). However, due to the significant number of diseases to which it is susceptible, the maximum potential productivity of soybean is seldom attained (JULIATTI et al., 2005). Among the diseases that attack soybean in Brazil, Asian soybean rust (ASR), which is caused by the fungus Phakopsora pachyrhizi
(H. Sydow & P. Sydow), is one of the worst, causing severe yield losses and demanding quick and
efficient measures for its control (NAVARINI et al., 2007).
Observations in both commercial areas and experiments show that the distribution of the phytosanitary product on the three regions of the plant is irregular. Usually, less sprayed product is deposited on the lower and internal parts of the plant canopy, which is an important cause of the low efficiency achieved in controlling Asian rust (BOSCHINI et al., 2008). Choosing the correct spray nozzle to obtain droplets of the ideal size may contribute to increased penetration and deposition of the sanitary product in the middle and lower thirds of the soybean plant (CUNHA et al., 2011).
Spraying equipment usually makes use of hydraulic pressure, which results in droplets of irregular size; this leads to an uneven distribution of the product on the plant (CUNHA et al., 2007). To increase droplet uniformity, other droplet formation systems may be used, such as centrifugal energy nozzles; these nozzles originate more uniform droplets and, as such, increase the efficiency of controlling the disease (DI OLIVEIRA et al., 2010; NUYTTENS et al., 2007).
Application volume is another important factor because it is related to coverage of the plant by the product in the field. Today, the objective is to reduce the product volume, while bearing in mind the objective of increasing the operational capacity of the sprayers by reducing the number of pit stops, the time spent replenishing the sprayer and the costs due to bringing water to the field (FARINHA et al., 2009; SOUZA et al., 2012).
Spraying with reduced application volumes is considered a significant technological advancement, although it means working with small or very small droplets, which increases the risk of losses resulting from drift and evaporation in addition to lower amounts of deposited product (BAYER et al., 2011). Di Oliveira et al. (2010) demonstrated low-volume applications for the control of Pseudoplusia includens to be more efficiently attained by using centrifugal energy nozzles.
The information in the literature concerning the use of centrifugal energy nozzles is uncommon. However, the hypothesis underlying this research work is that because they result in more uniformly sized droplets, centrifugal energy nozzles should permit better plant coverage in comparison with the conventional spraying system, even when using lower application volumes.
Hence, the objective of this work was to evaluate the efficiency of different application volumes and types of spraying nozzles on the control of Asian soybean rust.
Material and methods
Two experiments were carried out during the crop years of 2009/10 and 2010/11 at the Experimental Farm of the State University of São Paulo (Unesp) on its campus of Jaboticabal, state of São Paulo, Brazil (latitude of 21° 15’ 17’’ S, longitude of 48° 19’ 20’’ W and a mean altitude of 575 m above sea level). The soybean cultivar ‘BRS Valiosa RR,’ which is a medium-cycled cultivar with a determined growth habit, was studied.
Seed sowing according to the traditional method occurred on 12/3/2009 and on 11/24/2010. The space between rows was 0.45 m, and 17 plants were placed per meter in each row. Each experimental unit was formed by ten 25-m-long rows covering a total area of 112.5 m2 of which 27 m2 was the working area. The
soybeans were harvested on 4/12/2010 and 4/4/2011, respectively.
The farming practices and applications of herbicides and insecticides followed the recommendations given by Embrapa (2008). To control ASR, a mixture of the fungicides azoxystrobina and cyproconazole (tradename: Priori Xtra at a dosage of 0.3 L p.c ha-1) and mineral oil (tradename: Nimbus
at a dosage of 0.5% v v-1) was used in two applications.
The experimental units were distributed in the field according to a randomized complete block design with seven treatments and four replications. The treatments included a control (no fungicide applied), a hydraulic energy nozzle injector, equipped with nozzle model TT 110° (produced by Teejet) delivering the volumes of 50, 100, and 150 L ha-1, and a centrifugal energy
nozzle injector, model Turbo Trator® TT-88B
produced by Centro Brasileiro de Bioaeronáutica (CBB or Bioaeronautics Brazilian Center) delivering the volumes of 17, 35, and 50 L ha-1.
The disk rotation frequency in the centrifugal energy nozzles was 103.33 Hz (the rotation controller was positioned to obtain medium-sized droplets according to the instructions provided by the manufacturer, CBB). The nozzles were placed 1.4 m from each other and at a distance of 0.5 m from the target (the leaves of the soybean plants). The hydraulic energy points were separated by 0.5 m and at an application height of 0.5 m above the target.
The fungicides were applied with the help of a Ford 4610 tractor, which moved the sprayer with a 12-m-long spray boom. Only one side of the boom was used. The dislocation speed of the tractor/sprayer was of 2 m s-1. The spraying pressure
was compatible with the spray nozzle and the volume of the mixture volume sprayed used for each treatment (Table 1).
Table 1. The characteristics of the necessary conditions for the studied treatments.
Crop years of 2009/10 and 2010/11
Hydraulic energy nozzle Centrifugal energy nozzle
Volume (L ha-1) Pressure (kPa) Nozzle Volume (L ha-1) Pressure (kPa) Nucleus/Disk
50 200 TT11001 17 200 13/D2
100 200 TT11002 35 150 25/D2
150 400 TT11002 50 350 25/D2
Table 2. The prevailing meteorological conditions during the experiment.
Crop year 2009/10
Application/Date SD Day Time Temp. RH WS
Beginning End (ºC) (%) (m s-1)
First - 1/2/2010 R1 13 h 00 min. 15 h 30 min. 31.3-33.0 65-73 0.30-0.80 Second - 24/2/2010 R4 10 h 00 min. 12 h 40 min. 33.6-36.8 55-63 0.55-1.66
Crop year 2010/11
First - 19/1/2011 R1 14 h 00 min. 16 h 50 min. 28.1-29.6 65-74 0.80-2.22 Second - 10/2/2011 R4 14 h 00 min. 17 h 10 min. 29.6-30.7 57-68 0.30-0.80
SD – The soybean plant stage of development, which was based on the phenological scale by RITCHIE et al. (1982). Temp. – The temperature. RH –The relative humidity of the air. WS – The wind speed.
The droplet spectrum
The parameters evaluated were the volumetric median diameter (Dv0.5), the uniformity coefficient of sprayed droplets (Coef. Unif.), and the percentage volume of droplets smaller than 100 μm (% < 100 μm). The uniformity coefficient was calculated using the following equation:
where:
Coef. Unif. = the uniformity coefficient (dimensionless), and Dv0.1, Dv0.5 and Dv0.9 refer to the droplet diameter (μm) so that 10, 50 and 90%, respectively, of the sprayed volume is composed of droplets smaller than that value.
According to Viana et al. (2010), these are the most important parameters for determining the population of sprayed droplets because, together, they define the size, the homogeneity, and the drifting potential of the droplets produced by the spraying points.
The droplet diameters were determined by laser diffraction: measurements were collected as the droplets passed by the sampling region in a particle size analyzer (Mastersizer, Malvern Instruments Limited), which was adjusted to work with droplets in the size range from 0.5 to 900 μm. According to this method, the diffraction degree that the light ray undergoes is inversely proportional to the particle size (FERNANDES et al., 2007). Data decoding, according to the algorithm prepared to characterize the droplet diameters by laser ray diffraction, was accomplished directly using the Mastersizer S v.2.19 program (Malvern Instruments Ltd.).
The hydraulic energy nozzle was installed in a radial transporter placed at a distance of 40 cm from the laser beam according to the norms established by FAO (1998). The centrifugal energy nozzle was installed in a static supporter, thereby permitting a representative reading of the droplets.
Three samples were collected from the hydraulic energy nozzle; for each, the sprayed jet was read four times. For the centrifugal energy nozzle experiment, two nozzles were used, with six readings collected from each, totaling to 12 replications per treatment. A completely random design was used because the operational and meteorological conditions among replications were standardized.
Deposition and coverage of the mixture volume sprayed on the soybean plants
To evaluate the deposition of the sprayed mixture on each plant third, a metallic marker was added to the mixture. This marker was formulated with manganese sulfate (31% of Mn+2, according to
the maker Oxiquímica Agrociência Ltda) as its base and was added to the mixture at the concentration of 6 x 10⁻³ kg L-1; this concentration was fixed for the
different mixture volumes.
After the mixture with the marker was applied, in each plot, a leaflet from each third of the plant thirds was taken from 4 plants. The leaflet samples were placed inside plastic bags, to which 100 mL of 0.2 mol L-1 HCl solution was added. After 60
minutes of repose, the salt of the applied metal was extracted (OLIVEIRA; MACHADO-NETO, 2003). After that period, the extract was filtered, and the metallic ion Mn+2 was determined by recovery in an
The collected leaflets were washed and digitalized to estimate the leaf area by means of a leaf area measuring instrument LI-COR, Model LI 3100C, manufactured by LI-COR, Inc. The manganese concentrations indicated by the spectrophotometer were related to the leaf areas and then transformed into volume per unit area (L cm-2).
To evaluate the coverage resulting from the deposited droplets, water sensitive paper was applied to four plants per plot, at each plant third. The paper was directly applied to the soybean leaves with the help of metal staples; the papers were immediately removed as soon as the sprayed mixture had dried and were placed in paper bags to prevent exposure to humidity.
After that, the paper was digitalized in a table scanner with a resolution of 300 dpi, and image processing was viewed using the computational program QUANT v.1.0.22 (FERNANDES FILHO et al., 2002). This software identifies the area (in percentage) covered by the droplets based on color contrast between the untouched area of the paper and the stain caused by droplets deposited on it.
ASR severity and crop productivity
The efficacy of the treatments in controlling ASR was evaluated by comparing the disease severity with grain yield. Weekly surveys were used to observe the beginning of the disease in the field. After confirming the first symptoms of the disease, the application of curative fungicides was started, followed by reapplication soon after the end of the residual period and if the meteorological conditions were favorable for disease development.
ASR severity evaluations were begun after the disease was first observed; evaluations were performed at approximately 7 days intervals until senescence of the leaves, yielding 8 evaluations in the first (crop year 2009/10) and 7 evaluations in the second experiment (crop year 2010/11).
The disease severity was visually estimated in terms of the percentage of the leaf area showing visible signs of the disease in 10 leaflets from each plant third, using the diagrammatic scale proposed by Godoy et al. (2006). While evaluating the severity of the ASR, the signs of any other late stage diseases (such as powdery mildew and downy mildew) were disregarded.
Based on the disease severity data at the different stages of plant development, that is, from R1 to R7 (RITCHIE et al., 1982), the area below the disease progress curve was determined with the help of the equation proposed by Campbell and Madden (1990), which permits the expression of all of the severity evaluations in one only value.
To evaluate the effects of the treatments on productivity, the grains of each plot were harvested using plot harvesting equipment. The moisture content of those grains was determined following the procedures described in the Rules for Testing Seeds (BRASIL, 2009). The amount of grain harvested was then adjusted to a moisture content of 13%, wet basis.
Analysis of the results
The data were submitted to the analysis of variance, and when F was significant (p < 0.01 or p < 0.05), the treatment means were compared by the Tukey test at the 5% level of probability. Comparisons with the treatment were made using the Dunnet test at the 5% level of probability. The disease severity data were also submitted to a two-by-two linear correlation analysis with the deposition and coverage of the applied mixture.
The deposition data for crop year 2010/11, the coverage data in crop years 2009/10 and 2010/11 and the disease severity data in crop year 2009/10 (upper and middle plant thirds) and 2010/11 (upper third) were, respectively, transformed into 1/√ ; logx + 1, and logx to attend the assumptions of normality and homogeneity of the variance, keeping the original treatment means in the tables and figures.
Results and discussion
The droplet spectrum
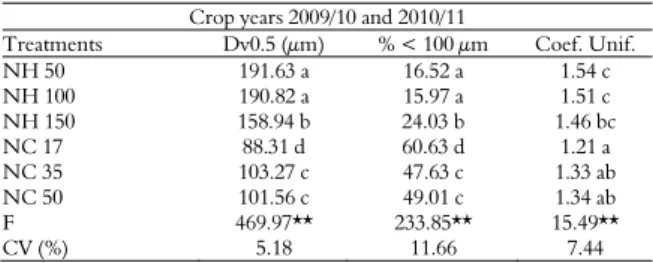
The median volumetric diameter of droplets resulting from the centrifugal energy nozzles (Dv0.5) was significantly smaller than that of the hydraulic energy nozzle(Table 3). However, this result is not in agreement with the manufacturer recommendation in which the device for selecting the working rotation was placed to produce median sized droplets.
Table 3. Analysis of variance and comparisons between the means of the data of median volumetric diameter (Dv0.5); the percentage of droplets smaller than 100 μm (% < 100 μm) and the uniformity coefficient (Coef. Unif.).
Crop years 2009/10 and 2010/11
Treatments Dv0.5 (μm) % < 100 μm Coef. Unif. NH 50 191.63 a 16.52 a 1.54 c NH 100 190.82 a 15.97 a 1.51 c NH 150 158.94 b 24.03 b 1.46 bc NC 17 88.31 d 60.63 d 1.21 a NC 35 103.27 c 47.63 c 1.33 ab NC 50 101.56 c 49.01 c 1.34 ab
F 469.97** 233.85** 15.49**
CV (%) 5.18 11.66 7.44
NH – The hydraulic energy nozzle. NC – The centrifugal energy nozzle. 50; 100; 150; 17; 35 e 50 L ha-1. CV – The coefficient of variation. In the same column, the means
followed by the same small case letter are not significantly different at the level of 5% of probability, according to Tukey’s test. By the F test ** significant at 1% of probability.
with diameters smaller than 100 μm (% < 100 μm; thus, these droplets were more likely to undergo drifting (Table 3). Interpreting the data on the percentage of the volume of droplets with diameters smaller than 100 μm allows an estimation of the drifting potential of the application (CUNHA et al., 2003).
According to those authors, there is no standard-value capable of identifying either the drifting risk or the safe application, although they believe that values of the volume of drops with diameters smaller than 100 μm lower than 15% are more appropriate for environmentally safe applications. Hence, the treatments combined with the centrifugal energy nozzle were more susceptible to drifting than those of the hydraulic energy nozzle (Table 3). This result possibly contributed to the reduced efficiency of the sprayed mixture deposits using the treatments combined with the centrifugal energy nozzle, as discussed below.
The uniformity coefficient expresses the uniformity of the sprayed droplet spectrum. A homogeneous droplet spectrum yields a value close to zero for the coefficient (VIANA et al., 2010). In this work, the treatments combined with the centrifugal energy nozzle showed higher uniformity in their droplet spectrums in comparison with the hydraulic energy nozzle, as confirmed by the lower Coef. Unif. (Table 3).
The uniformity observed when the centrifugal energy nozzle was used was lower than that reported in other investigations in which the same technology was used (DI OLIVEIRA et al., 2010; BARBOSA et al., 2011; BUENO et al., 2011).
Mixture deposition and leaf coverage
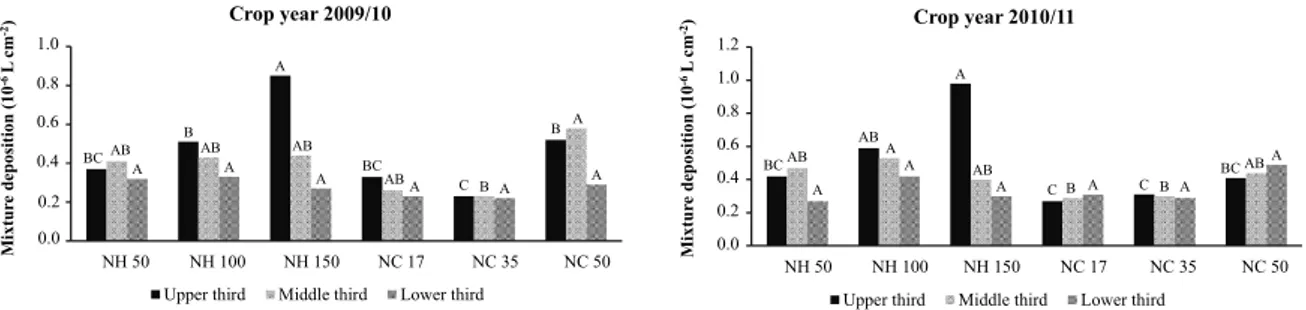
In both crop years, the mixture deposition was not proportional to the increment in the applied volume. For example, when comparing the plant thirds and the larger and smaller volumes of the mixture, it can be observed that the volume of 150 L ha-1, although 8.8 times larger than the volume of 17
L ha-1, did not result in a deposition that was
proportional to the difference in volumes (Figure 1). Thus, it can be said that the centrifugal energy nozzle resulted in larger mixture deposits in comparison with the hydraulic energy nozzle. This fact can be explained by the homogeneity of the droplet spectrum achieved with the centrifugal energy nozzle, which is why the droplets reached the target more efficiently. Hence, the statistical analysis explains only the absolute value without taking into consideration the fact that the proportion between volumes is different.
According to the results indicated by the statistical analysis, in crop years 2009/10 and 2010/11, the largest mixture deposits in the upper third of the plants resulted when the hydraulic energy nozzle was used in combination with the volume of 150 L ha-1 (Figure 1).
However, this result was not replicated for the middle and lower thirds.
In the middle third, the treatments resulted in similar mixture deposits; the only significant difference was obtained when the volumes of 35 and 50 L ha-1 in
association with the centrifugal energy nozzle were compared during crop year 2009/10, as well as the volume of 100 L ha-1 associated with the hydraulic
energy nozzle in crop year 2010/11 (Figure 1).
When the lower third of the plant is examined, even the highest volumes did not cause significant differences in the deposited mixture in both crop years (Figure 1). This result may be because the leaflets on the upper portion of the soybean plant intercepted the droplets, so that the droplets could not properly penetrate the plant independently of the volume used. Similar results were reported by Prado et al. (2010) and Christovam et al. (2010), who evaluated fungicide deposits in soybean plants.
Souza et al. (2007) state that, in addition to the overlapping plant leaves, evaporation and drifting processes also may make it difficult for the droplets to reach the leaf surface, resulting in the variable deposition efficiency of the product over the leaf surface.
Although the centrifugal energy nozzle showed more uniform deposition of the mixture on all of the plant thirds than the hydraulic energy nozzle, the deposition on the upper third generally was larger than that on the lower third, independent of the application volume and of the energy used to form the droplets (Figure 1).
The analysis of the coverage values (in percentage), as shown by the water sensitive paper, during crop year 2009/10 show no significant differences between the volumes applied and nozzle types used on the plant thirds (Figure 2).
During crop year 2010/11, in the upper third, the treatments associated with the hydraulic energy nozzle resulted in larger coverage percentages in comparison with the centrifugal energy nozzle. In the middle and lower thirds, the combination of the hydraulic energy nozzle with the volume of 150 L ha-1 and the centrifugal energy nozzle with the
volumes of 17 and 35 L ha-1 yielded the best results
Figure 1. Mixture deposition (10-6 L cm-2 of leaf surface) on the upper, middle, and lower thirds of the soybean plants. NH – The
hydraulic energy nozzle. NC – The centrifugal energy nozzle. 50; 100; 150; 17; 35 and 50 L ha-1
.
Figure 2. The coverage, as a percentage, of the water sensitive paper on the upper, middle and lower thirds of the soybean plants. NH – The hydraulic energy nozzle. NC – The centrifugal energy nozzle. 50; 100; 150; 17; 35 and 50 L ha-1.
The application volumes in combination with the centrifugal energy nozzle did not show larger coverage percentages and product deposits than those shown by the hydraulic energy nozzle, even when the application volume was the same, that is, 50 L ha-1 (Figures 1 and 2). The smaller diameter
droplets, that is, the larger percentage of droplets smaller than 100 μm, resulting from the centrifugal energy nozzle were associated with applications made when the air temperature was approximately 30°C (Tables 2 and 3), and the low application volumes possibly had a negative influence on the efficiency of that nozzle. Small droplets evaporate more easily and can drift from the target when the environmental conditions are characterized by high temperatures and low relative humidity (MURPHY et al., 2000).
With a behavior similar to that of the deposited mixture, the coverage percentage of the lower third was smaller than that of the middle and upper thirds, independent of the application volume and the type of energy used to form the droplets (Figure 2). According to Heiffig et al. (2006), fungicide applications intended to control ASR usually are made when the plants are showing their highest leaf area index (LAI), resulting in a degree of shading (umbrella effect) of the leaves on the lower third, which creates significant difficulty in terms of reaching these leaves with a sprayed product.
The severity of ASR and its effects on soybean crop
Analyzing separately the combined treatments with hydraulic and centrifugal energy nozzleduring the crop year of 2009/10 the ASR severity in the different plant thirds was not influenced by spray volumes. Similar result was observed in 2010/11 crop year with exception of the lower third in which the volume of 50 L ha-1 in association with the
volume of 50 L ha-1 differed significantly from the
centrifugal energy nozzle in combination with 17 L ha-1 (Table 4).
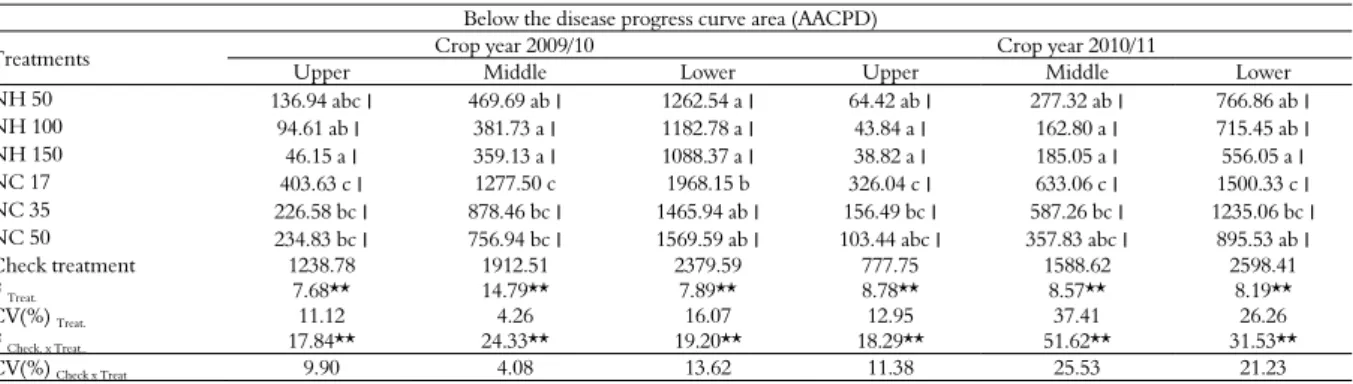
The volume of 150 L ha-1 in combination with
the hydraulic energy nozzle and the volume of 17 L ha-1 combined with the centrifugal energy nozzle,
for both crop years, exhibited the most significant contrast between treatments. Consequently, the highest volume permitted the best control of the disease, and the lowest volume delivered the worst control (Table 4). These results directly affected grain yield (Figure 3).
High negative correlation coefficients were observed by Gasparetto et al. (2011) when the values for the areas below the disease progress curves were compared with yield indexes and the mass of one thousand grains. Navarini et al. (2007) and Barros et al. (2008) also identified significant negative correlations between the level of severity of P. pachyrhizi and soybean productivity. BC B A BC C B
AB AB AB
AB B
A
A A
A A A A
0,0 0,2 0,4 0,6 0,8 1,0
NH 50 NH 100 NH 150 NC 17 NC 35 NC 50
M ixtur e dep o sit ion (10 -6 L c m -2)
Crop year 2009/10
Upper third Middle third Lower third 1.0 0.8 0.6 0.4 0.2 0.0 BC AB A C C BC AB A AB B B AB A A
A A A
A 0,0 0,2 0,4 0,6 0,8 1,0 1,2
NH 50 NH 100 NH 150 NC 17 NC 35 NC 50
M ixtur e de po si ti on (10 -6 L c m
-2) Crop year 2010/11
Upper third Middle third Lower third 1.2 1.0 0.8 0.6 0.4 0.2 0.0 A A A A A A A A A A A A A A
A A A A
0 5 10 15 20 25
NH 50 NH 100 NH 150 NC 17 NC 35 NC 50
%
Cove
rage
Crop year 2009/10
Upper third Middle third Lower third
A A
A
B B B
AB AB A B B AB AB AB A
B B AB
0 5 10 15 20 25 30 35
NH 50 NH 100 NH 150 NC 17 NC 35 NC 50
%
C
o
ver
age
Crop year 2010/11
Table 4. The areas below the progress curves, calculated based on the severity of the disease at the upper, middle, and lower plant thirds after treatment application.
Below the disease progress curve area (AACPD)
Treatments Crop year 2009/10 Crop year 2010/11
Upper Middle Lower Upper Middle Lower NH 50 136.94 abc ׀ 469.69 ab ׀ 1262.54 a ׀ 64.42 ab ׀ 277.32 ab ׀ 766.86 ab ׀ NH 100 94.61 ab ׀ 381.73 a ׀ 1182.78 a ׀ 43.84 a ׀ 162.80 a ׀ 715.45 ab ׀ NH 150 46.15 a ׀ 359.13 a ׀ 1088.37 a ׀ 38.82 a ׀ 185.05 a ׀ 556.05 a ׀ NC 17 403.63 c ׀ 1277.50 c 1968.15 b 326.04 c ׀ 633.06 c ׀ 1500.33 c ׀ NC 35 226.58 bc ׀ 878.46 bc ׀ 1465.94 ab ׀ 156.49 bc ׀ 587.26 bc ׀ 1235.06 bc ׀ NC 50 234.83 bc ׀ 756.94 bc ׀ 1569.59 ab ׀ 103.44 abc ׀ 357.83 abc ׀ 895.53 ab ׀ Check treatment 1238.78 1912.51 2379.59 777.75 1588.62 2598.41
F Treat. 7.68** 14.79** 7.89** 8.78** 8.57** 8.19**
CV(%) Treat. 11.12 4.26 16.07 12.95 37.41 26.26
F Check. x Treat.. 17.84** 24.33** 19.20** 18.29** 51.62** 31.53**
CV(%) Check x Treat 9.90 4.08 13.62 11.38 25.53 21.23
NH – The hydraulic energy nozzle. NC – The centrifugal energy nozzle. 50; 100; 150; 17; 35 and 50 L ha-1. CV: The coefficient of variation. Means in the same column, followed by
the same small case letter, are not significantly different at the level of 5% of probability, according to Tukey’s test. Means followed by a space bar (׀) differ significantly from the check treatment according to the test by Dunnet at the 5% level of probability. By the F test, **significant at the 1% level of probability. F and CVTreat. refer to the values found for
comparisons between plots treated with fungicides. F and CVCheck x Treat. refer to the values found for comparisons between the blank treatment and the plots treated with fungicides.
Figure 3. Soybean grain yield (kg ha-1
) after application of the treatments. NH – The hydraulic energy nozzle. NC – The centrifugal energy nozzle. CT – The check treatment. 50; 100; 150; 17; 35 and 50 L ha-1. Means followed by the same lower case letter are
not significantly different at the 5% level of probability, according to Tukey’s test. *Means followed by an asterisk differ significantly from the check treatment at the level of 5% of probability, according to Dunnet’s test.
During crop year 2009/10, only the treatment combining the volume of 17 L ha-1 and the centrifugal
energy nozzle was significantly different from the treatment in which the volume of 150 L ha-1 was
combined with the hydraulic energy nozzle (Figure 3). The larger concentration of the azoxystrobina and cyproconazole fungicide in the mixture volume sprayed using the volume of 17 L ha-1 did not result in
adequately controlled ASR, most likely because this volume was insufficient for distributing the product adequately over the target (Figure 2). The larger the quantity of the product deposited over the tissue surface, the more efficient is its action (SERRA et al., 2008).
In crop year 2010/11, the volumes combined with the hydraulic energy nozzles resulted in yields that were statistically similar but significantly superior to those in which the volumes were combined with the centrifugal energy nozzle (Figure 3). However, it should be noted that the volume of 150 L ha-1 and the
hydraulic energy nozzle resulted in the better yield with a difference of at least 230 kg ha-1 (both crop years
considered) in comparison with the second highest productivity value.
The correlation data and the disease severity results in the lower third of the plant show that the upper and middle thirds were the plant parts that permitted the differentiation of the best treatments with respect to disease control and grain yield (Tables 4 and 5).
Table 5. Correlation coefficients between ASR severity (AACPD) and the deposition (Dep.) and coverage (Cov.) of the mixture volume sprayed on the upper (U), middle (M), and lower (L) plant thirds.
Crop year 2009/10(1) Crop year 2010/11(1)
AACPD U
AACPD
M AACPD L AACPD
U
AACPD M AACPD L Dep. U -0.25ns --- --- -0.53** --- ---
Dep. M --- -0.29ns
--- --- -0.45* --- Dep. L --- --- -0.15ns --- --- -0.10ns
Cov. U -0.28ns --- --- -0.50* --- ---
Cov. M --- -0.07ns
--- --- -0.38ns
--- Cov. L --- --- -0.27ns --- --- -0.37ns
(1)The number of pairs used for the correlation is equal to 24. According to the F test, ns
not significant; *significant at the 5% level of probability, **significant at the 1% level of probability.
The correlations between disease severity and the studied variables were always negative, meaning that, as the deposition and coverage of the product was increased, the disease symptoms in the plant thirds grew less severe. Another aspect to be considered is that the phenological stages between R4 and R6, as identified by Heiffig et al. (2006), are those in which the plants exhibit the highest demand for water, nutrients, and photosynthates. These factors are preferentially directed to the developing grain. Thus, the LAI can be observed as a parameter that is indicative of productivity because the photosynthetic process depends on luminous energy interception and its conversion to chemical energy (FAVARIN et al., 2002).
As the LAI increases, the lower leaves become more shaded by the upper leaves; accordingly, the highest concentration of leaves and the highest
2117 2811
3046
1739 1981
2654
1251
2832 2823
3061
2081 2323
2448
1168
0 500 1000 1500 2000 2500 3000 3500
NH 50 NH 100 NH 150 NC 17 NC 35 NC 50 CT
S
o
y
b
ea
n
gr
ain yi
el
d
(
k
g ha
-1)
Crop year 2009/10 Crop year 2010/11
A*
C* BC*
B* A*
AB AB*
A*
B AB
AB*
photosynthetic rates were verified in the upper leaf section of the plants (ZHU et al., 2008). Thus, maintaining the health of the leaves in the middle and upper thirds (shown by the lowest AACPD values) is most likely what permitted the higher productivity levels (Table 4 and Figure 3). According to Juliatti et al. (2005), when the photosynthetically active area is maintained, the plant experiences better conditions and is able to increase its photo-assimilates production, which results in higher yields.
Comparisons between the check treatment and those in which the plants were treated with the fungicide show that, in crop year 2009/10, in the lower and middle thirds, the combination of the volume of 17 L ha-1 and the centrifugal energy
nozzle was the only treatment that did not differ from the check treatment (Table 4).
In crop year 2010/11, independent of the application volume and the type of nozzle, the disease was better controlled in the plots where the mixture of azoxystrobina and cyproconazole was applied in comparison with the check treatment (Table 4). Cunha et al. (2006) also reported statistically significant differences between the check treatment and those in which fungicides had been applied.
With respect to grain productivity, in crop year 2009/10, the combinations of the hydraulic energy nozzle with the volume of 50 L ha-1 and the
centrifugal energy nozzle with the volumes of 17 and 35 L ha-1 did not differ significantly from the
check treatment. In crop year 2010/11, all treatment combinations were statistically superior to the check treatment (Figure 3).
Conclusion
The hydraulic energy nozzle combined with the application volume of 150 L ha-1 resulted in higher
levels of ASR control and higher productivity using the fungicide azoxistrobina and cyproconazole. The use of centrifugal energy nozzles to control ASR demands additional studies in which other forms of application should be carried out to verify whether similar behaviors are observed.
Acknowledgements
The authors are thankful to Capes (Coordination for the Improvement of Personnel of Superior Level) for the doctoral scholarship given to the first author, to Fapesp (Research Funding Agency of the State of São Paulo) for financially supporting the research project proposed by the second author (Process 2010/10678 - 6) and to the Nucleus for
Studies and Development of Application Technology (Nedta) for their help during field and laboratory determinations.
References
BARBOSA, B. F. F.; FERREIRA, M. C.; SILVA, J. L.; CAVICHIOLI, F. A.; BERTONHA, R. S.; CUSTÓDIO, A. A. P. Controle de Ipomoea nil utilizando ponta centrífuga de pulverização em diferentes volumes de aplicação com e sem adjuvante. Revista Brasileira de Herbicidas, v. 10, n. 3, p. 277-290, 2011.
BARROS, H. B.; SEDIYAMA, T.; REIS, M. S.; CECON, P. R. Efeito do número de aplicações de fungicidas no controle da ferrugem asiática da soja. Acta Scientiarum. Agronomy, v. 30, n. 2, p. 239-245, 2008.
BAYER, T.; COSTA, I. F. D.; LENZ, G.; ZEMOLIN, C.; MARQUES, L. N.; STEFANELO, M. S. Equipamentos de pulverização aérea e taxas de aplicação de fungicida na cultura do arroz irrigado. Revista Brasileira de Engenharia Agrícola e Ambiental, v. 15, n. 2, p. 192-198, 2011.
BOSCHINI, L.; CONTIERO, R. L.; JÚNIOR, E. K. M.; GUIMARÃES, V. F. Avaliação da deposição da calda de pulverização em função da vazão e do tipo de bico hidráulico na cultura da soja. Acta Scientiarum. Agronomy, v. 30, n. 2, p. 171-175, 2008.
BRASIL. Ministério da Agricultura, Pecuária e Abastecimento. Secretaria Nacional da Defesa Agropecuária. Regras para análise de sementes. Brasília: Mapa/ACS, 2009.
BUENO, M. R.; CUNHA, J. P. A. R.; ALVES, G. S. Estudo do espectro de gotas produzidas nas pulverizações aérea e terrestre na cultura da batata. Revista de Ciências Agrárias, v. 54, n. 3, p. 225-234, 2011.
CAMPBELL, C. L.; MADDEN, L. V. Introduction to plant disease epidemiology. New York: John Wiley e Sons, 1990.
CHRISTOVAM, R. S.; RAETANO, C. G.; AGUIAR JUNIOR, H. O.; DAL-POGETTO, M. H. F. A.; PRADO, E. P.; GIMENES, M. J.; KUNZ, V. L. Assistência de ar em barra de pulverização no controle da ferrugem asiática da soja. Bragantia, v. 69, n. 1, p. 231-238, 2010.
CONAB-Campanha Nacional de Abastecimento. Acompanhamento da safra brasileira de grãos: décimo primeiro levantamento, agosto 2012. Companhia Nacional de Abastecimento. Brasília: Conab, 2012.
CUNHA, J. P. A. R.; REIS, E. F.; SANTOS, R. O. Controle químico da ferrugem asiática da soja em função de ponta de pulverização e de volume de calda. Ciência Rural,v. 36, n. 5, p. 1360-1366, 2006.
CUNHA, J. P. A. R.; TEIXEIRA, M. M.; FERNANDES, H. C. Avaliação do espectro de gotas de pontas de pulverização hidráulicas utilizando a técnica da difração do raio laser. Engenharia Agrícola, v. 27, n. esp., p. 10-15, 2007.
da deriva de agrotóxicos em pulverizações hidráulicas. Planta Daninha, v. 21, n. 10, p. 325-332, 2003.
CUNHA, J. P. A. R.; FARNESE, A. C.; OLIVET, J. J.; VILLALBA, J. Deposição de calda pulverizada na cultura da soja promovida pela aplicação aérea e terrestre. Engenharia Agrícola, v. 31, n. 2, p. 343-351, 2011. DI OLIVEIRA, J. R. G.; FERREIRA, M. C.; ROMÁN, R. A. A. Diferentes diâmetros de gotas e equipamentos para aplicação de inseticida no controle de Pseudoplusia includens.
Engenharia Agrícola, v. 30, n. 1, p. 92-99, 2010.
EMBRAPA-Empresa Brasileira de Pesquisa Agropecuária. Tecnologias de produção de soja - Região Central do Brasil 2009 e 2010. Londrina: Embrapa Soja/Embrapa Cerrados/Embrapa Agropecuária Oeste, 2008. (Sistemas de Produção, 13).
FAO-Food and Agriculture Organization of the United Nations. Agricultural pesticide sprayers. Rome: FAO, v. 2, p. 62, 1998.
FARINHA, J. V.; MARTINS, D.; COSTA, N. V.; DOMINGOS, V. D. Deposição da calda de pulverização em cultivares de soja no estádio R1. Ciência Rural, v. 39, n. 6, p. 1738-1744, 2009.
FAVARIN, J. L.; DOURADO NETO, D.; GARCÍA Y GARCÍA, A.; VILLA NOVA, N. A.; FAVARIN, M. G. G. V. Equações para a estimativa do índice de área foliar do cafeeiro. Pesquisa Agropecuária Brasileira, v. 37, n. 6, p. 769-773, 2002.
FERNANDES, A. P.; PARREIRA, R. S.; FERREIRA, M. C.; ROMANI, G. N. Caracterização do perfil de deposição e do diâmetro de gotas e otimização do espaçamento entre bico na barra de pulverização. Engenharia Agrícola, v. 27, n. 3, p. 728-733, 2007. FERNANDES FILHO, E. I.; VALE, F. X. R.; LIBERATO, J. R. QUANTv.1.0.0.22: Quantificação de doenças de plantas. Viçosa, 2002. (CD-ROM).
GARDIANO, C. G.; BALAN, M. G.; FALKOSKI FILHO, J.; CAMARGO, L. C. M.; OLIVEIRA, G. M.; IGARASHI, W. T.; SUDO, L. T.; IGARASHI, S.; ABI SAAB, O. J. G.; CANTERI, M. G. Manejo químico da ferrugem asiática da soja baseado em diferentes métodos de monitoramento. Arquivos do Instituto Biológico, v. 77, n. 3, p. 497-504, 2010.
GASPARETTO, R.; FERNANDES, C. D.; MARCHI, C. E.; BORGES, M. F. Eficiência e viabilidade econômica da aplicação de fungicidas no controle da ferrugem asiática da soja em campo grande, MS. Arquivos do Instituto Biológico, v. 78, n. 2, p. 251-260, 2011.
GODOY, C. V.; KOGA, L. J.; CANTERI, M. G. Diagrammatic scale for assessment of soybean rust severity. Fitopatologia Brasileira, v. 31, n. 1, p. 63-68, 2006. HEIFFIG, L. S.; CÂMARA, G. M. S.; MARQUES, L. A.; PEDROSO, D. B.; PIEDADE, S. M. S. Fechamento e índice de área foliar da cultura da soja em diferentes arranjos espaciais. Bragantia, v. 65, n. 2, p. 285-295, 2006. JULIATTI, F. C.; POLIZEL, A. C.; BALARDIN, R. S.; VALE, F. X. R. Ferrugem da soja: epidemiologia e manejo para uma doença reemergente. Revisão Anual de Patologia de Plantas, v. 13, n. 1, p. 351-395, 2005.
MURPHY, S. D.; MILLER, P. C. H.; PARKIN, C. S. The effect of boom section and nozzle configuration on the risk of spray drift. Journal of Agricultural Engineering Research, v. 75, n. 2, p. 127-137, 2000. NAVARINI, L.; DALLAGNOL, L. J.; BALARDIN, R. S.; MOREIRA, M. T.; MENEGHETTI, R. C.; MADALOSSO, M. G. Controle químico da ferrugem asiática (Phakopsora pachyrhizi Sidow). Summa Phytopathologica, v. 33, n. 2, p. 182-186, 2007.
NUYTTENS, D.; BAETENS, K.; DE SCHAMPHELEIRE, M.; SONCK, B. Effect of nozzle type, size and pressure on spray droplet characteristics. Biosystems Engineering, v. 97, n. 3, p. 333-345, 2007. OLIVEIRA, M. L.; MACHADO-NETO, J. G. Use of tracer in the determination of respiratory exposure and relative importance of exposure routes in safety of pesticide applicators in citrus orchards. Bulletin of Environmental Contamination and Toxicology, v. 70, n. 3, p. 415-421, 2003.
PRADO, E. P.; RAETANO, C. G.; AGUIAR JUNIOR, H. O.; POGETTO, M. H. F. A.; CHRISTOVAM, R. S.; GIMENES, M. J.; ARAÚJO, D. Velocidade do ar em barra de pulverização na deposição da calda fungicida, severidade da ferrugem asiática e produtividade da soja. Summa Phytopathologica, v. 36, n. 1, p. 45-50, 2010. RITCHIE, S.; HANWAY, J. J.; THOMPSON, H. E. How a soybean plant develops. Ames: Iowa State University of Science and Technology/Coop. Ext. Serv., Special Report, 53. 1982.
SERRA, M. E.; CHAIM, A.; RAETANO, C. G. Pontas de pulverização e eletrificação das gotas na deposição da calda em plantas de crisântemo. Pesquisa Agropecuária Brasileira, v. 43, n. 4, p. 479-485, 2008.
SOUZA, R. T.; CASTRO, R. D.; PALLADINI, L. A. Depósito de pulverização com diferentes padrões de gotas em aplicações na cultura do algodoeiro. Engenharia Agrícola, v. 27, n. esp., p. 75-82, 2007.
SOUZA, L. A.; CUNHA, J. P. R. A.; PAVANIN, L. A. Deposição do herbicida 2,4-D Amina com diferentes volumes e pontas de pulverização em plantas infestantes. Revista Ciência Agronômica, v. 43, n. 1, p. 78-85, 2012. VIANA, R. G.; FERREIRA, L. R.; FERREIRA, M. C.; TEIXEIRA, M. M.; ROSELL, J. R.; TUFFI SANTOS, L. D.; MACHADO, A. F. L. Distribuição volumétrica e espectro de gotas de pontas de pulverização de baixa deriva. Planta Daninha, v. 28, n. 2, p. 439-446, 2010. ZHU, H.; BRAZEE, R. D.; FOX, R. D.; DERKSEN, R. C.; OZKAN, H. E. Development of a canopy opener to improve spray deposition and coverage inside soybean canopies: Part 1. Mathematical models to assist opener development. American Society of Agricultural and Biological Engineers, v. 51, n. 6, p. 1905-1912, 2008.
Received on January 23, 2013. Accepted on May 16, 2013.
http://www.uem.br/acta ISSN printed: 1679-9275 ISSN on-line: 1807-8621