v.13, n.3, p.257–261, 2009
Campina Grande, PB, UAEA/UFCG – http://www.agriambi.com.br Protocolo 088.07 – 01/06/2007 • Aprovado em 25/07/2008
Soil water extraction by roots and Kc for the coffee crop
Adriana L. da Silva1, Isabeli P. Bruno2, Klaus Reichardt3, Osny O. S. Bacchi3, Durval Dourado-Neto2, José L. Favarin2, Flávio M. P. da Costa4 & Luis C. Timm5
ABSTRACT
Basic information for a rational soil-water management of the coffee crop is still insufficient, particularly under irrigated conditions. Of great importance for the estimation of water requirements of coffee crops are their root distribuition and evapotranspiration crop coefficients. This study compares soil water extraction by roots of coffee plants of the variety “Catuaí Vermelho” (IAC-44), grown in Piracicaba, SP, Brazil, 3 to 5 years old, with direct measurements of root dry matter, showing a good agreement between both approaches, and confirming that most of the root system is distributed in the top soil layer (0-0.3 m) and that less than 10% of the root system reaches depths greater than 1.0 m. Calculated evapotranspiration crop coefficients are in agreement with those found in the literature, with an average of 1.1, indepen-dent of shoot dry matter, plant height and leaf area index.
Key words: perenial crop, soil water storage, water balance
Extração radicular de água e Kc em cultura de café
RESUMO
A informação básica para o manejo racional de água e solo na cultura de café ainda é insuficiente, sobretudo em condições de cultura irrigada. A distribuição radicular e os coeficientes de cultura para evapotranspiração são de grande importância para a estimativa da necessidade de água na cultura café. Este estudo compara a extração radicular de água de plantas de café, variedade “Catuaí Vermelho” (IAC-44), cultivado em Piracicaba, SP, Brasil, de 3 a 5 anos de idade, com medidas diretas de material seca de raiz, mostrando boa relação entre as metodologias e confirmando que a maioria do sistema radicular está distribuída na camada superficial de solo (0-0,3 m) e que menos de 10% do sistema radicular atingem profundidades maiores que 1,0 m. Os coeficientes de cultura medidos estão de acordo com aqueles encontrados na literatura, com média de 1,1, independentemente da matéria seca, altura de planta e índice de área foliar.
Palavras-chave: cultura perene, armazenamento de água no solo, balanço hídrico
1CTC – Fazenda Santo Antônio, s/n, C.P. 162, CEP 13400-970, Piracicaba, SP. Fone: (19) 3429-8161. E-mail: [email protected]
2ESALQ/USP – C.P. 9, CEP 13418-900, Piracicaba, SP. Fone: (19) 3429-4190. E-mail: [email protected]; [email protected]; [email protected] 3CENA/USP/ – C.P. 96, CEP 13416-903, Piracicaba, SP. Fone: (19) 3429-4712. E-mail: [email protected]; [email protected]
I
NTRODUCTIONCoffee is among the most important crops grown in Bra-zil and, recently, its cultivation reached areas previously con-sidered not adequate due to their pronounced water deficit, which is corrected by supplementary irrigation. This tech-nology brings lower production risks and allows efficient fertilizer use, improving quantity and quality of the product (Silva, 2002). These facts justify research investments to refine management practices in relation to system sustain-ability and cost/benefit ratio. Due to these facts any improve-ment in coffee manageimprove-ment practices is welcome. Although the actual state of knowledge of the processes that involve water and nutrient dynamics in coffee crops is well devel-oped, there is still room to generate or improve field prac-tices that lead to a greater sustainability, a greater produc-tivity, and a greater efficiency in the use of the available natural resources.
Camargo & Camargo (2001) recognize that the coffee crop, being perenial, takes two years to complete its pheno-logic frutification cycle, composed of six distinct phases, starting in September for most climatological conditions in Brazil: 1), vegetative, from Set. to Mar., exposed to long days; 2), also vegetative, from Apr. to Aug., exposed to short days, when vegetative nodes formed during the 1st phase are
induced to become reproductive, representing a period of rel-ative rest for the plant, followed by the maturation of the reproductive nodes; 3), flowering being induced by rainfall or irrigation, due to an elevation of the water potential in the floral nodes (hydric shock); 4), fruit filling, from Jan. to Mar.; 5), fruit maturation, from Apr. to Jun.; 6), senescence of productive brances which will no longer be induced to flower. During these phases the crop requires soil water to supply 1,100 to 1,300 mm for evapotranspiration. Therefore, root distributions and shoot architecture are of great impor-tance for a rational water management of the crop. Santinato et al. (1996) present evapotranspiration crop coefficients for several crops grown in the states of Minas Gerais and Ba-hia (Brazil), related to crop line spacing and crop age. In another study, Cordeiro et al. (1987) apud Rena (1998) ob-served for 6 year old coffee shrubs, that 90% of the root sys-tem explored the 0-0.5 m soil layer, presenting a large con-centration of absorbing roots in the surface layer, probably due to irrigation and fertilizer application practices. Rena (1998) states that, in most Brazilian soils, the coffee plant does not present deep roots, 85% of them being distributed below plant canopy, mostly near the stem. Martins et al. (2006) concluded that coffee, irrigated with 80 to 100% of the Class A pan evapotranspiration, presents larger values of root dry matter as compared to non irrigated plants. In relation to evapotranspiration crop coefficients, Arruda et al. (2000), Rena & Maestri (2000), and Villa Nova et al. (2002) indicate the importance of crop management conditions like plant population, spacing and interrow condition.
This study used field water balance data (Silva et al., 2006; 2007), established during one complete phenologic cycle of the coffee crop, to estimate root distribution and crop coeffi-cients from plant soil water extraction data.
M
ATERIALANDMETHODSA water balance experiment was carried out in Piracicaba, SP, Brazil (22° 42’ S, 47° 38’ W, 580 m above sea level) on a Rhodic Kandiudalf, locally called “Nitossolo Vermelho Eutroférrico” (EMBRAPA, 1999), under a “Cwa” climate (Köppen, 1931). A three year old coffee crop (Coffea arabi-ca L.), cultivar “Catuaí Vermelho” (IAC-144) was used to evaluate soil water extraction and evapotranspiration crop coefficients during two years (Sept 01, 2003 to Aug 31, 2005). Plant rows followed contour lines on a 10% slope with a spacing of 1.75 m between rows and 0.75 m between plants. In an area of approximately 0.2 ha, five plots of about 120 plants were selected randomly for water balance establish-ment, which can be found elsewhere (Silva et al., 2006). The classical water balance equation was used, integrated over 14-day periods (∆t = ti+14− ti):
in which P = rainfall (mm); I = irrigation (mm); ER = actual evapotranspiration (mm); ∆SL= soil water storage changes
(mm) in the z = 0 to z = L = 1.0 m soil layer; RO = run-off (mm) and QL= drainage soil water fluxes at the lower soil
volume limit, taken as z = L = 1.0 m, all during periods ti
and ti+14, i being the time index corresponding to days after
beginning (DAB); i = 1 stands for September 1, 2003. From this date onwards, 52 fourteen-day water balances were es-tablished (Silva et al., 2006), up to 720 DAB.
Soil water extraction by roots
In order to estimate the extraction of water by roots (RE) only balances for which P, I, RO and QL were null were
se-lected, so that Eq. 1 is reduced to ER =∆S. Assuming that
the evaporation from the soil surface is negligibe in relation to plant transpiration, ∆S would represent RE. This
assump-tion is acceptable based on the fact that the soil surface was always almost completely covered by dead coffee leaf mulch, and that a good weed control was maintained in the inter-rows during the whole experimental period. At the end of the experiment, interrows were already shaded by coffee branches, so that the canopy represented a full green cover. Soil water storage changes ∆S were calculated from soil
water content θ(zj, ti), (m3m-3) measurements obtained
us-ing a neutron probe (Bacchi et al., 2002), set at depths zj (j
corresponding to a depth index, j = 0 for soil surface, using
∆z = 0.2 m). The chosen depths for measurements were j = 1
for z = 0.2; j = 2 for z = 0.4; j = 3 for z = 0.6; j = 4 for z = 0.8 and j = 5 for z = 1.0 m from the soil surface, made at times ti and ti+14. Using the trapezoidal rule, we have:
In which L taken as 1,000 mm in order to obtain ∆S in mm.
To estimate coffee root distribuition, ∆S was also
esti-mated by layers for the periods ∆t = ti+14−ti. Since neutron
probe measurements of θ are averages of a soil volume (1)
P+I-ER± DS -RO-Q =0
L L
(2)
5 L
5 5
corresponding to spheres of 0.20 to 0.30 m diameter (de-pending on soil water content), it was assumed that each q measurement represents the average of the following soil layers: θj=1 represents the 0-0.3 layer; θj=2 the 0.3-0.5
lay-er; θj=3 the 0.5-0.7 layer; θj=4 the 0.7-0.9 layer; and θj=5 the
0.9-1.0 layer. In this way, it is assumed that the θj=1
mea-surement includes the soil surface, which was not measured, and that θj=5 corresponds only to the 0.9-1.0 m layer. These
averages, multiplied by each respective layer thickness in mm, yield layer soil water storages.
Since the number of balances that attend the restriction
∆S = RE is small, it was decided to also include balances of
small values of P, specifically those in which P would not have reached the depth z = 0.3 m, the limit of the first layer used in the calculations. When P is large and reaches depths greater than z = 0.3 m, it would not be possible to differen-tiate the water extracted from the 0-0.3 m layer from that of the 0.3-0.5 layer. To choose these balances, the criterium of P < DEF (0-0.3) was used, in which DEF (0-0.3) is the def-icit of soil water (mm) in relation to field capacity, deter-mined under field conditions.
Evapotranspiration crop coefficients
The actual evapotranspiration ER was taken as an unknown in Eq. 1 and estimated from the difference of all other com-ponents. The reference evapotranspiration (ETo) of a green
grass surface was estimated through the Penman-Monteith model (Pereira et al., 1997) using meteorological data collected by an automated weather station, located about 200 m from the experimental plots. The crop coefficient (Kc) for coffee was
calculated by the ratio ER/ETo only for balances in which the
soil was close to field capacity, RO = 0 and QL= 0. For these
particular balance periods P was of the same order of magni-tude as ER, to assure that there was no restriction of soil wa-ter, so that ER could be considered equal to ETc.
Crop growth and development
The study also involved growth and development analyses of the coffee plants, sampling every 60 days the aerial part of whole plants to evaluate dry matter, plant height and total leaf area (TLA, m2) using an area integrator model LAI – 3000.
The foliar area index (LAI) was calculated by the ratio of TLA and the area occupied by one plant (0.75 x 1.75 = 1.313 m2).
Data were interpolated using a spline curve adjustment, in order to obtain intermediate values for all balances.
The direct measurement of the root system was performed only at the end of each cropping year (366 and 720 DAB), in order to minimize plot disturbance during the experimen-tal period, and was made through auger samplings performed in the same layers as those used to estimate DS changes.
R
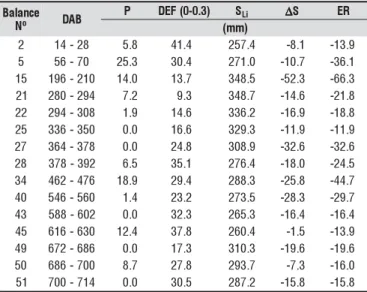
ESULTSANDDISCUSSIONFrom the 52 consecutive water balances made over the two year period (2003-2005), only 15 attend the criteria used for the calculation of RE (Table 1). The values of RE, calculat-ed for each soil layer and averagcalculat-ed for each year (Table 2),
indicate the importance of the surface layer (0-0.3 m) in con-tributing to the total RE. Although the coffee root system de-velopment is bound primarily to plant genetic characteris-tics, other factors can also alter its spatial distribution, like the available water in the soil (Franco & Inforzato, 1946) and the nutrient availability for the plant (Amaral, 2002 apud Barreto et al., 2006). Irrigation practices may also affect pri-mary and secondary root growth in the different soil layers (Barros et al., 1997). In our case, irrigation was applied only once a year, at the end of the dry winter season, when plants were suffering a severe water deficit and a flower fall could occur, affecting productivity. Therefore, irrigation most likely did not affect root distribution, which is a result of the wa-ter regime in Piracicaba.
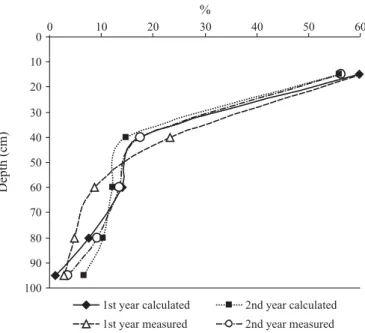
The contribution of each layer decreases drastically with depth, the value for the last layer (0.9-1.0 m) being very small for both years, showing that the root system did not extend significantly below the 1.0 depth. The high values of the stan-dard deviations (SD) and, consequently of the coefficients of variation (CV), are the result of the temporal variability of the microclimatic conditions of the periods used for their evalua-tion, which can be appreciated through the values of ER shown in Table 1. In terms of percent (Figure 1), RE data show great
Table 1. Water balances selected for the calculation of root extraction (RE)
e c n a l a B
Nº DAB
P DEF(0-0.3) SLi ∆∆∆∆∆S ER
) m m (
2 14-28 5.8 41.4 257.4 -8.1 -13.9 5 56-70 25.3 30.4 271.0 -10.7 -36.1
5
1 196-210 14.0 13.7 348.5 -52.3 -66.3 1
2 280-294 7.2 9.3 348.7 -14.6 -21.8 2
2 294-308 1.9 14.6 336.2 -16.9 -18.8 5
2 336-350 0.0 16.6 329.3 -11.9 -11.9 7
2 364-378 0.0 24.8 308.9 -32.6 -32.6 8
2 378-392 6.5 35.1 276.4 -18.0 -24.5 4
3 462-476 18.9 29.4 288.3 -25.8 -44.7 0
4 546-560 1.4 23.2 273.5 -28.3 -29.7 3
4 588-602 0 0. 32.3 265.3 -16.4 -16.4 5
4 616-630 12.4 37.8 260.4 -1.5 -13.9 9
4 672-686 0 0. 17.3 310.3 -19.6 -19.6 0
5 686-700 8.7 27.8 293.7 -7.3 -16.0 1
5 700-714 0 0. 30.5 287.2 -15.8 -15.8
DAB = days after beginning; 14 to 350 DAB = 1st year; 344 to 714 = 2nd year. P = rainfall; DEF
(0-0.3) = soil water deficit of the 0-0.3 m soil layer at the beginning of each balance, SLi = initial
soil water storage of the 0-1.0 m layer ; ∆SL = change in water storage; ER = actual
evapotranspiration
1styear 2ndyear e g a r e v A d m m
( -1) SD CV
e g a r e v A d m m
( -1) SD CV
∆S0-30 -1.25 0.96 -77.44 -0.99 0.46 -46.27 ∆S30-50 -0.30 0.26 -84.79 -0.25 0.13 -52.79 ∆S50-70 -0.26 0.25 -97.84 -0.21 0.12 -60.16 ∆S70-90 -0.16 0.21 -128.54 -0.20 0.17 -89.08
∆S90-100 -0.04 0.09 -227.31 -0.13 0.10 -80.36 ∆S0-100 -2.01 1.47 -73.08 -1.76 0.75 -42.58
consistency in relation to year and to the direct root dry mass measurements. On average, the 0-0.3 m layer contributes with 58% of the total, showing evidence of the importance of this soil layer in the water management of the coffee crop.
Also, from the 52 consecutive water balances, only 17 could be selected to calculate the evapotranspiration crop coefficients Kc (Table 3) using the adopted criteria. The variability of the
Kc data oscilated between 0.75 and 1.43, with averages for the
1st year: 1.12; SD = 0.23; CV = 20.4%, and for the 2nd year:
average = 1.09; SD = 0.18; CV = 16.3%, so that an overall
average of Kc= 1.11; SD = 0.20; CV = 18.4, could represent
well this coffee variety grown under the experimental condi-tions. This value is in agreement with others found in the liter-ature, eg Villa Nova et al. (2002), which present a new approach to estimating Kc, taking into account plant population, spac-ing and interrow condition. They, however, do not indicate number of replicates and estimation errors, so that it is not possible to judge if their Kc values differ for field conditions. They conclude that Kc varies with plant growth, despite the fact that they include leaf area measurements in the Kc calculation. Silva et al. (2006) shows that the variability of all water bal-ance components is of great importbal-ance, especially that of ER (in their case with very high coefficients of variation) which lead to a high variability in Kc calculations. Due to the phenologic frutification cycle (Camargo & Camargo, 2001), the crop in-vested more in leaf production during the first year, which is reflected in higher values of LAI towards the end of this year (Table 3). It was also observed that the total shoot dry matter (SDM) also had a much higher contribution from leaves dur-ing the first year as compared to the second year, durdur-ing which the higher contribution was due to fruits. The SDM decrease from one year to the other is due to the physiological fall of old leaves and to harvest, during which fruit and some leaves are exported. Although for each year the values of LAI increase consistently, the correspondent Kc values oscilate randomly. Linear regressions between LAI and Kc, and SDM and Kc
pre-sented very low and non-significant regression coefficients, so that Kc could not be related to the growth of the plants,
evalu-ated through foliar area and shoot dry matter accumulation.
C
ONCLUSIONS1. Coffee plants, variety “Catuaí Vermelho” (IAC-44), 3 to 5 years old, grown in Piracicaba, SP, showed a root dis-tribution that covers mainly the top layer (0-0.3 m) 58%, with less than 10% below the 1.0 m depth.
2. The variability of the evapotranspiration measurements made from field water balances did not allow the observa-tion of the dependence of Kc on plant growth parameters.
3. An average value of 1.1, with a coefficient of variation of 18.4%, was obtained.
L
ITERATURECITEDArruda, F. B.; Iaffe, A.; Sakai, E.; Calheiros, R. O. Resultados anuais do coeficiente de cultura do cafeeiro em um ensaio em Pindorama/SP. In: Simpósio de Pesquisapuda dos Cafés do Brasil, 1, 2000, Poços de Caldas, Anais... Brasília: Embrapa Café/Minasplan, 2000. v.2, p.790-793.
Bacchi, O. O. S.; Reichardt, K.; Calvache, M. Neutron and gamma probes: their use in agronomy. In: Training course series... Vienna: International Atomic Energy Agency, 2002. p.75. Barros, R. S.; Mota, J. W. da S.; Matta, F. M. da; Maestri, M.
De-cline of vegetative growth in Coffea arabica L. in relation to leaf temperature, water potential and stomatal conductance. Field Crops Research, v.54, p.65-72, 1997.
0
10
20
30
40
50
60
70
80
90
100
0 10 20 30 40 50 60
%
Depth (cm)
1st year calculated 2nd year calculated
1st year measured 2nd year measured
Figure 1. Average % values of root extraction (RE) of each layer in relation to the total, comparing calculated values through Eq. 2 with field measured values
Table 3. Water balances selected for the calculation of the evapotranspiration crop coefficient (Kc) for coffee*
e c n a l a B
Nº DAB
P ER ET0
Kc LAI SkDgM PmH )
m m (
6 70-84 75.06 -62.3 -60.3 1.03 4.0 0.85 1.30 7 84-98 89.74 -72.0 -50.5 1.43 4.5 0.95 1.33 8 98-112 49.30 -57.5 -62.4 0.92 5.4 1.00 1.35 9 112-126 85.60 -68.1 -57.5 1.18 5.6 1.07 1.36
0
1 126-140 50.60 -52.2 -63.2 0.83 6.2 1.18 1.39 5
1 196-210 14.00 -62.4 -55.3 1.13 9.1 1.80 1.53 6
1 210-224 65.20 -64.2 -47.7 1.35 9.4 1.88 1.57 7
1 224-238 52.30 -51.7 -36.1 1.43 9.6 1.95 1.60 8
1 238-252 23.20 -29.6 -35.6 0.83 9.5 2.01 1.61 9
1 252-266 25.50 -25.6 -24.4 1.05 9.1 2.20 1.63 1
3 420-434 11.80 -52.2 -53.9 0.97 4.0 1.70 1.81 2
3 434-448 87.36 -72.1 -57.8 1.25 4.3 1.80 1.82 3
3 448-462 32.78 -73.1 -64.6 1.13 4.6 1.90 1.83 4
3 462-476 18.88 -45.1 -59.9 0.75 5.0 2.05 1.85 5
3 476-490 75.20 -64.8 -54.5 1.19 5.3 2.20 1.86 8
3 518-532 30.00 -88.9 -71.3 1.25 8.1 3.01 1.89 9
3 532-546 46.50 -74.5 -68.2 1.09 8.5 3.15 1.91
* DAB – days after beginning; 70 DAB to 266 DAB – 1st year; 420 DAB to 546 DAB – 2nd year;
P – rainfall; ER – actual evapotranspiration; ETo– Penman-Monteith potencial evapotranspiration;
Camargo, A. P.; Camargo, M. B. P. Definição e esquematização das fases fenológicas do cafeeiro arábica nas condições tropicais do Brasil. Bragantia, v.60, n.1, p.65-68, 2001. EMBRAPA – Empresa Brasileira de Pesquisa Agropecuária.
Centro Nacional de Pesquisa de Solo. Sistema brasileiro de classificação de solos. Brasília: Embrapa CNPS, 1999. 412p. Köppen, W. Grundriss der Klimakunde. Berlin: Walter D. E.
Guyter & Co. 1931. 390p.
Martins, C. C.; Reis, E. F.; Busato, C.; Pezzopane, J. E. M. Crescimento inicial do café Conilon (Coffea canephora Pierre ex Froehner) sob diferentes lâminas de irrigação. Engenharia na Agricultura, v.14, n.3, p.193-201, 2006.
Pereira, A. R.; Villa Nova, N. A.; Sediyama, G. C. Evapo(transpi)ração. Piracicaba: FEALQ, 1997. 183p.
Rena, A. B. A água na fisiologia do cafeeiro. In: Simpósio Estadual do Café, 3, 1998, Vitória. Palestras, painéis e debates... Vitória: CETCAF, 1998. p.132-152.
Rena, A. B; Maestri, M. Relações hídricas no cafeeiro. In: Irrigação e tecnologia moderna. Brasília: ABID, 2000. v.48, p.34-41.
Santinato, R.; Fernandes, A. L. T.; Fernandes, D. R. Irrigação na cultura do café. Campinas: Arbore Agrícola e Comércio, 1996. 146p.
Silva, A. L da. Estudo técnico e econômico do uso do sistema de irrigação por gotejamento na cultura do cafeeiro (Coffea arabica L.). Lavras: UFLA, 2002. 67p. Dissertação Mestrado Silva, A. L. da; Reichardt, K.; Roveratti, R.; Bacchi, O. O. S.;
Timm, L. C.; Oliveira, J. C. M.; Dourado Neto, D. On the use of soil hydraulic conductivity functions in the field. Soil & Tillage Research, v.93, p.162-170, 2007.
Silva, A. L. da; Roveratti, R.; Reichardt, K.; Bacchi, O. O. S.; Timm, L. C.; Bruno, I. P.; Oliveira, J. C. M.; Dourado Neto, D. Variability of water balance components in a coffee crop grown in Brazil. Scientia Agricola, v.63, p.105-114, 2006.
![Solubility of Benzo[a]pyrene and Organic Matter of Soil in Subcritical Water](data:image/gif;base64,R0lGODlhAQABAIAAAP///wAAACH5BAEAAAAALAAAAAABAAEAAAICRAEAOw==)