Uniformity trial size in estimates of plot size in restrict areas
1Tamanho de ensaio de uniformidade para estimação do tamanho de parcela em áreas
restritas
Diogo Vanderlei Schwertner2*, Alessandro Dal’Col Lúcio3 e Alberto Cargnelutti Filho3
ABSTRACT - The aim of this study was to determine the uniformity trial size when estimating optimum plot size in order to evaluate fresh phytomass in lettuce plants and fruit weight in sweet peppers. Production data, collected in uniformity trial on lettuce in a plastic greenhouse in both summer and winter, lettuce in plastic tunnels in autumn and winter, and sweet pepper in a plastic greenhouse in the summer-autumn and spring-summer seasons, were used to plan different uniformity trial sizes in crop rows. In all the experiments, each plant was evaluated individually and considered as a basic experimental unit. For each size in a uniformity trial, 3,000 resamples, randomly taken with replacement, were used to estimate optimum plot size. Uniformity trial using 27 basic experimental units to evaluate the fresh phytomass of lettuce plants, and with 29 basic experimental units to assess fruit weight in sweet pepper, are sufficient to estimate optimum plot size, with an amplitude of the 95% confidence interval of less than or equal to two basic experimental units.
Key words:Lactuca sativa.Capsicum annuum. Experimental design.
RESUMO - O objetivo deste trabalho foi determinar o tamanho de ensaio de uniformidade para estimar o tamanho ótimo de parcela a fim de avaliar a fitomassa fresca de plantas de alface e a massa de frutos de pimentão. Dados de produção coletados em ensaios de uniformidade com alface em estufa plástica nas estações verão e inverno, com alface em túnel plástico nas estações outono e inverno, e com pimentão em estufa plástica nas estações verão-outono e primavera-verão, foram utilizados para planejar diferentes tamanhos de ensaios de uniformidade dentro das linhas de cultivo. Em todos os experimentos cada planta foi avaliada, individualmente, e considerada uma unidade experimental básica. Para cada tamanho de ensaio de uniformidade, foram realizadas aleatoriamente, e com reposição, 3.000 reamostras, que foram utilizadas para estimar o tamanho ótimo de parcela. Ensaios de uniformidade com 27 unidades experimentais básicas para avaliar a fitomassa fresca de plantas de alface e com 29 unidades experimentais básicas para avaliar a massa de frutos de pimentão são suficientes para estimar o tamanho ótimo de parcela com amplitude do intervalo de confiança de 95% menor ou igual a duas unidades experimentais básicas.
Palavras-chave:Lactuca sativa. Capsicum annuum. Planejamento experimental.
DOI: 10.5935/1806-6690.20150043 *Autor para correspondência
1Recebido para publicação em 19/02/2014; aprovado em 31/03/2015
Parte da Tese de Doutorado do primeiro autor apresentada ao Programa de Pós-Graduação em Agronomia da Universidade Federal de Santa Maria/UFSM
2Programa de Pós-Graduação em Agronomia, Universidade Federal de Santa Maria, Campus Universitário, Camobi, Santa Maria-RS, 97.105-900,
Brasil, vs.diogo@gmail.com
3Departamento de Fitotecnia/Centro de Ciências Rurais, Universidade Federal de Santa Maria, Campus Universitário, Camobi, Santa Maria-RS, 97.105-900,
INTRODUCTION
The lettuce (Lactuca sativa) and sweet pepper
(Capsicum annuum) are important crops for Brazilian
horticulture. According to the most recent Brazilian Agricultural Census, in 2006 the lettuce was the leaf vegetable with the largest production volume (525,602,000 tonnes), while production of the sweet pepper was 276,767,000 tonnes (INSTITUTO BRASILEIRO DE GEOGRAFIA E ESTATÍSTICA, 2006).
Because of the socio-economic importance of lettuce and sweet peppers, and the need to improve cultivation techniques, every year several experiments are carried out on these crops, with an aim to minimising experimental error and obtaining accurate conclusions about the treatments under evaluation.
When cultivating vegetables in a protected environment, variability is introduced due to the proximity of the crop rows to the sides of the plastic tunnels
(LORENTZ et al., 2005), to intensive management and
damage to the crop (LÚCIO et al., 2008), to faults in
the irrigation system (CARPES et al., 2008), to leaks
and infiltration, to shading by the structure and to the
heterogeneity of the soil (LÚCIO et al., 2011). To this
effect, designing experiments in tunnels and plastic greenhouses by determining plot size is essential for
increasing experimental precision (STORCK et al., 2011)
and maximising the information obtained from the available experimental area (CARGNELUTTI FILHO
et al., 2011a; STORCK; BISOGNIN; OLIVEIRA, 2006).
To estimate plot size, uniformity trial are carried out, also known as blank trials (with no treatment), in which the whole experimental area is managed uniformly, and the individual production data of each plant is evaluated in order to learn the variability of the
area and estimate plot size (STORCKet al., 2011).
Paranaiba, Ferreira e Morais (2009) developed the method of maximum curvature of the coefficient of variation model (MCCV) for estimating plot size from uniformity trial. This method has been validated for rice (PARANAIBA; FERREIRA; MORAIS, 2009), wheat and manihot (PARANAIBA; MORAIS; FERREIRA, 2009),
maize (CARGNELUTTI FILHO et al., 2011b), wild
radish (CARGNELUTTI FILHOet al., 2011a) and tomato
(LÚCIO et al., 2012). According to Paranaiba, Ferreira
e Morais (2009), the advantage of the MCCV method over the methods of maximum curvature (LESSMAN; ATKINS, 1963) and modified maximum curvature (MEIER; LESSMAN, 1971) is that the grouping of data from adjacent basic experimental units is not necessary. This suggests that the MCCV method is the most suitable for estimating plot size from small uniformity trial carried
out in tunnels and plastic greenhouses, where the trial is generally restricted to the size of the existing facilities (LORENTZ; LÚCIO, 2009).
Some studies have been carried out to estimate plot size in the sweet pepper (LORENTZ; LÚCIO,
2009; LÚCIO et al., 2004), tomato (LÚCIO et al.,
2010, 2012.), lettuce (LÚCIO et al., 2011) and green
bean (SANTOS et al., 2012). However, these studies
were not concerned with investigating whether the sizes used in the uniformity trial were sufficient to accurately estimate the plot size.
Cargnelutti Filhoet al. (2011a) concluded that,
in the wild radish, the size of the uniformity trial has an influence on estimates of plot size, and that trials with 225 basic experimental units (BEU) are sufficient to estimate plot size for an amplitude of the 95% confidence interval of less than or equal to one BEU.
The MCCV method was used by Lúcio et al.
(2012) to estimate plot size in the tomato, but there is no information on the influence of the size of the uniformity trial on the reliability of estimates of plot size in vegetables. The aim of this work therefore was to determine the uniformity trial size, so as to estimate plot size in restrict áreas.
MATERIAL AND METHODS
Data on the fresh phytomass from lettuce plants and the fruit weight of sweet pepper plants were used, collected in uniformity trial (experiments without the application of treatments), which were carried out in a protected environment (tunnel and plastic greenhouse) in the experimental area of the Department of Plant Science of the Federal University of Santa Maria (UFSM) (latitude 29°43’S, longitude 53°43’W, at an altitude of 95m), in Santa Maria, in the state of Rio Grande do Sul, Brazil (Table 1). The climate in the region according to the Köppen classification (MORENO, 1961) is of type Cfa (humid subtropical, no defined dry season, with hot summers). The soil is classified as an arenic dystrophic Red Argisol
(STRECKet al., 2008).
The lettuce cultivar Vera was used for the crop grown in a plastic greenhouse during the summer and winter, and the cultivar Amanda for the crop grown in plastic tunnels during the autumn and winter, giving a total of four experiments. In the experiments in the greenhouse, the plants were arranged in six rows of 48 plants each. In the experiment in the tunnels, the plants were arranged in three rows of 64 plants each in the autumn, and in three rows of 60 plants each in the winter (Table 1). In the four experiments the rows were spaced one metre apart with 0.3 m between plants.
For the crop of sweet pepper, the Vidi cultivar was used, grown in a plastic greenhouse in the summer-autumn and spring-summer seasons. In the two experiments, the crop was grown in eight rows of 70 plants each, with one meter between rows and 0.30 m between plants (Table 1). In the four experiments on the lettuce and the two on the sweet pepper, the seedlings were transplanted when showing four true leaves, and fertilisation and liming carried out according to the results of the soil analysis and the recommendations of the Sociedade Brasileira de Ciência do Solo (2004). The plants were grown on ridges with no mulching, and irrigation was by drip. Pests and diseases were controlled preventively, with all the managements being applied uniformly, as per the recommendations for each crop.
In all the experiments each plant was evaluated individually and considered as a basic experimental unit (BEU). In the experiments with the lettuce, the fresh phytomass (FP in grams) was evaluated, and with the sweet pepper, the weight of the fruit (FW in grams) was taken.
Different sizes for the uniformity trial were planned within each crop row (Table 1), based on the FP data for the lettuce and the FW for the sweet pepper, and due to the heterogeneity seen between rows in the experiments in the protected environment (LORENTZ
et al., 2005; LÚCIO et al., 2006, 2011). The initial
Table 1 - Summary of the uniformity trial carried out with the lettuce and sweet pepper crops and a breakdown of the planned sizes of the uniformity trial within each crop row for the estimation of the optimum plot size
(1)BEUs, basic experimental unit of one plant
Crop Environment Season Nº of rows Nº of plants per row Nº of BEUs(1) Uniformity trial planned in BEUs
Lettuce Greenhouse Winter 6 48 288 3, 4, ..., 23, 24
Lettuce Greenhouse Summer 6 48 288 3, 4, ..., 23, 24
Lettuce Tunnel Autumn 3 64 192 3, 4, ..., 31, 32
Lettuce Tunnel Winter 3 60 180 3, 4, ..., 29, 30
Pepper Greenhouse Summer-Autumn 8 70 560 3, 4, ..., 34, 35
Pepper Greenhouse Spring-Summer 8 70 560 3, 4, ..., 34, 35
sample size (the smallest) in the uniformity trial in all the experiments was three adjacent BEUs in any one row. The final size (the largest) was set as half the number of BEUs per row (Table 1).
Three thousand resamples with replacement were carried out for each of the planned sizes for the uniformity trial, and for each resampling the first-order spatial
autocorrelation coefficient (p), variance (s2), mean (m) and
optimum plot size (Xo) were estimated using expression 1:
(1)
the coefficient of variation at the optimum plot size (CV) using expression 2:
(2)
(PARANAIBA; FERREIRA; MORAIS, 2009), and the coefficient of variation of the uniformity trial (CVe). The minimum, 2.5 percentile, mean, 97.5 percentile and
maximum values of p, s2, m, Xo, CV and CVe were
also estimated.
For sample size in the uniformity trial using four adjacent BEUs in the crop row, the following procedure was employed: in the first resampling, one BEU between the first and the 45 th BEU in the row was selected at random. Assuming that the 45 th BEU was selected, then the first uniformity trial would comprise the 45 th, 46 th, 47 th and 48 th BEUs. The same procedure was followed for the remaining 2,999 resamples in the trials with four BEUs. For the remaining planned sample sizes in the uniformity trial (Table 1), the same procedure was followed as in the trials using three and four BEUs.
For the Xo statistic, the amplitude of the 95% confidence interval was calculated from the difference between the 2.5 and 97.5 percentiles. Subsequently the uniformity trial size in BEUs was determined for estimating the optimum plot size, starting with the initial size (three BEUs) and taking as the trial size the number of BEUs at which the amplitude of the 95% confidence interval was less than or equal to two BEUs. Statistical analyses were performed using the R software (R DEVELOPMENT CORE TEAM, 2014).
RESULTS AND DISCUSSION
The fresh phytomass (FP) of the winter lettuce
evaluated in the greenhouse varied from 55 to 229 g plant-1,
the average being 124.01 g plant-1 with a coefficient of
variation (CV) of 31.88%. Also in the greenhouse, but in the summer, the FP of the lettuce varied from 100 to 474
g plant-1 with an average of 240.72 g plant-1 and a CV of
32.64%. The FF of the lettuce cultivated under tunnels in
the winter ranged from 50 to 236 g plant-1, the average
being 130.27 g plant-1 with a CV of 36.16%. For the
lettuce under tunnels, but in the autumn, the FF ranged
from 117 to 433 g plant-1, the average being 290.18 g
plant-1 with a CV of 24.07%. The fruit weight (FW) of the
sweet pepper evaluated in the greenhouse in the
summer-autumn varied from 140 to 1681 g plant-1, with an average
of 751 g plant-1 and a CV of 37.04%. For the sweet pepper
in the greenhouse, but in the spring-summer, the FW
varied from 284 to 2916 g plant-1, with an average of 1,186
g plant-1 and a CV of 36.53%. Consequently, the various
uniformity trial on the lettuce and sweet pepper are seen to lend credibility to the proposed study, as they display levels of productivity which reflect the actual conditions of experiments conducted in protected environments and, above all, a variability that is important in the study of the optimum plot size and of the uniformity trial.
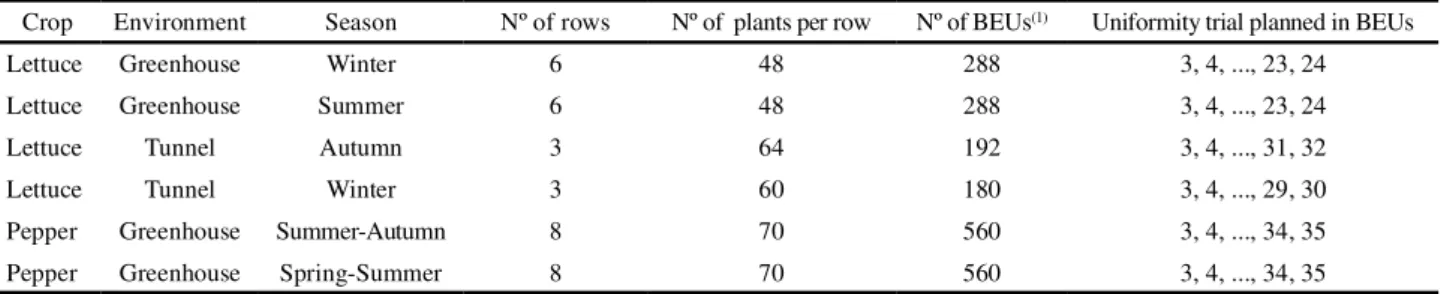
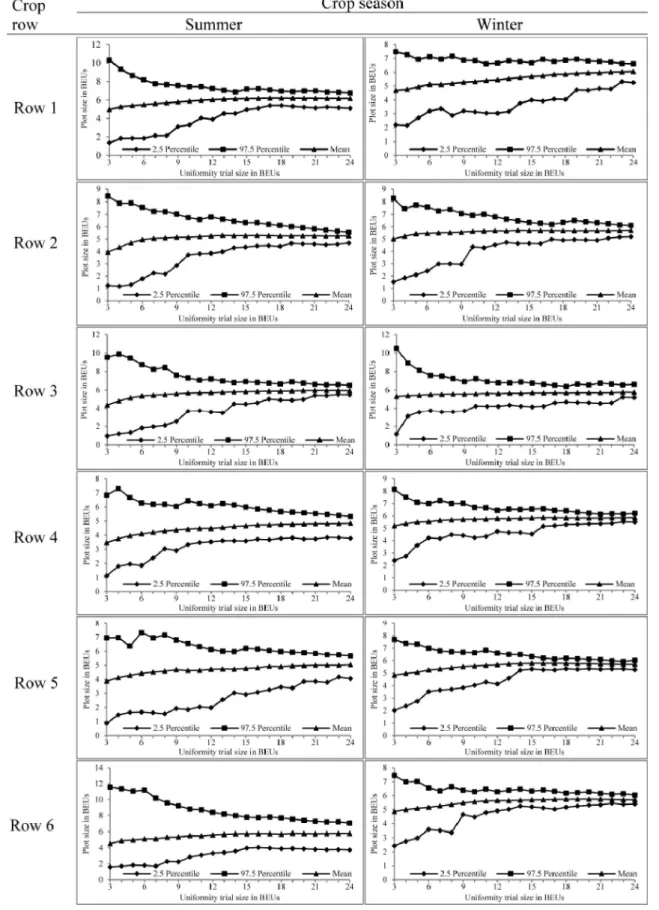
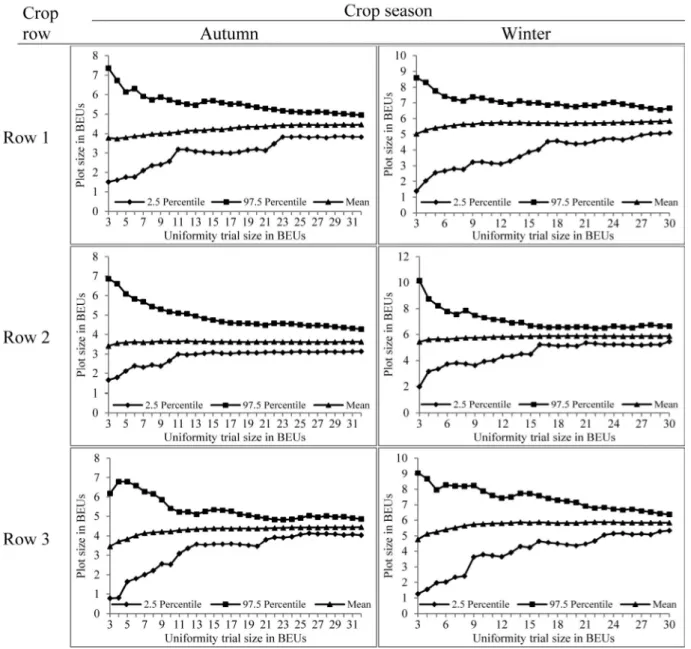
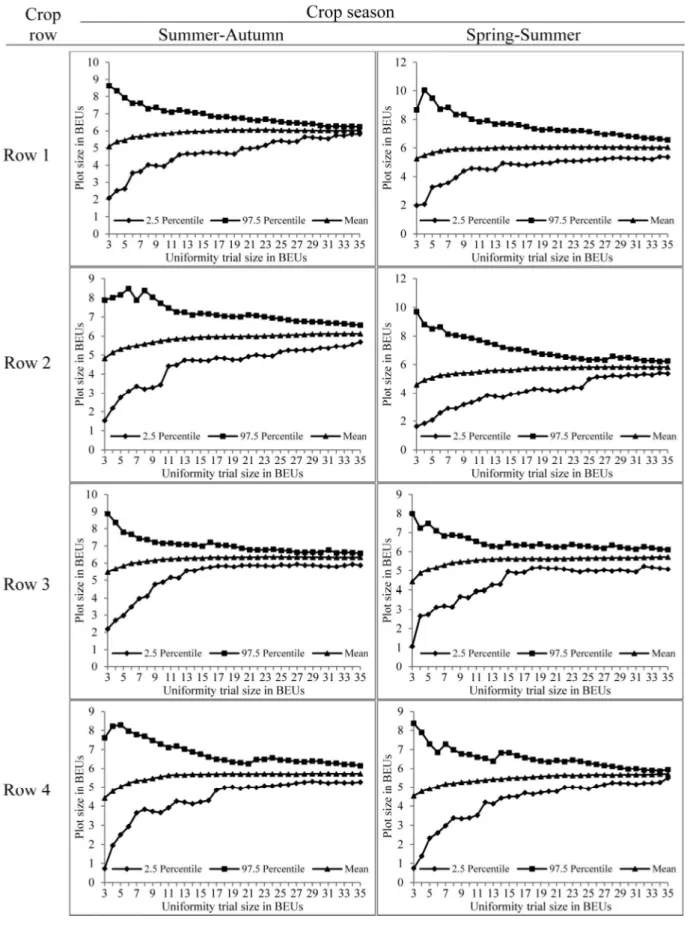
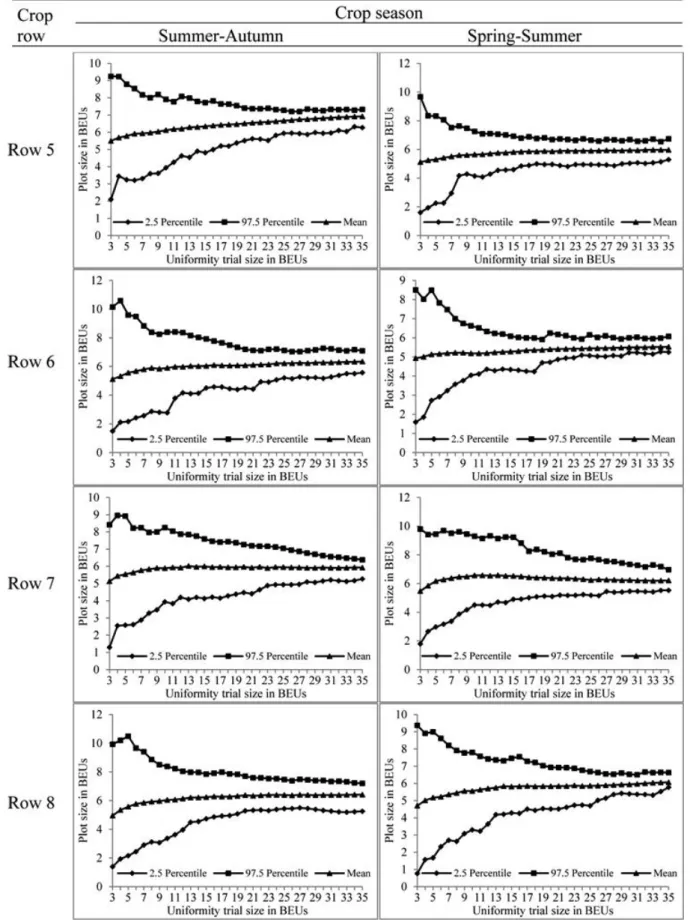
Independent of the crop (lettuce or sweet pepper), environment (tunnel or greenhouse), season or crop row, the mean estimate of the optimum plot size (Xo) showed a gradual increase with the increase in size of the uniformity
trial (Figures 1, 2, 3 and 4). This same behaviour was seen
in the fresh weight of the wild radish by Cargnelutti Filhoet
al.(2011a). The result suggests that estimates of optimum
plot size carried out with uniformity trial having few BEUs in the crop row underestimate the optimum plot size, which in turn increases experimental error and may consequently reduce the reliability of the results
of future experiments (STORCKet al., 2011).
With the increase in size of the uniformity trial, it was found for both crops, that for all seasons and crop rows there was a reduction in the amplitude of the 95% confidence interval (CI 95%) for optimum plot size (Xo) (Figures 1, 2, 3 and 4). Taking as an example the first row in the experiment with sweet pepper for the summer-autumn (Figure 3), the amplitude of CI 95% for Xo in the 3,000 resamples of the uniformity trial at a size of three BEUs was 6.6 BEUs, while for the trial at a size of 35 BEUs, it was 0.4. It can therefore be inferred that estimates for Xo made from trials with few BEUs in the crop row have high variability and
therefore low reliability. Cargnelutti Filhoet al.(2011a)
also concluded that small uniformity trial when evaluating fresh weight in the wild radish give estimates for optimum plot size of broad variability and low reliability.
The results show that the uniformity trial size when evaluating fresh weight in lettuce and fruit weight in sweet peppers, measured in BEUs in the crop row, influences the optimum plot size and the reliability of the estimate; a condition also seen by Cargnelutti Filho
et al. (2011a) in the wild radish. On the other hand,
Storck, Bisognin e Oliveira (2006) concluded that the uniformity trial size in the potato does not affect
estimates of optimum plot size. Cargnelutti Filhoet al.
(2011a) inferred that this result could be attributed to the smallest planned size for the uniformity trial being high (288 BEUs) and at a level which was greater than the required minimum, resulting in unnecessary cost and effort when conducting the uniformity trial, and thus highlighting the importance of determining a size for the trial in BEUs which would give the researcher the desired accuracy for estimating the optimum plot size (Xo).
Both the mean and amplitude for CI 95% of the optimum plot size (Xo), as a function of the size of the uniformity trial, varied between the lettuce and sweet pepper crops, between crop rows in the same experiment, between seasons for the same row and crop, and between growing environments for the same crop, row and time of year (Figures 1, 2, 3 and 4).
Figure 2 - Graphical representation of 2.5 percentile, mean and 97.5 percentile statistics for the 3,000 estimates of optimum plot size (Xo) for fresh phytomass of lettuce grown in plastic tunnels, in basic experimental units (BEUs), for different sizes of the uniformity trial in BEUs
of the uniformity trial and the plot size in vegetables grown in restrict areas considering each crop row as a
blank trial, as recommended by Lorentz et al. (2005)
and Lúcioet al. (2006) in the sweet pepper, Lúcioet al.
(2011) in the lettuce, Santoset al. (2012) in the green
bean, and Lúcioet al.(2012) in the tomato, in view of
the heterogeneity observed between crop rows due to the border effect, which acts differently for plants at the sides when compared to those in the centre of plastic tunnels
and greenhouses (LORENTZet al., 2005).
Each researcher will be able to choose a determined number of BEUs in their uniformity trial, taking into account the level of precision required in
estimating the optimum plot size (Xo) seen in Figures 1, 2, 3 and 4. Here is not the place to judge the maximum acceptable amplitude of CI 95% for estimating the optimum plot size from uniformity trial, this being left to the criteria of any researcher who takes advantage of this information in planning their experiments.
estimate the optimum plot size with an amplitude for CI 95% of less than or equal to two BEUs (Figures 1 and 2 ). Estimates with this level of precision would seem suitable for planning experiments in restrict environments, and uniformity trial having these dimensions are therefore sufficient to get a good estimate of optimum plot size. In practice, the use of uniformity trial of 60 BEUs in plastic tunnels and of 48 BEUs in a plastic greenhouse to estimate the optimum plot size in lettuce can be
found in the literature (LÚCIOet al., 2011), confirming
the importance and the practical validity of the results obtained in this work.
For sweet pepper, regardless of the crop row, in order to obtain an estimate for the optimum plot size with an amplitude for CI 95% for a Xo of less than or equal to two BEUs, uniformity trial with 26 BEUs are needed in the summer-autumn season and with 29 BEUs in the spring-summer season (Figures 3 and 4). In practice, it can be found in the literature that uniformity trial of 70 BEUs are used to estimate the optimum plot size for sweet pepper
in plastic tunnels (LORENTZ et al., 2005; LORENTZ;
LÚCIO, 2009; LÚCIOet al., 2004, 2006).
CONCLUSION
Uniformity trial using 27 basic experimental units to evaluate the fresh phytomass in lettuce plants and 29 basic experimental units to assess fruit weight in the sweet pepper are enough to estimate the optimum plot size for an amplitude of the 95% confidence interval of less than or equal to two basic experimental units.
ACKNOWLEDGEMENT
The authors wish to thank CNPq and FAPERGS for their financial support and the grant of scholarships for productivity in research.
REFERENCES
CARGNELUTTI FILHO, A.et al. Tamanho ótimo de parcela em milho com comparação de dois métodos.Ciência Rural, v. 41, n. 11, p. 1890-1898, 2011 b.
CARGNELUTTI FILHO, A.et al. Tamanhos de parcela e de ensaio de uniformidade em nabo forrageiro.Ciência Rural, v. 41, n. 9, p. 1517-1525, 2011 a.
CARPES, R. H. et al. Ausência de frutos colhidos e suas interferências na variabilidade da fitomassa de frutos de abobrinha italiana cultivada em diferentes sistemas de irrigação.Revista Ceres, v. 55, n. 6, p. 590-595, 2008.
INSTITUTO BRASILEIRO DE GEOGRAFIA E ESTATÍSTICA. Censo Agropecuário 2006. Disponível em:< http://www.sid ra.ibge .gov.br/b da/tabe la/listabl. asp?c=818&z=p&o=2&i=P>. Acesso em: 21 jan. 2014. LESSMAN, K. J.; ATKINS, R. E. Comparisons of planning arrangements and estimates of optimum hill plot for grain sorghum yield tests.Crop Science, v. 3, n. 6, p. 489-492, 1963.
LORENTZ, L. H.et al. Variabilidade da produção de frutos de pimentão em estufa plástica.Ciência Rural, v. 35, n. 2,
p. 316-323, 2005.
LORENTZ, L. H.; LÚCIO, A. D. Tamanho e forma de parcela para pimentão em estufa plástica.Ciência Rural, v. 39, n. 8,
p. 2380-2387, 2009.
LÚCIO, A. D. et al. Agrupamento de colheitas de tomate e estimativas do tamanho de parcela em cultivo protegido.
Horticultura Brasileira, v.28, p. 190-196, 2010.
LÚCIO, A. D.et al. Estimativa de parâmetros para o planejamento de experimentos com a cultura do pimentão em área restrita.
Horticultura Brasileira, v. 22, n. 4, p. 766-770, 2004.
LÚCIO, A. D. et al. Estimativa do tamanho de parcela para experimentos com alface.Horticultura Brasileira, v. 29, n. 4,
p. 510-515, 2011.
LÚCIO, A. D. et al. Tamanhos de amostra e de parcela para variáveis de crescimento e produtivas de tomateiro.
Horticultura Brasileira, v. 30, n. 4, p. 660-668, 2012. LÚCIO, A. D. et al. Variação temporal da produção de pimentão influenciada pela posição e características morfológicas das plantas em ambiente protegido.Horticultura Brasileira, v. 24, n. 1, p. 31-35, 2006.
LÚCIO, A. D. et al. Variância e média da massa de frutos de abobrinha-italiana em múltiplas colheitas. Horticultura Brasileira, v. 26, n. 3, p. 335-341, 2008.
MEIER, V. D.; LESSMAN, K. J. Estimation of optimum field plot shape and size testing yield inCrambe abyssinica Hordnt.Crop Science, v. 11, n. 5, p. 648-650, 1971.
MORENO, J. A.Clima no Rio Grande do Sul. Porto Alegre:
Secretaria da Agricultura, 1961. 41 p.
PARANAIBA, P. F.; FERREIRA, D. F.; MORAIS, A. R. de. Tamanho ótimo de parcelas experimentais: proposição de métodos de estimação.Revista Brasileira de Biometria, v. 27, n. 2, p. 255-268, 2009.
PARANAIBA, P. F.; MORAIS, A. R. de.; FERREIRA, D. F. Tamanho ótimo de parcelas experimentais: comparação de métodos em experimentos de trigo e mandioca. Revista Brasileira de Biometria, v. 27, n. 1, p. 81-90, 2009.
R DEVELOPMENT CORE TEAM. R: a language and environment for statistical computing. Vienna, 2014. Disponível
SOCIEDADE BRASILEIRA DE CIÊNCIA DO SOLO. Núcleo Regional Sul. Manual de adubação e de calagem para os estados do Rio Grande do Sul e de Santa Catarina. Porto Alegre: Comissão de Química e Fertilidade do Solo, 2004. 394 p. STORCK, L.et al.Experimentação vegetal. Santa Maria, RS:
Ed. UFSM, 2011. 200 p.
STRECK, E. V. et al. Solos do Rio Grande do Sul. 2. ed. Porto Alegre: Emater, 2008. 222 p.
STORCK, L.; BISOGNIN, D. A.; OLIVEIRA, S. J. R. de. Dimensões dos ensaios e estimativas do tamanho ótimo de parcela em batata.Pesquisa Agropecuária Brasileira, v. 41,