ESTIMATION OF OPTIMUM PLOT SIZES
IN FIELD EXPERIMENTS WITH ANNATTO
(1)ANSELMO ELOY SILVEIRA VIANA(2); ABEL REBOUÇAS SÃO JOSÉ(2);
SYLVANA NAOMI MATSUMOTO(2); SÁLVIO GUSMÃO SALES-JÚNIOR(3,4)
RESUMO
ESTIMATIVA DE TAMANHO ÓTIMO DE PARCELAS EM EXPERIMENTOS COM URUCUM
Objetivou-se estimar o tamanho ótimo de parcelas para experimentos com urucum. O ensaio de uniformidade foi formado de 12 fileiras com 12 plantas em cada fileira. Utilizou-se a variedade Bico de Pato, em espaçamento 5 x 4 m, avaliada aos cinco anos. Empregaram-se os métodos da máxima curvatura, da máxima curvatura modificado e da comparação de variâncias. A estimativa do tamanho de parcela variou com o método utilizado e com a característica analisada. Pelo méto-do da máxima curvatura modificaméto-do, que permitiu a obtenção de estimativas mais precisas, e con-siderando-se que a parcela ideal deve possibilitar a avaliação eficiente de todas as características analisadas neste experimento, encontrou-se o tamanho adequado de parcela, 107,2 m2 (cinco plantas).
Palavras-chave: Bixa orellana L.,coeficiente de variação, variância, método da máxima curvatura, experimentação.
ABSTRACT
The objective of this study was to estimate the optimum plots size for experiments with annatto. The uniformity assay consisted of 12 rows with 12 plants in each row. The variety Bico de Pato was used, planted in 5 x 4 m spacing and evaluated at 5 years of age. Three methods were used: maximum curvature, modified maximum curvature and the comparison of variances. The plot size estimate varied according to the methodology used and the characteristic analyzed. The adequate plot size was found to be 107.2 m2 (5 plants) using the modified maximum curvature method, which resulted
in more precise estimates , taking into consideration that the ideal plot should facilitate the efficient evaluation of all characteristics analyzed in this experiment.
Key words: Bixa orellana L., coefficient of variation, variance, maximum curvature method, experimentation.
(1
) Parte da dissertação de mestrado em Agricultura Tropical e Subtropical, área Gestão de Recursos Agroambientais, do primeiro autor, apresentada ao Instituto Agronômico (IAC), Campinas (SP). Recebido para publicação em 29 de outubro de 2001 e aceito em 3 de maio de 2002.
(2
) Centro Avançado de Pesquisa Tecnológica do Agronegócio de Frutas,IAC, Caixa Postal 11, 13200-970 Jundiaí (SP). (3) Com bolsa de produtividade científica do CNPq.
METODOLOGIA E TÉCNICAS EXPERIMENTAIS
1. INTRODUCTION
The annatto (Bixa orellana L.) is bushy plant belonging to the Bixaceae family, which is found in the forest ecosystem of the Brazilian humid tropics, and is now cropped in the tropics throughout the world (MELLO and LIMA, 1990). Its dye is not toxic
and does not alter the flavor of the foods and also has several applications mainly in the food, cosmetic and pharmaceutical industries (RAMALHO et al., 1992).
The annatto plant is sexually propagated, which leads to great variability in relation to the matrix-plant (LIMA, 1990). The yield inequality among
annatto plants can be larger in areas with low rainfall and low fertility soils, since under these conditions the annatto plants suffer greater stress. This inequalityamong plants makes experimental studies more difficult.
experimental accuracy and allow a more efficient comparison of the appraised treatments. According to LIN and BINNS (1984), when the amplitude of the
difference found is small, or when the experimental error is great, the optimum number of replicates can be very high for the available resources, so the plot size has to be modified. Several times, researchers have adopted forms and optimum sizes for plots based on empirical knowledge (OLIVEIRA and
ESTEFANEL, 1995).
The plot size directly affects the accuracy and the value of the obtained experimental data. Besides statistical accuracy, several other aspects are important to determine the optimum plot size: crop type, the number of treatments, the level of technology applied to cropping, area availability and financial resources (BUENO and GOMES, 1983). Small
plots increase the number of replicates in a given area, but large plots have a lower variance besides being statistically more desirable (DURNER, 1989).
According to ROSSETI and GOMES (1983), the soil
heterogeneity coefficient is the main element in estimating the optimum plot size the main element. Larger plots are necessary in heterogeneous experimental areas while homogeneous areas allow the use of smaller sized plots (STORCK and
UITDEWILLIGEN, 1980). LE CLERG (1967) further mentions
the genetic variability of the experimental material as an important factor in determining plot size.
The variation magnitude that the plot size may assume is great. Under some conditions, very small plots may be used; however, it is true that most of the time this should be avoided. In other situations, large plots are required, and in these cases a larger number of replicates can solve the problem (CORDEIRO
and MIRANDA, 1983).
In Brazil, research studies on annatto have been made in very diverse environments. Many times, the heterogeneity of local conditions has led to high experimental error, which hinders the statistical confirmation for differences among the appraised treatments.
The objective of the present study was to estimate the optimum plot sizes for experiments with annatto.
2. MATERIAL AND METHODS
The uniformity assay was conducted on the “Frutelli” Farm, Porto Seguro county, located in southern Bahia, Brazil, at 100 m average altitude. The maximum and minimum temperature means are 28
oC and 20 oC respectively. The annual average
precipitation is 1,200 mm, and the highest level was
recorded from November to March. The Bico de Pato variety was used, which is characterized as vigorous, indehiscent, with bixin percentage of 2.5%, productive and with concentrated flowering, and is planted mainly in Bahia State (OLIVEIRA, 1994).
An area inside annatto commercial cropping of 2,880 m2, and formed by 12 rows with 12 plants in
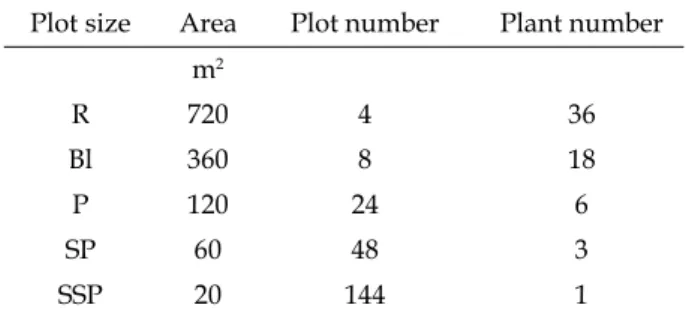
each row, was selected for evaluations. The plantation was set up with 5 m spacing between rows and 4m among plants. The plants were 5 years old at the time of evaluation. The harvest was accomplished separately at each plant denominated basic unit (bu), from which the combinations formed the different analyzed plot sizes, that is: replicates (R), blocks (Bl), plots (P), subplots (SP), subsubplots(SSP) (Table 1). The grain yield, stem diameter and the bixin percentage were evaluated. The statistical analysis was performed according to the criterion of hierarchical classification, simulating a split plot design (VALLEJO and MENDOZA, 1992). The variances
for each plot size were reduced in relation to a subsubplot, in a hierarchical order (HATHEWAY and
WILLIAMS, 1958).
The methods used for determining the plot optimum size were: the maximum curvature method
(FEDERER, 1955), the modified maximum curvature
method (MEIER and LESSMAN, 1971) and the
comparison of variances method (VALLEJO and
MENDONZA, 1992).
One of the first methods to be used to determine the optimum plot size in field experiments for several crops was the maximum curvature method. By this method, a uniformity experiment, or a determined area, is harvested in basic units, which are combined to form experimental plots of various sizes. When the coefficients of variation have been obtained, for each plot size, they are represented graphically against the size of each plot assessed. The optimum plot size is determined visually corresponding to the point of maximum curvature (FEDERER, 1955).
Plot size Area Plot number Plant number m2
R 720 4 36
Bl 360 8 18
P 120 24 6
SP 60 48 3
SSP 20 144 1
The modified maximum curvature method (MEIER and LESSMAN, 1971) was developed to increase
the precision of the maximum curvature method, representing the relation between the coefficient of variation and the plot size, with the use of a regression equation of the y=a/xb type, where y represents the coefficient of variation and x the corresponding plot size in basic units.
In this paper, the CV=aXb function was used, where the abscissa value, at the point of maximum curvature, is given by the following formula (CHAVES,
1985 deduced from MEIER and LESSMAN (1971):
where:
XMC: value of the abscissa corresponding to the point of maximum curvature; a: regression constant; b: regression coefficient.
In the method of comparison of variances
(VALLEJO and MENDONZA, 1992; ORTIZ, 1995) initially
the variances are reduced to a basic unit, dividing the variance from each plot by the number of corresponding basic units. Consecutive Bartlett tests were then applied for homogeneity of variances (STEEL and TORRIE, 1980) excluding in each test the
smallest plot size that presented statistically different variance. When a group of homogeneous variances was obtained, the smallest plot size was chosen within this group as being the optimum plot size.
3. RESULTS AND DISCUSSION
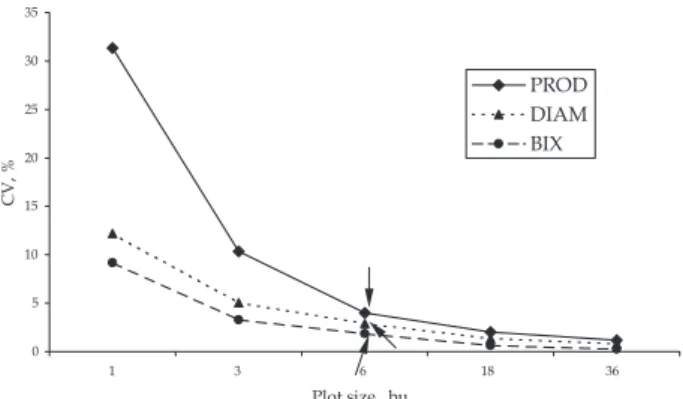
Table 2 shows that the coefficients of variation for the evaluated characteristics ranged from 0.27% to 31.35%, and the highest values were for grain yield and the lowest ones for bixin percentage. These values behaved similarly for all the characteristics, and it was also observed that as the plot size increased, the coefficient of variation decreased.
The estimates of the plot size obtained by the maximum curvature method for the grain yield, stem diameter and bixinpercentage characteristics were performed on six basic units, thus corresponding to six plants or an area of 120 m2 (Figure 1). In this
method, after the points are plotted into graphs, a curve is traced free hand and the point of maximum curvature is visually determined (FEDERER, 1955). In
this study, the procedure suggested by ORTIZ (1995)
was adopted by connecting the points with straight-line segments. The basic unit corresponding to the maximum curvature was determined as a better plot size.
Plant number Coefficients of variation (%)
PROD DIAM BIX
36 1,18 0,82 0,27
18 2,01 1,33 0,65
6 4,01 2,92 1,86
3 10,33 5,05 3,28
1 31,35 12,19 9,18
Table 2. Coefficients of variation for grain yield (PROD), stem diameter (DIAM) and bixin percentage (BIX) characteristics. Porto Seguro (BA), 1999
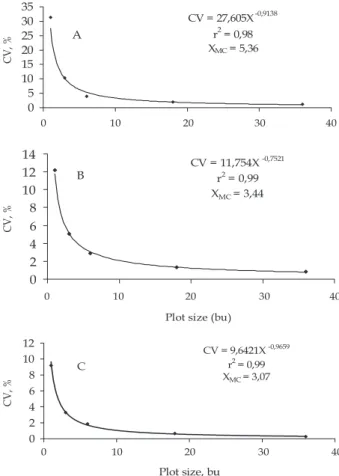
The optimum plot size for grain yield determination was 100 m2 (5 plants) by the maximum
curvature method. This method estimated plots of the same size, 60 m2 (three plants) for bixin percentage
and stem diameter (Figure 2). These estimates were more accurate, since this method uses the regression equation to explain the existent relationship between the plot size and the coefficient of variation, thus enabling the determination of the maximum-curvature point using an algebraic formula, which also allows detection of intermediary values among the plot sizes originally established in the experiment.
The comparison of variances method (Table 3) estimated the optimum plot size of six basic units, corresponding to six plants or an area of 120 m2, for
the grain yield and bixinpercentage characteristics. The optimum plot size for stem diameter was found to be equal to three basic units (three plants or an area of 60 m2).
The estimates of the plot sizes for experiments with annatto found in this study varied according to the methodology used and the characteristics evaluated.
However, it can be considered that the modified maximum curvature method, because it is more accurate than the maximum curvature method and permits estimation of the intermediary values of the plot size, which does not occur with the comparison of variances method, should be more appropriate. So, and also considering that grain yield is frequently the most important characteristic , it is suggested that plots with 5 useful plants or 100 m 2 (Table 4) are
adopted for experiments with annatto.
MMC MMCM MCV
Characteristics Plant number Area Plant number Area Plant number Area
m2 m2 m2
Grain yield 6 120 6 100 6 120
Stem diameter 6 120 3 60 3 60
Bixinpercentage 6 120 3 60 6 120
Table 4. Number of plants and optimum plot size found by the maximum curvature (MMC), modified maximum curvature (MMCM) and variances comparison (MCV) methods for the grain yield, stem diameter and bixin percentage characteristics. Porto Seguro (BA), 1999
Figure 2. Relationship between the coefficient of variation (CV) and plot size for grain yield (A), stem diameter (B) and bixin percentage (C). Porto Seguro (BA), 1999.
In the same column, the values followed by same letter do not differ at 5% probability, by the Bartlett test.
Table 3. Estimates of the variances reduced to a basic unit, and for the grain yield (PROD), stem diameter (DIAM) and bixin percentage (BIX) characteristics. Porto Seguro (BA), 1999
Plant number PROD DIAM BIX
36 0,03289c 0,88986b 0,00161c 18 0,04767c 1,15451b 0,00515c 6 0,08762c 1,86553b 0,01258c 3 0,21076b 2,78240b 0,01946b 1 0,64642a 5,40770a 0,05097a
4. CONCLUSIONS
1. The coefficient of variation for the appraised characteristics was inversely proportional to plot size, ranging from 0.27% for bixinpercentage to 31.35% for grain yield
2. The plot size estimates varied with the methods used and with the characteristic analyzed.
3. The maximum curvature method and the comparison of variances method estimated plots of 120 m2 (6 plants) for the grain yield and bixin percentage
characteristics. These two methods presented different results for stem diameter assessment, with the maximum curvature method estimating plots with 120 m2 (6 plants) and the comparison of variances method
estimated plots with 60 m2 (3 plants).
4. The modified maximum curvature method estimated plots of 60 m2 (3 plants) for bixin
percentage assessment and stem diameter and of 100 m2 (5 plants) for grain yield assessment.
REFERENCES
BUENO, A.; GOMES, F.P. Estimativa do tamanho de parcela em experimento de mandioca. Revista Brasileira de Mandioca, Cruz das Almas, v.2, n.2, p.39-44, 1983. CORDEIRO, C.M.T.; MIRANDA, J.E.C. Tamanho de
parcela e eficiência experimental em batata doce usando a potência do teste F. Pesquisa Agropecuária Brasileira, Brasília, v.18, n.7, p.707-13, 1983.
DURNER, E.F. OPS: a computer program for estimating optimum plot size for field research. HortScience, Alexandria, v.24, n.6, p.1040, 1989.
FEDERER, W.T. Experimental design. New York: MacMillan, 1955. 544p.
HATHEWAY, E.H.; WILLIAMS, E.J. Efficient estimation of the relationship between plot size and the variability of crop yields. Biometrics, Arlington, v.14, p.207-222, 1958.
LE CLERG, E.L. Significance of experimental design in plant breeding. In: FREY, K. J. (Ed.). Plant breeding symposium.
Ames: Iowa State University, 1967. p.243-313.
LIMA, L.C.F. Opções incrementais na propagação assexual do urucueiro. In: SÃO JOSÉ, A.R.; REBOUÇAS; T.N.H. A cultura do urucum no Brasil. Vitória da Conquista: Universidade Estadual do Sudoeste da Bahia, 1990, p.39-45.
LIN, C.S.; BINNS, M.R. Working rules for determining the plot size and numbers of plots per block en field experiments. Journal of Agricultural Science,
Cambridge, v.103, p.11-15, 1984.
MEIER, V.D.; LESSMAN, K.J. Estimation of optimum field plot shape and size for testing yield in Crambe abyssinica Hochst. Crop Science, Madison, v.11, p.648-650, 1971.
MELLO, A.A.A.; LIMA, L.C.F. Situação da cultura do urucum no Brasil e perspectivas. In: SÃO JOSÉ, A.R.; REBOUÇAS, T.N.H. A cultura do urucum no Brasil. Vitória da Conquista: Universidade Estadual do Sudoeste da Bahia, 1990, p.88-90.
OLIVEIRA, P.H.; ESTEFANEL, V. Tamanho e forma ótimo da parcela para avaliação do rendimento em experimentos com batata. Ciência Rural, Santa Maria, v.25, n.2, p.205-208, 1995.
OLIVEIRA, V.P. Melhoramento genético do urucuzeiro: uma visão do setor produtivo. Revista Brasileira de Corantes Naturais, Viçosa, v.2, n.2, p.1-6, 1994. ORTIZ, R. Plot techniques for assessment of bunch
weight in banana trials under two systems of crop management. Agronomy Journal, Madison, v.87, p.63-69, 1995.
RAMALHO, R.S.; PINHEIRO, A.L.; DINIZ, G.S. Informações básicas sobre a cultura e utilização do urucum (Bixa orellana L.). Revista Brasileira de Corantes Naturais, Viçosa, v.1, n.1, p.31-35, 1992.
ROSSETTI, A.G.; GOMES, F.P. Determinação do tamanho ótimo de parcelas em ensaios agrícolas.
Pesquisa Agropecuária Brasileira, Brasília, v.18, n.5, p.477-487, 1983.
STEEL, R.G.D.; TORRIE, J.H. Principles and procedures of statistics. 2.ed. New York: McGraw-Hill ,1980. 633p. STORCK, L.; UITDEWILLIGEN, W.P.M. Estimativa para tamanho e forma de parcela e número de repetições para experimentos com milho (Zea mays L). Agronomia Sulriograndense, Porto Alegre, p.269-282, 1980. VALLEJO, R.L.; MENDOZA, H.A. Plot technique studies