Artificial neural networks compared with Bayesian generalized linear
regression for leaf rust resistance prediction in Arabica coffee
Gabi Nunes Silva(1), Moysés Nascimento(1), Isabela de Castro Sant’Anna(2), Cosme Damião Cruz(2), Eveline Teixeira Caixeta(3), Pedro Crescêncio Souza Carneiro(2), Renato Domiciano Silva Rosado(2),
Kátia Nogueira Pestana(4), Dênia Pires de Almeida(5) and Marciane da Silva Oliveira(2)
(1)Universidade Federal de Viçosa (UFV), Departamento de Estatística, Avenida Peter Henry Rolfs, s/no, CEP 36570-900 Viçosa, MG, Brazil. E-mail: [email protected], [email protected] (2)UFV, Departamento de Biologia Geral, Avenida Peter Henry Rolfs, s/no, CEP 36570-900 Viçosa, MG, Brazil. E-mail: [email protected], [email protected], [email protected], [email protected], [email protected] (3)Embrapa Café, Parque Estação Biológica (PqEB), Avenida W3 Norte (Final), CEP 70770-901 Brasília, DF, Brazil. E-mail: [email protected] (4)Embrapa Mandioca e Fruticultura, Rua Embrapa, s/no, Caixa Postal 007, CEP 44380-000 Cruz das Almas, BA, Brazil. E-mail: [email protected] (5)UFV, Instituto de Biotecnologia Aplicada à Agropecuária, BioCafé, Avenida Peter Henry Rolfs, s/no, CEP 36570-900 Viçosa, MG, Brazil. E-mail: [email protected]
Abstract – The objective of this work was to evaluate the use of artificial neural networks in comparison with Bayesian generalized linear regression to predict leaf rust resistance in Arabica coffee (Coffea arabica). This study used 245 individuals of a F2 population derived from the self-fertilization of the F1 H511-1 hybrid, resulting
from a crossing between the susceptible cultivar Catuaí Amarelo IAC 64 (UFV 2148-57) and the resistant parent Híbrido de Timor (UFV 443-03). The 245 individuals were genotyped with 137 markers. Artificial neural networks and Bayesian generalized linear regression analyses were performed. The artificial neural networks were able to identify four important markers belonging to linkage groups that have been recently mapped, while the Bayesian generalized model identified only two markers belonging to these groups. Lower prediction error rates (1.60%) were observed for predicting leaf rust resistance in Arabica coffee when artificial neural networks were used instead of Bayesian generalized linear regression (2.4%). The results showed that artificial neural networks are a promising approach for predicting leaf rust resistance in Arabica coffee. Index terms: Coffea arabica, Hemileia vastatrix, artificial intelligence, molecular markers, prediction.
Redes neurais artificiais comparadas com modelos lineares generalizados sob
o enfoque bayesiano para predição de resistência à ferrugem em café arábica
Resumo – O objetivo deste trabalho foi avaliar o uso de redes neurais artificiais em comparação à modelagem por meio de modelos lineares generalizados na predição de resistência à ferrugem em café arábica (Coffea arabica). Foram utilizados 245 indivíduos provenientes de uma população F2, oriundos da autofecundação
do híbrido F1 H511-1, resultante do cruzamento da cultivar suscetível Catuaí Amarelo IAC 64 (UFV
2148-57) e do genitor resistente Híbrido de Timor (UFV 443-03). Os 245 indivíduos foram genotipados com 137 marcadores. Realizaram-se análises com redes neurais artificiais e com modelos lineares generalizados sob o enfoque bayesiano. As redes neurais identificaram quatro marcadores importantes pertencentes a grupos de ligação que foram recentemente mapeados, enquanto o modelo generalizado bayesiano identificou somente dois marcadores pertencentes a esses grupos. Foram observadas taxas de erro de predição inferiores (1,60%) para predizer a resistência à ferrugem em café arábica, quando foram utilizadas as redes neurais artificiais em vez de modelos lineares generalizados sob o enfoque bayesiano (2,4%). Os resultados mostraram que as redes neurais artificiais são uma abordagem promissora para predizer a resistência à ferrugem em café arábica. Termos para indexação: Coffea arabica, Hemileia vastatrix, inteligência artificial, marcadores moleculares, predição.
Introduction
Coffee is a culture that belongs to the Coffea genus of the Rubiaceae family. It is one of the main Brazilian crops, placing Brazil as the largest coffee producer and exporter in the world, and as the second largest coffee consumer. Among the cultivated species,
Coffea arabica L. stands out for presenting great
which affects all coffee producing regions worldwide
(Várzea et al., 2002). One way to minimize the damage
caused by this disease is to use resistant varieties, obtained in breeding programs (Alvarenga et al., 2011). In this context, plant genome sequencing and
identification of molecular markers associated with
resistance have been used to assist breeding programs (Morceli et al., 2008; Alvarenga et al., 2011).
Among the statistical methods based on molecular markers, genome wide selection (GWS) is a technique that has been widely used for selecting materials with higher performance based on information from molecular markers. Such methodology, proposed by Meuwissen et al. (2001), allows incorporating molecular information directly in the prediction of the individuals’ genetic merit. In general, the methodologies developed for genomic selection, such
as Ridge Regression Best Linear Unbiased Prediction (RR-BLUP), Bayes A and B (Meuwissen et al., 2001) and Bayesian Lasso (Campos et al., 2009), are based
on the normality assumption of the studied phenotype. Thus, using them in categorical variables, such as leaf rust resistance, becomes inadequate.
In order to avoid this limitation, Pérez & Campos
(2014) proposed the use of Bayesian generalized linear
regression (BGLR), extending the genomic selection
to continuous (e.g., yield) and discrete (e.g., disease
resistance) models (Pérez & Campos, 2014). However,
even including other types of models, the methodology requires that these models are previously established by the researcher, i.e., the problem’s modeling is essential
to the use of this technique. Also, another deficiency
of the techniques commonly used in GWS is that they do not extend to problems involving dominance and epistatic effects (Resende, 2007).
As an alternative to the use of conventional stochastic
modeling, artificial neural networks can be used for prediction and classification, with the advantage of not
having assumptions regarding the model that should be adopted, since their results depend on the learning process rather than on the distribution of variables. Such approach has been successfully applied to solve several problems related to genetics (Nascimento et al., 2013; Silva et al., 2014, 2016; Sant’Anna et al., 2015).
The objective of this work was to evaluate the
use of artificial neural networks in comparison with
Bayesian generalized linear regression to predict leaf rust resistance in Arabica coffee (Coffea arabica).
Material and Methods
Phenotyping and genotyping experiments were carried out in a greenhouse and in a coffee
biotechnology laboratory, the Laboratório de Biotecnologia do Cafeeiro (BioCafé), of the Instituto de Biotecnologia Aplicada à Agropecuária (Bioagro), an
institute of biotechnology applied to agriculture, of the
Universidade Federal de Viçosa (UFV) (20°45'37"S, 42°52'4" W) as described by Pestana et al. (2015).
Phenotyping was conducted in May 2009, July 2009 and August 2009 for the repetitions 1, 2 and 3 respectively. Genotyping was carried out in the years 2010, 2011 and 2012. The study used 245 individuals in a F2 population derived from the self-fertilization
of the F1 H511-1 hybrid, resulting from a crossing
between the susceptible cultivar Catuaí Amarelo IAC 64 (UFV 2148-57) and the resistant parent Híbrido de Timor (UFV 443-03). DNA extraction of F2 population
individuals was carried out according to the protocol described by Diniz et al. (2005). Genotyping was
carried out with 137 markers (74 AFLP, 58 SSR, 4 RAPD, and 1 specific primer) (Pestana et al., 2015).
Markers data for each individual were scored for genomic selection analysis. For approaching dominant markers (allele from the resistant parent Híbrido de Timor UFV443-03), -1 was assigned for presence, and 1 for absence of the band. For repulsion dominant markers (allele from the susceptible parent Catuaí Amarelo, UFV 2148-57), 1 and -1 were assigned for presence and absence of the band, respectively. The codominant markers were scored as 0 for heterozygote; -1, for bands from the resistant parent; and 1, for bands from the susceptible parent.
In the phenotyping regarding the expression of genotype resistance or susceptibility, inoculations were carried out, and uredospores of H. vastatrix race II were multiplied and inoculated according to the methodology described by Capucho et al. (2009).
Inoculation – for the 245 individuals of a F2 – was
carried out using leaf discs, as described by Eskes
(1982), using 20 µL of spore suspension with viability over 30% at a concentration of 2.0 mg µL-1, with three
a gearbox disinfected, followed by methodology described by Capucho et al. (2009).
The assessment of resistance/susceptibility was carried out according to Capucho et al. (2009), following the scale of Tamayo et al. (1995), which is based on the absence or presence of uredospores. According to this scale, scores 1-3 are considered resistant (1 - absence of symptoms; 2 - small chlorotic lesions; and 3 - large chlorotic lesions without sporulation). Susceptibility (scores 4 to 6) is assigned to large chlorotic lesions, with few uredospores, occupying less than 25% of the leaf area (score 4); to lesions with sporulation, occupying 25 to 50% of the leaf area (score 5); and to lesions with sporulation, occupying more than 50% of the leaf area, and with uredospores (score 6). To predict the resistance pattern to leaf rust using two methodologies
(BGLR and ANN), scores were rescored as resistant
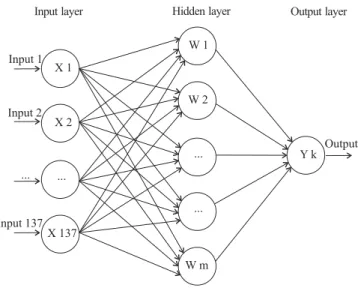
(1 = scores 1 to 3) and susceptible (0 = scores 4 to 6). The architecture of the ANN used was the single hidden layer back-propagation (Rumelhart et al., 1986) with six neurons, 137 inputs (represented by the marker values) and one output layer, which provided the prediction of leaf rust resistance. The architecture was represented by a functional form, as the topology described in Figure 1.
The Wm variables were functions of pondered sums
of the 137 input variables Xi (represented by the marker
values), and the output variable, Yk (leaf resistance
scores), that is, Wm m mX m
T
=γ α( 0 +α ), =1 2, , ..., , 6 which
was modeled as functions of these combinations.
T = + W,k = 1,2, ,K; Y =f X =g T ,k = 1,2, ,K;
k 0k k T
k k k
β β …
( )
( )
…in which W = (W1, W2, …, Wm) and T = (T1, T2, …, Tk).
The activation function γ(υ) and the output function
gk(T) were, respectively, the sigmoid, (υ) = 1/(1+e-υ),
and the softmax, g Tk e T
T
l l k
k
( )=
∑
=1 (Hastie et al.,2009).
The estimate of the weights {α0m, αm; m = 1, 2,
…, M} and {β0k, βk; k = 1, 2, …, K} was carried
out by minimization of the sum of square errors,
R i yik f xk i
N
k K
( )θ =
[
− ( ) ,]
= =
∑
∑
21 1
by the application of the descending gradient algorithm. Since the hidden layers were used, the adjustment procedure known as back-propagation was applied.
For the network training (obtainment of weights), the set of observations was divided in two parts: training and validation, as commonly adopted in the
literature (Silva et al., 2014, 2016; Sant’Anna et al.,
2015). The first, denoted by training set, consisted
of 160 individuals taken at random. The second, composed of the remaining 85 observations, was used for network validation. The number of individuals
for training and validating the network was defined
following the percentages (around 65% of the data information to train the network) usually adopted by the other authors (Braga et al., 2011; Nascimento et al., 2013). The arguments required for the function of the network, such as number of neurons in the hidden layer, weight initial value, and decay rate were chosen considering the network that provided error value of 15%, at most, for the validation set.
For comparison, prediction was also carried out using the genomic selection method based on generalized linear models under the Bayesian approach (Campos
& Perez Rodriguez, 2014). Regression model under the
Bayesian approach is given by: yi = ηi + εi, where ηi is a
linear predictor, and εi are independent normal model
residuals.
Rewriting ηi: ηi =1µ +X1β1 + … + Xjβj +u1 + … + uq,
in which µ is an intercept; Xj are the matrices for
predictors, Xp = {xijk}; βj are the vectors of effects
associated to the columns of Xj; uq = {uq1, …, uqn} are
the vectors of random effects.
Figure 1. Schematic of a single hidden layer back-propagation. Inputs x1 to x137 in the input layer are related to
the 137 markers information and are considered as inputs. One hidden layer consisting of Wm nodes (i = 1, 2, …, 6). Artificial neural network returns the predicted breeding value in the output layer, in the figure represented by vector Yk.
Output ayerl
Input 1
Input 2
...
Input 137 ... X 1
X 2
X 137
W 1
W 2
...
...
W m
For categorical variables, as leaf rust resistance,
the vector response adopted in BGLR is the probit link (Perez & Campos, 2014), where the probability
of each of the categories is linked to the linear predictor according to the link function below: P(yi = k) = Φ(ηi – yk) – Φ(ηi – yk-1), where Φ(.) is the
standard normal cumulative distribution function, ηi is
the linear predictor, and yk are threshold parameters
(y0 = -∞, yk ≥ yk-1 and yk = ∞).
The prior density was the same adopted in the
Bayesian Lasso, which assumes that the marginal
distribution of marker effects is double exponential
(Perez & Campos, 2014).
To estimate the model in BGLR, the study used the
same 65% of individuals used in ANN training. For validation, the study used the same 35% of individuals used to validate the neural network.
After obtaining the results, the percentage of
prediction errors was calculated for the artificial
neural networks and the Bayesian generalized linear regression was studied in training populations
(estimate) and in validation. Coincidence coefficients
between predictions were calculated regarding leaf rust resistance by both approaches. Manhattan plots were constructed in order to observe if the behavior and distribution of the most important markers for neural networks and Bayesian approach were similar.
In order to verify the possibility of using marker assisted selection for predicting leaf rust resistance,
two situations were taken into account. At first, the
study considered the three most important markers, for which three prediction scenarios were assessed: the use of the most important marker; the use of the two most important markers; and the use of the three most important markers.
In the second assessed situation, among the ten most important markers, the study selected the two markers that belong to the linkage groups in which Pestana et
al. (2015) detected two important QTLs for leaf rust
resistance in C. arabica.
The models used were carried out by using nnet
(to fit a neural network) function and BGLR (to fit a
generalized Bayesian model)functions of the packages
nnet (Venables & Ripley, 2002) and BGLR (Campos et al., 2009; Pérez et al., 2010), respectively. Both were
developed in the R software (R Core Team, 2016). A total of 100,000 iterations were used in this study, with 20,000 burn-in and thin iterations assuming
the value 10, following authors as Macpherson et al.
(2004) and Kwon & Reis (2015).
Results and Discussion
After the training algorithm was executed, the topology with prediction error rate of less than 15% was considered. For this topology, the number of neurons was six, decay rate was 5.0x10⁻⁴, and maximum number
of iterations was equal to 5,000. The initial values for the network weights were randomly chosen from the interval [-0.5, 0.5] and assuming max = 2. According
to Venables & Ripley (2002), the initial values of the
process should be chosen in order to satisfy the equation
LS × max(|x|) ≈ 1, where LS denotes the upper limit of the range and max(|x|) is the largest absolute value of
the set of training data.
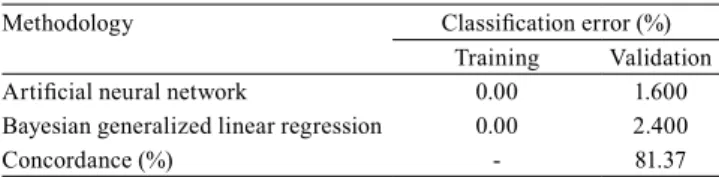
Neural networks provided slightly lower error rates
than BGLR in the validation population. Specifically,
error rates were equal to 2.40% and 1.60% in the validation population, considering the predictions
carried out by BGLR and ANN, respectively (Table 1).
In order to select resistant varieties, genomic selection methodologies, especially Bayesian generalized linear
regression, once that BGLR extend the genomic
selection to discrete variables as resistance, have been proposed to predict the breeding values by analyzing their phenotypes and high-density marker information
(Heffner et al., 2009; Pérez & Campos, 2014). However,
when carrying out prediction studies of genetic values from phenotypic values with aggregation of molecular information, some statistical and genetic aspects should be considered.
In the statistical context, appropriate models must be adopted upon the possibility of occurrence of serious problems of multicollinearity and dimensionality of the incidence matrix (Ferrari, 1989). Multicollinearity is conditioned by the existence of correlations between markers and can result in inconsistent
Table 1. Prediction error rates obtained with artificial neural
network and Bayesian generalized linear regression (BGLR) in training and validation populations, and percentage of agreement between the two methodologies.
Methodology Classification error (%)
Training Validation
Artificial neural network 0.00 1.600
Bayesian generalized linear regression 0.00 2.400
estimates of the regression coefficient and also in an
overestimation of the direct effects of the explanatory variables on the dependent variable, which may lead to misinterpretation, and dimensionality issue occurs when the number of available observations is lower than the number of explanatory variables (or markers)
included in the model (Cruz & Carneiro, 2003;
Resende, 2007).
The existence of multicollinearity and the dimensionality issue are limiting factors for the Bayesian models, since the once that data set used
in this methodology needs to be defined and known
priorly, satisfying the presupposition of being in the exponential family (Resende, 2007; Garcia et al., 2012). In comparison to this, the ANN is not affect by those issues because it does not involve stochastic modeling, since it is nonparametric and the theory behind them is quite different from the linear model
BGLR described above, based on computational
intelligence and principles of learning (Heslot et al., 2012; Silva et al., 2014).
Apparently, both BGLR and ANN approaches
are able to circumvent such problems, since results regarding prediction were satisfactory. In this study, dimensionality is not a limiting factor in view of the number of observations and studied markers. In the genetic context, it should be taken into account that
BGLR approach uses a linear model in which the
predicted value – being function only of favorable allele dose – predicts the additive genetic value with higher mean squared error, or lower genotypic reliability, expressed by the r2, of the model because
of the effects assigned to dominance and epistatic interactions disregarded in this model (Cruz, 2012). However, when a computational intelligence approach as ANN is used, such information and other important information that the breeder has about the genotype in study constitute a relevant input to be considered during the training processes for increasing the
efficiency of the selection process, and it becomes
possible to capture different relationships between markers and phenotypes (Bureau et al., 2005; Heslot et al., 2012; Silva et al., 2014, 2016).
The percentage of agreement between the results obtained by the two methodologies was 81.37%. Comparing the results obtained with the mapping that had recently been carried out by Pestana et al. (2015), neural networks were able to identify four markers (E-CGT/M-ATC1, E-CGT/M-TCT1,
E-CTT/M-TGC3, and E-CGA/M-ACA2) belonging
to the identified QTLs. BGLR could only identify two markers belonging to QTLs. It is believed that the
ANN approach, due to its different neurons in hidden layers, can capture linear and nonlinear relationships between the response variable and the values assigned to molecular markers (Braga et al., 2011). This means that they were capable of detecting the effects of dominance and epistasis that are neglected by other methodologies (Heslot et al., 2012; Silva et al., 2014, 2016).
Manhattan plot graphs showed the most important markers for both methodologies (Figure 2). Markers behavior pattern regarding its importance in the prediction process was different in the two
methodologies (ANN and BGLR) regarding leaf rust
resistance. This difference occurs since the markers
that were identified as the most important are different
in the two methodologies. Particularly for neural networks, it is noted that a relatively large number of markers had effects of great magnitude.
The 10 most important markers obtained for the Bayesian methodology were: M34, M36, M132, M101, M88, M62, M29, M85, M65 and M116; and the 10 most important markers obtained for the neural networks were: M6, M19, M35, M44, M56, M80, M59, M64, M67 and M84. These results justify the difference between the graphs.
In order to simulate a selection strategy similar to that used in marker assisted selection (MAS) – in which only a small group of markers, supposedly in
linkage disequilibrium with QTL, could be effective in prediction –, classification error rates were obtained
for ANN, by evaluating three situations (Table 2). Error rates were relatively high, and ranged between 44.90% and 53.47%, evidencing the importance of using all the information available for predicting leaf rust resistance in coffee, i.e., the need for more parameterized predictive models.
The high prediction error rates obtained in Table 2 when using markers selection show that the joint action of several markers is more appropriate for prediction of resistance or susceptibility to H. vastatrix. The complexity of the genetic control of H. vastatrix has
been reported by several authors (Bettencourt &
Carvalho, 1968; Capucho et al., 2009; Pestana et al., 2015). Studies on coffee demonstrated that Híbrido de
Timor derived accessions have five dominant genes
combination, the resistance spectra (Bettencourt et al., 1992), indicating both horizontal control, of polygenic nature, and vertical control, provided by few genes of major effect. In this study, the most relevant markers are those that present gametic phase disequilibrium with the probable genes that control the studied trait. This association, either by factorial linkage, or by a
non-random combination between marker and QTL
(quantitative trait loci), has been considered a crucial factor in obtaining gains with selection (Resende et al., 2008).
In general, important markers to be used in MAS
are identified through genomic analyses in populations
structured for genetic mapping with the aid of regression models, assuming the existence of markers
flanked to significant QTLs (Caixeta et al., 2009). In
this work, the use of computational intelligence as an
auxiliary tool for QTLs detection was proposed. For
assisted selection of this work, the ten most important markers for prediction were selected. Another reason for the high prediction error rates found in Table 2,
even for the markers identified in the linkage maps, is the fact that the QTLs identified by Pestana et al.
(2015) have low coefficients of determination (5.8% and 8.1%). This means that they are not sufficient to
confer leaf rust resistance in C. arabica alone.
Finally, it is noteworthy that the low polymorphism rate found in C. arabica populations (Geleta et al., 2012) was not a limiting factor for the use of neural networks in predicting leaf rust resistance, since it presented satisfactory results considering the prediction error rate. The proposed method has low prediction error rate and superior results when compared to those found by the Bayesian generalized model. The advantage of neural networks over other approaches has been proven in genetic studies. In relation to genotype x environment interaction, Nascimento et al. (2013) assessed the adaptability and phenotypic stability of
alfalfa genotypes based on formation of an artificial neural network, considering the method of Eberhart &
Russell (1966). Percentage agreements were of 89 and 100% for adaptability, and of 78 and 100% for stability, considering favorable and unfavorable environments, respectively. Silva et al. (2014, 2016) concluded that
ANNs are efficient in predicting values and genetic
gain in simulated trials under randomized block
design. Regarding the classification studies, Sant’Anna
et al. (2015) showed that neural networks had results superior to those obtained by discriminant analysis in
the classification of simulated populations.
Figure 2. Importance of markers for the prediction process: A, graph in which the x axis corresponds to the information of the markers, and the y axis represents the estimate of markers effect for the model obtained by Bayesian generalized linear regression; and B, graph in which the x axis represents the dispersion of markers; and the y axis represents the respective prediction errors when each marker is removed from the model obtained by artificial neural network.
Table 2. Prediction error rates (TEP) obtained in the two studied situations: situation I, marker assisted selection (MAS) using the best marker, the two most important markers or the three most important markers, and situation II, marker assisted selection (MAS) using the two most important markers identified by Pestana et al. (2015). In each case, all possible marker combinations were assessed: presence (1) or absence (-1).
Situation I Situation II
MAS (1 marker)
TEP MAS (2 markers)
TEP MAS (3 markers)
TEP MAS(1) TEP
-1 51.02 (1,1) 44.9 (1,1,1) 43.67 (1,1) 46.12 (-1) 48.98 (1,-1) 46.94 (1,1,-1) 47.35 (1,-1) 45.71 (-1,1) 52.24 (1,-1,1) 53.47 (-1,1) 53.88 - - (-1,-1) 48.16 (1,-1,-1) 44.9 (-1,-1) 46.53
- - - - (-1,1,1) 46.12
- - - - (-1,1,-1) 46.94
- - - - (-1,-1,1) 47.75
- - - - (-1,-1,-1) 46.53
Conclusions
1. Artificial neural network is more efficient to
predict leaf resistance in Coffea arabica than Bayesian generalized linear regression.
2. Artificial neural networks are an interesting and
promising approach to predict C. arabica leaf rust resistance.
Acknowledgments
To Coordenação de Aperfeiçoamento de Pessoal de Nível Superior (Capes), to Fundação de Pesquisa do
Estado de Minas Gerais (Fapemig), and to Conselho
Nacional de Desenvolvimento Científico e Tecnológico (CNPq), for financial support and scholarships.
References
ALVARENGA, S.M.; CAIXETA, E.T.; HUFNAGEL, B.; THIEBAUT, F.; MACIEL-ZAMBOLIM, E.; ZAMBOLIM, L.; SAKIYAMA, N.S. Marcadores moleculares derivados de sequências expressas do genoma café potencialmente envolvidas na resistência à ferrugem. Pesquisa Agropecuária Brasileira, v.46, p.890-898, 2011. DOI: 10.1590/S0100-204X2011000800015. BETTENCOURT, A.J.; CARVALHO, A. Melhoramento visando a resistência do cafeeiro à ferrugem. Bragantia, v.27, p.35-68, 1968. DOI: 10.1590/S0006-87051968000100004.
BETTENCOURT, A.J.; LOPES, J.; PALMA, S. Factores genéticos que condicionam a resistência às raças de Hemileia vastatrix
Berk. et Br. dos clones-tipo dos grupos 1, 2 e 3 de derivados de Híbrido de Timor. Broteria Genética, v.13, p.185-194, 1992. BRAGA, A. de P.; CARVALHO, A.P. de L. e de.; LUDERMIR, T.B. Redes neurais artificiais: teoria e aplicações. 2.ed. Rio de Janeiro: LTC, 2011.
BRASIL. Ministério da Agricultura, Pecuária e Abastecimento. Available at: <http://www.agricultura.gov.br/>. Accessed on: Aug. 22 2015.
BUREAU, A.; DUPUIS, J.; FALLS, K.; LUNETTA, K.L.; HAYWARD, B.; KEITH, T.P.; VAN EERDEWEGH, P. Identifying SNPs predictive of phenotype using random forests. Genetic Epidemiology, v.28, p.171-182, 2005. DOI: 10.1002/ gepi.20041.
CAIXETA, E.T.; OLIVEIRA, A.C.B. de; BRITO, G.G. de; SAKIYAMA, N.S. Tipos de marcadores moleculares. In: BORÉM, A.; CAIXETA, E.T. (Ed). Marcadores moleculares. 2.ed.Viçosa: Ed. da UFV, 2009. p.11-93.
CAMPOS, G. de los; NAYA, H.; GIANOLA, D.; CROSSA, J.; LEGARRA, A.; MANFREDI, E.; WEIGEL, K.; COTES, J.M. Predicting quantitative traits with regression models for dense molecular markers and pedigree. Genetics, v.182, p.375-385, 2009. DOI: 10.1534/genetics.109.101501.
CAMPOS, G. de los; PEREZ RODRIGUEZ, P. BGLR: Bayesian Generalized Linear Regression. 2014. Available at:
˂https://cran.r-project.org/web/packages/BGLR/index.html˃. Accessed on: Oct. 5 2016.
CAPUCHO, A.S.; CAIXETA, E.T.; ZAMBOLIM, E.M.; ZAMBOLIM, L. Herança da resistência do Híbrido de Timor UFV 443–03 à ferrugem-do-cafeeiro. Pesquisa Agropecuária Brasileira, v.44, p.276-282, 2009. DOI: 10.1590/S0100-204X2009000300009.
CRUZ, C.D. Princípios de genética quantitativa. Viçosa: Ed. da UFV, 2012. 394p.
CRUZ, C.D.; CARNEIRO, P.C.S. Modelos biométricos aplicados ao melhoramento genético. Viçosa: Ed. da UFV, 2003. 579p. DINIZ, L.E.C.; SAKIYAMA, N.S.; LASHERMES, P.; CAIXETA, E.T.; OLIVEIRA, A.C.B.; ZAMBOLIM, E.M.; LOUREIRO, M.E.; PEREIRA, A.A.; ZAMBOLIM, L. Analysis of AFLP markers associated to the Mex-1 resistance locus in Icatu progenies. Crop Breeding and Applied Biotechnology, v.5, p.387, 2005. DOI: 10.12702/1984-7033.v05n04a03.
EBERHART, S.A.; RUSSEL, W.A. Stability parameters for comparing varieties. Crop Science, v.6, p.36-40, 1966. DOI: 10.2135/cropsci1966.0011183X000600010011x.
ESKES, A.B. The use of leaf disk inoculations in assessing resistance to coffee leaf rust (Hemileia vastatrix). Netherlands Journal of Plant Pathology, v.88, p.127-141, 1982. DOI: 10.1007/ BF01977270.
FERRARI, F. Estimadores viesados para modelos de regressão em presença de multicolinearidade. 1989. 127p. Tese (Doutorado) – Escola Superior de Agricultura Luiz de Queiroz, Piracicaba.
GARCIA, D.A.; PEREIRA, I.G.; SILVA, F.F. e; PIRES, A.V.; PESSOA, M.C.; OLIVEIRA, R.A.M. Modelos lineares generalizados mistos na avaliação genética da prenhez precoce na raça Nelore. Arquivo Brasileiro de Medicina Veterinária e Zootecnia, v.64, p.675-682, 2012. DOI: 10.1590/S0102-09352012000300020.
GELETA, M.; HERRERA, I.; MONZÓN, A.; BRYNGELSSON, T. Genetic diversity of Arabica coffee (Coffea arabica L.) in
Nicaragua as estimated by simple sequence repeat markers. The
Scientific World Journal, v.2012, ID 939820, 11p., 2012. DOI: 10.1100/2012/939820.
HASTIE, T.; TIBSHIRANI, R.; FRIEDMAN, J. The elements of statistical learning: data mining, inference, and prediction. 2nd ed. New York: Springer, 2009. DOI: 10.1007/978-0-387-84858-7. HEFFNER, E.L.; SORRELLS, M.E.; JANNINK J.-L. Genomic selection for crop improvement. Crop Science, v.49, p.1-12, 2009. DOI: 10.2135/cropsci2008.08.0512.
HESLOT, N.; YANG, H.-P.; SORRELLS, M.E.; JANNINK, J.-C. Genomic selection in plant breeding: a comparison of models. Crop Science, v.52, p.146-160, 2012. DOI: 10.2135/ cropsci2011.06.0297.
MACPHERSON, J.M.; RAMACHANDRAN, S.; DIAMOND, L.; FELDMAN, M.W. Demographic estimates from Y chromosome microsatellite polymorphisms: analysis of a worldwide sample. Human Genomics, v.1, p.345-354, 2004. DOI: 10.1186/1479-7364-1-5-345.
MEUWISSEN, T.H.E.; HAYES, B.J.; GODDARD, M.E. Prediction of total genetic value using genome-wide dense marker maps. Genetics,v.157, p.1819-1829, 2001.
MORCELI, T.G.S.; TREVISOLI, S.H.U.; MORCELI JUNIOR, A.A.; KIIHL, R.A. de S.; CALVO, E.S.; DI MAURO, A.O.; GARCIA, A. Identificação e validação de marcadores microssatélites ligados ao gene Rpp5 de resistência à
ferrugem-asiática-da-soja. Pesquisa Agropecuária Brasileira, v.43, p.1525-1531, 2008. DOI: 10.1590/S0100-204X2008001100011. NASCIMENTO, M.; PETERNELLI, L.A.; CRUZ, C.D.; NASCIMENTO, A.C.C.; FERREIRA, R. de P.; BHERING, L.L.; SALGADO, C.C. Artificial neural networks for adaptability and stability evaluation in alfafa genotypes. Crop Breeding and Applied Biotechnology, v.13, p.152-156, 2013. DOI: 10.1590/ S1984-70332013000200008.
PÉREZ, P.; CAMPOS, G. de los. Genome-wide regression and prediction with the BGLR Statistical Package. Genetics, v.198, p.483-495, 2014. DOI: 10.1534/genetics.114.164442.
PÉREZ, P.; CAMPOS, G. de los; CROSSA, J.; GIANOLA, D. Genomic-enabled prediction based on molecular markers and pedigree using the Bayesian Linear Regression package in R. Plant Genome, v.3, p.106-116, 2010. DOI: 10.3835/ plantgenome2010.04.0005.
PESTANA, K.N.; CAPUCHO, A.S.; CAIXETA, E.T.; ALMEIDA, D.P. de; ZAMBOLIM, E.M.; CRUZ, C.D.; ZAMBOLIM, L.; PEREIRA, A.A.; OLIVEIRA, A.C.B. de; SAKIYAMA, N.S. Inheritance study and linkage mapping of resistance loci to
Hemileia vastatrix in Híbrido de Timor UFV 443-03. Tree
Genetics and Genomes, v.11, p.1-13, 2015. DOI: 10.1007/s11295-015-0903-9.
R CORE TEAM. R: A language and environment for statistical computing. Vienna: R Foundation for Statistical Computing, 2016. Available at: ˂https://www.R-project.org/˃. Accessed on: Dec. 5 2016.
RESENDE, M.D.V. de. Matemática e estatística na análise de experimentos e no melhoramento genético. Colombo: Embrapa Florestas, 2007. 561p.
RESENDE, M.D.V. de; LOPES, P.S.; SILVA, R.L. da; PIRES, I.E. Seleção genômica ampla (GWS) e maximização da eficiência do melhoramento genético. Pesquisa Florestal Brasileira, v.56, p.63-77, 2008.
RUMELHART, D.E.; HINTON, G.E.; WILLIAMS, R.J. Learning internal representations by error propagation. In: RUMELHART, D.E.; MCCLELLAND, J.L. (Ed.). Parallel distributed processing: explorations in the microstructure of cognition. Cambridge:MIT Press, 1986. v.1, p.318-362.
SANT’ANNA, I.C.; TOMAZ, R.S.; SILVA, G.N.; NASCIMENTO, M.; BHERING, L.L.; CRUZ, C.D. Superiority of artificial neural networks for a genetic classification procedure. Genetics and Molecular Research,v.14, p.9898-9906, 2015. DOI: 10.4238/2015. August.19.24.
SILVA, G.N.; TOMAZ, R.S.; SANT’ANNA, I. de C.; NASCIMENTO, M.; BHERING, L.L.; CRUZ, C.D. Neural networks for predicting breeding values and genetic gains. Scientia Agricola, v.71, p.494-498, 2014. DOI: 10.1590/0103-9016-2014-0057.
SILVA, G.N.; TOMAZ, R.S.; SANT’ANNA, I.C.; CARNEIRO, V.Q.; CRUZ, C.D.; NASCIMENTO, M. Evaluation of the efficiency of artificial neural networks for genetic value prediction. Genetic Molecular Research, v.15, p.1-11, 2016. DOI: 10.4238/ gmr.15017676.
SILVA, M. do C.; VÁRZEA, V.; GUERRA-GUIMARÃES, L.; AZINHEIRA, H.G.; FERNANDEZ, D.; PETITOT, A.-S.; BERTRAND, B.; LASHERMES, P.; NICOLE, M. Coffee resistance to the main diseases: leaf rust and coffee berry disease. Brazilian Journal of Plant Physiology, v.18, p.119-147, 2006. DOI: 10.1590/S1677-04202006000100010.
TAMAYO, P.J.; VALE, F.X.R.; ZAMBOLIM, L.; CHAVES, G.M.; PEREIRA, A.A. Catimor resistance to coffee leaf rust and virulence of physiological races of Hemileia vastatrix. Fitopatologia Brasileira, v.20, p.572-576, 1995.
VÁRZEA, V.M.P.; RODRIGUES JR, C.J.; SILVA, M. do C.M.L.; GOUVEIA, M.; MARQUES, D.V.; GUERRA-GUIMARÃES, L.; RIBEIRO, A. Resistência do cafeeiro a Hemileia vastatrix. In: ZAMBOLIM, L.(Ed.). O estado da arte de tecnologias na produção de café. Viçosa: Ed. da UFV, 2002. p.297-320.
VENABLES, W.N.; RIPLEY, B.D. Modern applied statistics with S. 4th ed. New York: Springer, 2002. (Statistics and Computing). DOI: 10.1007/978-0-387-21706-2.
Received on May 2, 2016 and accepted on December 21, 2016
ERRATA
In the paper “Artificial neural networks compared with Bayesian generalized linear regression for leaf rust
resistance prediction in Arabica coffee”, DOI: 10.1590/S0100-204X2017000300006, published in Pesquisa
Agropecuária Brasileira, v.52, n.3, p.186-193, 2017, on the page footer, where it reads:
“DOI: 10.1590/S0100-204X2017000300006”, it should read: