Differentiation of free-ranging chicken using discriminant analysis of
phenotypic traits
Raed M. Al-Atiyat1,2*, Riyadh S. Aljumaah1, Alaeldein M. Abudabos1, Masoud N. Alotybi1, Raafat M. Harron1, Abdulaziz S. Algawaan1, Hassan S. Aljooan1
1 King Saud University, Department of Animal Production, Riyadh, Riyadh Province, Saudi Arabia. 2 Mutah University, Department of Animal Production, Mutah, Jordan.
ABSTRACT - In this study, we investigated the differentiation of five different chicken ecotypes - Center, North, South, West, and East - of Saudi Arabia using discriminate analysis. The analysis was based on nine important morphological and phenotypic traits: body color, beak color, earlobe color, eye color, shank color, comb color, comb type, comb size, and feather distribution. There was a strong significant relationship between the phenotype and effect of geographic height in terms of comb type and earlobe color in males as well as body, beak, eye, and shank color. In particular, the comb type and earlobe color differentiated the ecotypes of males. Among the females, the beak, earlobe, eye, shank color, and feather distribution had more differentiating power. Moreover, the discriminant analysis revealed that the five ecotypes were grouped into three clusters; the Center and the North in one cluster, the West and the South ecotypes in the second for males, and the East ecotype in the last cluster. The female dendogram branching was similar to the male dendrogram branching, except that the Center ecotype was grouped with the North instead of the South. The East ecotype was highly discriminated from the other ecotypes. Nevertheless, the potential of recent individual migration between ecotypes was also noted. Accordingly, the results of the utilized traits in this study might be effective in characterization and conservation of the genetic resources of the Saudi chicken.
Key Words: biodiversity, genetic distance, genetic variation, indigenous, morphology © 2017 Sociedade Brasileira de Zootecnia
ISSN 1806-9290 www.sbz.org.br
R. Bras. Zootec., 46(10):791-799, 2017
Received: September 2, 2016
Accepted: April 18, 2017
*Corresponding author: [email protected] http://dx.doi.org/10.1590/S1806-92902017001000001
How to cite: Al-Atiyat, R. M.; Aljumaah, R. S.; Abudabos, A. M.; Alotybi, M. N.; Harron, R. M.; Algawaan, A. S. and Aljooan, H. S. 2017. Differentiation of free-ranging chicken using discriminant analysis of phenotypic traits. Revista Brasileira de Zootecnia 46(10):791-799.
Copyright © 2017 Sociedade Brasileira de Zootecnia. This is an Open Access article distributed under the terms of the Creative Commons Attribution License (http://creativecommons.org/licenses/by/4.0/), which permits unrestricted use, distribution, and reproduction in any medium, provided the original work is properly cited.
Introduction
Phenotypic traits describe the physical appearance of a livestock breed (FAO, 2003). In details, the physical traits are alienated by visual assessment in predefined population of the breed. Classification of the breed, ecotype, or population is generally performed on different bases. Basically, the breed is a homogenous group of livestock with definable, specific, and identifiable physical traits (FAO, 2000). The individuals within each of these classes are distinguished on the external traits of their body such as morphological and biometrical traits. Regarding this, indigenous or free-range chickens have variable plumage and morphological and biometrical traits representing genes of adaptation to
their own environment. Free-range chickens are classified as gene reservoir reflecting unique adaptation to their agro-ecological or tropical environments (Horst, 1989). In particular, those adaptive genes of free-range chickens can be visually seen and recognized. For instance, chickens in high-altitude regions have mainly yellow skin, whereas naked-neck chickens are generally found in low-altitude regions (Dana et al., 2010). The geographic features are indeed related to the common plumage of the indigenous chicken and, thus, the ecotype has been usually given for distinct geographical population, breed, strain, or race within a species that is adapted to specific environmental conditions (Begon et al., 2006).
792 Al-Atiyat et al.
R. Bras. Zootec., 46(10):791-799, 2017 different KSA free-range chicken ecotypes (Alsobayel and
Al-Mulhem, 2001). However, little information is available about differentiation and diversity of the KSA chicken. The KSA indigenous chicken ecotypes are raised in different ecology and, thus, the differentiation can easily be noted in different regions and elevations. The differentiation might be based on morphology, genetics, or both. The first step is to perform a characterization based on the phenotypic and morphological traits to achieve better conservation and utilization of their genetic resources. However, genetic characterization based on molecular assessment is extremely necessary and verified, but expensive (Wimmers et al., 2000). The first and most common method for the phenotypic characterization is the canonical discriminate and multivariate analyses (Riggs, 1973). The analyses are successfully employed in the evaluated ecotypes based on performance and phenotypic parameters of chickens (Rosario et al., 2008; Al-Atiyat, 2009; Yakubu et al., 2009). The present study aimed to differentiate the KSA free-range chicken ecotypes based on the phenotypic and morphological traits using the multivariate discriminant analysis.
Material and Methods
Free-range chickens were found in rural and urban areas of the five major regions of the KSA. The sampled indigenous chicken populations were classified into five ecotypes according to their geographical region as Center, North, South, East, and West (Table 1). Chickens of six months of age or older were randomly selected, weighted, and the plumage traits were recorded. The total sample size was 150 males and 350 females. In this research, handling animals was practiced with the permission of and in accordance with the guidelines of the local Ethics Committee (case no. AGR-2555) and the Saudi Arabia National Committee of Bio Ethics.
The plumage traits were recorded according to pictorial guidance for phenotypic characterization of chickens (FAO, 2008). The recorded phenotypic traits were body color, comb color, comb type, comb size, beak color, earlobe color, eye color, shank color, and feather distribution (Table 1). The GPS data and elevation of each sampling location were also recorded.
All statistical analyses were performed by the SAS program (Statistical Analysis System, version 9.2). The PROC CORR procedure was used to test the relationship between the investigated traits as well as the geographical features; the DISCRIM (simple discriminant analysis) procedure was performed to calculate assigning probability
of an individual chicken into defined population. In addition, the STEPDISC (Stepwise discriminant) procedure was also used to determine traits of better discriminating power. Another procedure, CANDISC (canonical-discriminant analysis of uni- and multivariate analysis) was applied to produce canonical variables (CAN). The CAN were considered for matching each breed with other breed into one genetic group, which shows cluster of most closely related population or ecotype. The Mahalanobis distances, widely used in cluster analysis and classification technique, were calculated out of the covariance matrix (Rao, 1973). Consequently, the SAS TREE procedure was used to construct a dendrogram utilizing the statistical method of unweighted pair’s group analysis. Finally, the PROC CLUSTER procedure was also performed utilizing data of distances to form the clusters. Furthermore, MEGA software was utilized to build a dendrogram tree (Tamura, 2011).
Results
The nine plumage variables showed a wide range of variability (Table 1). The body color had a wide range from black to white. Similarly, the color of the other investigated traits varied, but with limited range.
79
ntia
tio
n o
f fr
ee
-ra
ng
in
g c
hic
ke
n u
sin
g d
isc
rim
in
an
t a
na
lys
is o
f p
he
no
typ
ic t
ra
its
R
. B
ra
s.
Zo
ote
c.,
4
6(1
0):
79
1-7
99
, 2
01
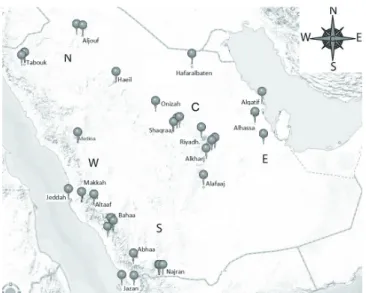
Chicken ecotype Sampling location
Center (N: 2444 E: 4633 ) Onizah, Alafaaj, Alamarih, Alkharj, Shaqraa, Riyadh
North (N: 2828 E: 3634 ) Aljouf, Haeil, Tabouk
West (N: 2114 E: 4029 ) Almadinah, Altaaf, Jeddah, Makkah
East (N: 2631 E: 4959) Alhassa, Alqateef, Hafaralbaten
South (N: 2000 E: 4127) Abhaa, Bahaa, Jazan, Najran
Height Sea level (<50 m) Valle (>50-<150 m) Flat (>150-<500) Plateau (>500-<1500 m) Mountain >1500 m
Body color Black Black/brown Black/gray Black/beige Black/red Black/white Black/yellow Black/others
Brown Brown/black Brown/gray Brown/beige Brown/red Brown/yellow Brown/white Brown/others
Red Red/black Red/ brown Red/beige Red/white Red/yellow
Gray Gray/brown Gray/yellow Gray Beige Beige/black Beige/yellow
Yellow Yellow/black Yellow/brown White White/black White/beige White/yellow Others
Comb type Single Single slope Single crest Single slope cornish
Double Double crust Double vertical Double flat Double vertical crest
Pea Rose Strawberry V-shape Cornish Single-double
Comb color Black Dark red Red Pink
Comb size Small Medium Large
Beak color Black Black/yellow Black/white Brown Brown/white Brown/yellow White Yellow
Earlobe Red White Red-white Black Blue Brown Black
Eye color Brown Orange Red Pearl
Shank color Black Black-green Gray Green White Yellow White/green Yellow/black
Wattle color Black Dark red Red Pink Normal
794 Al-Atiyat et al.
R. Bras. Zootec., 46(10):791-799, 2017 color showed positive correlation with eye color and
negative correlation with feather distribution (Table 2). It is clear that beak and comb plumage were most correlated with other traits in females of KSA chicken.
The analysis for the plumage traits in males showed that the comb type, eye color, earlobe color, comb size, and body color significantly separated the ecotypes (Table 3). In females, plumage variables that significantly discriminated between pairwise ecotype comparisons were comb type, comb, shank, eye, and beak color, and feather distribution. The comb type and eye color only shared variables in discriminating male and female ecotypes.
The discriminant analysis showed that the East geographical ecotype of male chickens were highly differentiated (P<0.0001) from the others according to the Mahalanobis distances (Table 4). The North male ecotype was also significantly differentiated from the South ecotype with the lowest distance value. In addition, the constructed dendrogram (Figure 1) out of the matrix shows three separated clusters at different branching level. The first
was formed by both Center and South ecotypes and the second formed by the first cluster along with both West and North ecotypes. The last cluster had East ecotype alone. On the other side, the Mahalanobis distances of the female ecotypes were significantly differentiated (P<0.001). The longest distance was between the East female ecotype and the West female ecotype, whereas the smallest distance was between the Center and North ecotypes. In addition, long distance was noted between the North ecotypes and each of East and South ecotypes, refelecting the long geographical distance between them (Table 4). The dendogram (Figure 2) shows a cluster of both the Center and the North in one group. This group was sub-clustered with West and South ecotypes. The East ecotype was far separated from the others in a third cluster. The female dendogram branching was similar to the males’ except that the Center ecotype was grouped with the North instead of the south. The West ecotypes of males and females were close to the North and South ecotypes indicating an intermediate position.
Region Elevation colorBody Comb color Comb type Comb size Beak color Earlobe color colorEye Shank color distributionFeather
Region 0.06 0.50*** 0.056 0.015 −0.19* −0.112 0.025 −0.20* 0.070 0.067 0.099
Elevation 0.36*** 0.06 0.143 −0.041 −0.21** 0.052 −0.108 −0.132 −0.049 0.085 0.051
Body color 0.11* −0.001 −0.15*** −0.079 −0.010 −0.089 0.24** −0.085 −0.035 0.130 0.150
Comb color 0.077 −0.011 0.085 0.01* −0.112 0.017 0.19* −0.125 0.059 0.059 0.008
Comb type −0.22*** −0.14* −0.042 −0.12* 0.15*** −0.085 0.052 0.091 0.124 −0.057 0.077
Comb size −0.020 −0.026 −0.053 0.087 0.17** 0.69*** −0.22** 0.012 −0.089 −0.053 −0.070
Beak color 0.18** 0.031 0.27*** 0.28*** −0.15** −0.20*** 0.054 0.005 0.18* 0.32*** 0.122
Earlobe color −0.11* −0.011 −0.015 −0.13* 0.12* −0.010 −0.12* 0.01* −0.099 −0.077 −0.016
Eye color −0.013 −0.12* 0.088 0.2*** −0.024 −0.11* 0.31* −0.106 −0.12* 0.102 0.080
Shank color 0.19** 0.18** 0.19** 0.24*** −0.104 −0.095 0.57*** −0.049 0.18** −0.11*** 0.004 Feather distribution −0.11* −0.18** 0.076 −0.14** 0.44** 0.19*** −0.18** 0.092 0.056 −0.13* 0.13*** Table 2 - Correlation coefficients of male (above diagonal) and female (below diagonal) and sex (on the diagonal) between the chicken
ecotypes and the significant values
* P<0.05. ** P<0.01. *** P<0.001.
Entered Partial R-square F-value Pr > F Wilks’ Lambda Pr < Lambda Average squared canonical correlation Pr > ASCC
Male
Comb type 0.16 6.89 <.0001 0.84 <.0001 0.04 <.0001
Eye color 0.15 6.33 0.00 0.72 <.0001 0.08 <.0001
Earlobe color 0.08 3.21 0.01 0.66 <.0001 0.10 <.0001
Comb size 0.08 2.99 0.02 0.61 <.0001 0.11 <.0001
Body color 0.08 3.14 0.02 0.56 <.0001 0.13 <.0001
Female
Comb type 0.22 21.96 <.0001 0.78 <.0001 0.05 <.0001
Shank color 0.12 11.06 <.0001 0.68 <.0001 0.08 <.0001
Eye color 0.08 7.14 <.0001 0.63 <.0001 0.10 <.0001
Beak color 0.07 6.12 <.0001 0.58 <.0001 0.12 <.0001
Feather distribution 0.05 4.11 0.00 0.55 <.0001 0.13 <.0001
Comb color 0.04 3.22 0.01 0.53 <.0001 0.14 <.0001
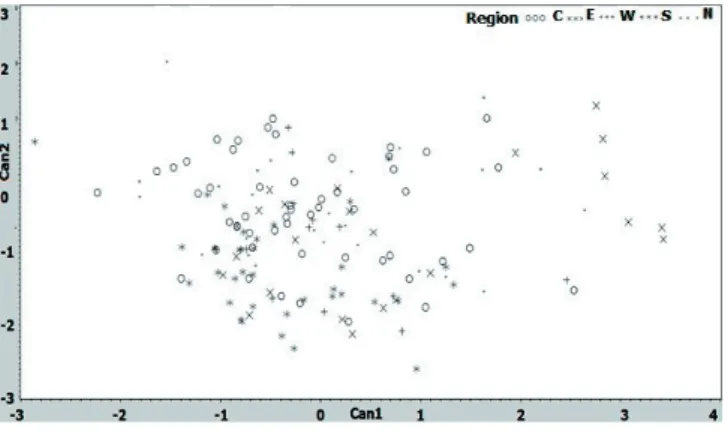
From the CAN variables, only Can1 exhibited the major variations in both sexes. The results obtained from canonical discriminant analysis showed significant coefficients for Can1 and Can2 for male plumage and for Can1, Can2, and Can3 for female plumage (Table 5). The plotted results showed that Can1, in males, had high discriminant value as shown by Can1 axis, which showed higher division and differentiation values between populations than Can2 axis. The results indicated that the Can1 weighted for the comb type and eye color and, thus, they allowed for a clear distinction among male KSA ecotypes (Table 4). For more details, Can1 for comb type accounted for 71% of total variation in males, which was very high, whereas Can2 accounted for 28% of the variation (Table 5). The CAN values showed high correlated values among combinations of the plumage traits of KSA chicken ecotypes. Furthermore, there was a wide differentiation
between the male ecotypes (Figure 3) because of the comb type (Tables 1 and 3). Furthermore, Can1 and Can2 variance values accounted for 71% and 70% of the total variation coefficient for comb type and eye color, respectively (Table 5). Similar observations with different coefficient values were observed in females. The standardized mean value of male body, comb, and eye color and comb type were higher than that of the females, while the mean values of comb size, earlobe color, beak color, and feather distribution of females were higher than those of the males (Table 5). These canonical variables were successful in discriminating both sexes of the ecotypes (Figure 4). Individuals of the ecotypes distributed in intermixed way indicated limited separatiion into clusters rather than scattered all over (Figures 3 and 4). These results encouraged us to look at how individuals of
Ecotype Center North West East South
Center 1.50NS 1.37 NS 1.85*** 0.81 NS
North 0.84*** 2.04 NS 3.26*** 2.65*
West 1.43*** 1.67*** 2.83** 2.39 NS
East 1.12*** 2.61*** 2.86*** 3.06***
South 0.91** 2.24*** 1.75*** 1.90***
Table 4 - Mahalanobis distance between male (above diagonal) and female (below diagonal) chicken ecotypes and the significant values1
1 Prob > Mahalanobis distance for squared distance to ecotype. NS - not significant.
* P<0.05. ** P<0.01. *** P<0.001.
Figure 1 - Map of Kingdom of Saudi Arabia showing the geographical location of the sampled chicken populations.
Figure 2 - Dendrogram showing relationship among male Saudi Indigenous chicken ecotypes.
Figure 3 - Dendrogram showing relationship among female Saudi Indigenous chicken ecotypes.
Variable Male Female
Can1 Can2 Can1 Can2 Can3
Body color −0.19 0.63 −0.25 −0.04 0.18
Comb color 0.19 −0.22 −0.11 −0.27 0.44
Comb type 0.71 0.28 0.37 −0.79 0.26
Comb size 0.21 0.55 0.33 0.67 0.22
Beak color 0.09 −0.32 0.25 −0.21 −0.46
Earlobe color 0.29 0.37 0.31 0.43 0.44
Eye color 0.70 −0.27 0.07 −0.10 0.75
Shank color −0.40 −0.03 −0.43 0.36 0.09
Feather distribution −0.15 0.01 0.57 0.13 −0.47 Table 5 - Total-sample standardised canonical coefficients and
796 Al-Atiyat et al.
R. Bras. Zootec., 46(10):791-799, 2017 both sexes of ecotypes were related based on individual
principle component analysis. Males showed that they were grouped into clusters from close geographical regions (Figure 4). More obvious results were noticed for the female individuals, indicating that the individuals from same region were grouped, representing their ecotypes (Figure 5). However, some individuals of both sexes did not reflect this relationship; they were clustered with ecotypes belonging to distant regions. For example, the first cluster of male plumage (Figure 4) grouped two sample locations from the Center with one ecotype of the North, two from the South, and one from the East. Similarly, principle component analysis of females showed a clustering of different ecotypes (Figure 5). Individuals of different ecotypes were plotted with other ecotypes, providing evidences of intermixing (Figures 4 and 5).
Discussion
The free-range chickens in the world have been assigned with low production ability and experienced natural selection. However, they have shown great
variation in phenotypic and plumage traits as a result of selection and geographical isolation (Abdelqader et al., 2007; Daikwo et al., 2011; Al-Qamashoui et al., 2014). It is common that the free-range chickens of different geographical regions are distinct on the basis of plumage or morphological features (Crawford, 1990). These KSA chickens are well adapted to the local climatic conditions, feed, and management stresses, with better resistance to diseases of the tropics mainly as a result of frequent heat stress and drought. A general assumption is that the indigenous chickens of the KSA are derived from some old breeds, like Pakistani, Malay, and Egyptian breeds, or their crossbreeds. Considering their domestication and dispersal from literature, they were developed in different parts of the world from different breeds and formed the present chicken phenotype appearance. The phenotypic variation of the KSA chicken ecotypes within the region was due to the geographical separation along with long natural selection. The former was expressed by the correlation of its geographical elevation of mountain, hill, flat, and sea level, with some plumage traits in males and females. The traits were comb type in males and eye and shank color and feather distribution, and comb type in females. In agreement, the similar plumage variables have been reported in correlation with geographical features (Dana et al., 2010; Aklilu et al., 2014; Adekoya et al., 2013). As a consequence, the present study considered the studied KSA populations of the five regions as ecotypes instead of populations or breeds. The canonical discriminant analysis explained the total covariation among plumage traits of the chicken populations. In particular, the multiple correspondence analyses showed that the variation was accounted by the CAN1 and CAN2. The results of the canonical discriminant analysis was in accordance with previous similar studies in chicken populations worldwide (Pires et al., 2002; Barbosa et al., 2005; Carneiro et al., 2002) and, thus, the Canonical discriminant analysis was proven successfully in identifying variation of phenotypic traits between ecotypes.
Those phenotypic traits were the traits that separated and differentiated the ecotypes. In particular, the comb plumage traits and eye color were the traits that differentiated the male ecotypes. In addition, beak, earlobe, eye, and shank color, as well as feather distribution were traits that mostly differentiated females. The resulted differentiation between ecotypes was expected because of different selection forces practiced in favor of specific phenotypic or plumage traits. For instance, duplex comb type was commonly found in hills and flat areas. In particular, they are found in a population in oasis called Al-Hassah in East region Figure 4 - Canonical representation of the male chicken ecotypes.
of KSA. The most dominant ecotype in the East region is called Hassawi chicken, characterized by black body color (Abudabos et al., 2017).
The Mahalanobis distances between populations show a reasonable differentiation for males. The large distances were observed for East population with other populations of both males and females. This demonstrates that the plumage of the populations presented similar plumage with a significant probability (P<0.0001) to discriminate them away from East ecotype.
In addition, East population showed the highest differentiation as noted by multivariate means of both sexes. On the other hand, female chicken ecotypes had a shorter genetic distance in comparison with those of male ecotype. These long distances among male ecotypes reflected their own long geographical distance. The large power of discriminate variables confirmed the influence of the comb type and eye, earlobe, and body color as differentiating elements in males (Table 3). The large distance established a hypothesis that KSA free-range chicken populations might be related to the same origin or they show the same ancestry (Figure 3). Nevertheless, the potential of recent individual migration between ecotypes is highly possible. However, the stepwise discriminant analysis (Table 3) confirmed that differentiation of the ecotypes was related to the color of many plumage traits. The resolution of such traits was not enough to differentiate ecotypes or populations with what was assumed earlier that the populations of the regions are distinct ecotypes. They were rather originated from the same origin population. Again, East ecotype was significantly differentiated based on those plumage traits and, thus, they might be considered as good discriminator traits. The results proved that both ecotypes of the North and Center had a high degree of similarity because they had similar plumage (Table 5). The plausible explanation was earlier detailed by similar description of the geographic distribution of indigenous chickens and their production system characteristics in the North and the Center regions (Al-Yousef, 2007). The author noted that they are unique in their phenotypes, including their disease resistance, and are well adapted to local environments. They are, however, excluded from the national commercial production schemes because of their apparent low production levels compared with commercial broilers and layers.
In the current study, it is a fact that the number of traits facilitated the differentiation of the chicken ecotypes because each original trait was weighted in relation to its contribution within the canonical variable. In particular, it is noteworthy that comb type was the most efficient discriminating variable within the male ecotypes. The same
trait was very important to discriminate female populations along with traits such as eye and shank color and feather distribution. They had good differentiation power in morphological studies intended for easy and efficient characterization. On the other hand, body, comb, and beak color showed bad differentiation power in the current work. Most of these traits have been previously related to chicken ability to tolerate heat stress, feed scarcity, and persistent diseases in the region (Alsobayel and Al-Mulhem, 2001).
Considering the obtained dendrograms (Figures 2 and 3), a similar degree of relationship among populations was noted. Two major clusters, one formed by the Center and either South population in males and the North in the female ecotype, may assign it to production or tolerable merit. The indigenous ecotypes in the first cluster are specially selected for adaptation to dry conditions under scavenging system, whereas East population might be more tolerant to humid conditions of the tropics. Similarly, free-range chicken of the tropical hot environment have better heat tolerance, which is related to big comb, wattle, and legs (Aklilu et al., 2014; Nesheim et al., 1979). In addition, Adekoya et al. (2014) reported the superiority of single comb type and normal feather distribution in the construction dendrogram of Nigerian chickens.
798 Al-Atiyat et al.
R. Bras. Zootec., 46(10):791-799, 2017 account not only the genetic aspect, but also the ecological,
morphological, and productive aspects. Indeed, the application of molecular DNA-based differentiation study will be more useful and accurate when applied along.
Conclusions
The ecotypes have distinct differentiation reflecting the existence of high genetic variability. The relationship between the geographical features and phenotypic traits show that the region and height are correlated with comb type and earlobe color in male chicken, whereas, in females, they are correlated with body, eye, beak, and shank color and comb type, earlobe color, and feather distribution. In particular, the most discriminate traits are comb type and eye color in males and comb type and shank color in females. In addition, recent individual migration between ecotypes is noted. Finally, canonical discriminant analysis is capable to assess genetic differentiation of Saudi free-range chicken ecotypes, bearing in mind that in current days, there is always a need to detect the variability at the molecular level, using recently developed and used DNA markers, such as SNP chips for further insights on selection signatures and differentiations.
Acknowledgments
This project was funded by the National Plan for Science, Technology and Innovation (MAARIFAH), King Abdulaziz City for Science and Tecnology, Kingdom of Saudi Arabia (12-AGR2555-02).
References
Abdelqader, A.; Wollny, C. B. and Gauly, M. 2007. Characterization of local chicken production systems and their potential under different levels of management practices in Jordan. Tropical Animal Health Production 39:155-164.
Abudabos, A. M.; Aljumaah, R. S.; Algawaan, A. S.; Al-Sornokh, H. and Al-Atiyat, R. M. 2017. Effects of hen age and egg weight class on the hatchability of free range indigenous chicken eggs. Brazilian Journal of Poultry Science 19:33-40.
Adekoya, K. O.; Oboh, B. O.; Adefenwa, M. A. and Ogunkanmi, L. A. 2013. Morphological Characterization of Five Nigerian Indigenous Chicken Types. Journal of Scientific Research and Development 14:55-66.
Aklilu, E.; Gebreyesus, G.; Kebede, K. and Dessie T. 2014. Quantitative morphological traits as a measure of genetic diversity for two indigenous chicken ecotypes in Ethiopia. p.17-22. In: Proceedings of the 10th World Congress of Genetics Applied to Livestock Production, Vancouver, Canada.
Al-Atiyat, R. 2009. Diversity of chicken populations in Jordan using discriminant analysis of performance traits. International Journal of Agriculture and Biology 11:374-380.
Al-Qamashoui, B.; Simianer, H.; Kadim, I. and Weigend, S. 2014. Assessment of genetic diversity and conservation priority of Omani local chickens using microsatellite markers. Tropical Animal Health Production 10:444-447.
Alsobayel, A. A. and Al-Mulhem, A. A. 2001. Comparison early and late feathering genetic groups of baladi chickens for some egg quality characterstics. Journal of King Saud University - Science 13:1-13.
Al-Yousef, Y. M. 2007. A Survey Study on the distribution of Saudi baladi chickens and their characteristics. International Journal of Poultry Science 6:289-292.
Barbosa, L.; Regazzi, A. J.; Lopes, P. S.; Breda, F. C.; Sarmento, J. L. R.; Torres, R. A. and Torres Filho, R. A. 2005. Evaluation of genetic divergence among lines of laying hens using cluster analysis. Brazilian Journal of Poultry Science 7:79-83.
Begon, M.; Townsend, C. and Harper, J. 2006. Ecology: From individuals to ecosystems. 4th ed. Blackwell Publishing, New Jersey. p.5-8.
Carneiro, P. L. S.; Fonseca, R.; Pires, A. V.; Torres Filho, R. A.; Torres, R. A.; Peixoto, J. O.; Lopes, P. S. and Euclydes, R. F. 2002. Estudo da divergência genética entre linhagens de matrizes de frangos de corte por meio de análise multivariada. Arquivo Brasileiro de Medicina Veterinária e Zootecnia 54:75-83.
Crawford, R. D. 1990. Origin and history of poultry species. Poultry genetic resources: evolution, diversity, and conservation. p.1-59. In: Poultry breeding and genetics. Crawford, R. D., ed. Elsevier Science Publishers, Amsterdam.
Daikwo, I.; Okpe, A. and Ocheja, J. 2011. Phenotypic characterization of local chicken in Dekina. International Journal of Poultry Science 10:444-447.
Dana, N.; Dessie, T.; van der Waaij, L. H. and van Arendonk, J. A. M. 2010. Morphological features of indigenous chicken populations of Ethiopia, Animal Genetic Resources 46:11-23.
FAO - Food and Agriculture Organization. 2000. World watch list for domestic animal diversity. 3rd ed. Scherf, B. D., ed. Rome. FAO - Food and Agriculture Organization. 2003. Defining livestock
breeds in the context of community-based management of farm animal genetic resources. by Rege, E. O. in Community-based management of farm animal genetic resources. Proceedings of the workshop held in Mbabane, Swaziland, 7-11 May 2001, Rome.
FAO - Food and Agriculture Organization. 2008. Pictorial guidance for phenotypic characterization of chickens and ducks. In: Manuel Luque Cuesta, Rome, Italy.
Horst, P. 1989. Native fowl as reservoir for genomes and major genes with direct and indirect effects on the adaptability and their potential for tropically oriented breeding plans. Archives Animal Breeding 53:93-101.
MOA - Ministry of Agriculture-Kingdom of Saudi Arabia. 2013. Annual statistical book. Available at: <http://www.moa.gov.sa/cs/ allContent/files/stat27>. Accessed on: Mar. 16, 2016.
Nesheim, C. M.; Austic, E. R. and Card E. L. 1979. Poultry production. 12th ed. Lea and Febiger, Philadelphia. p.58-92.
Pires, A. V.; Carneiro, P. L. S.; Torres Filho, R. A.; Fonseca, R.; Torres, R. A.; Euclydes, R. F.; Lopes, P. S. and Barbosa, L. 2002. Estudo da divergência genética entre seis linhas de aves Legorne utilizando técnicas de análise multivariada. Arquivo Brasileiro de Medicina Veterinária e Zootecnia 54:314-319.
Rao, C. R. 1973. Linear statistical Inference and its applications. 2nd ed. John Wiley, Chichester.
Riggs, T. J. 1973. The use of canonical analysis for selection within a Press Inc., New York. Cultivar of spring barley. Annals of Applied Biology 74:249-258.
Tamura, K.; Peterson, D.; Peterson, N.; Stecher, G.; Nei, M. and Kumar, S. 2011. MEGA5: Molecular evolutionary genetics analysis using maximum likelihood, evolutionary distance, and maximum parsimony methods. Molecular Biology and Evolution 28:2731-2739.
Tunon, M. J.; Gonzalez, P. and Vallejo, M. 1989. Genetic relationships between 14 native Spanish breeds of goat. Animal Genetics 20: 205-212.
Turan, C.; Yalcin, S.; Turan, F.; Okur, E. and Akyurt, I. 2005. Morphometric comparisons of African catfish,Clarias gariepinus,
populations in Turkey. Folia Zoology54:165-172.
Wimmers, K.; Ponsuksili, S.; Hardge, T.; Valle-Zarate, A.; Mathur, P. K. and Horst, P. 2000. Genetic distinctness of African, Asian and South American local chickens. Animal Genetics 31:159-165. Yakubu, A.; Kuje, D. and Okpeku, M. 2009. Principal components