SPATIAL AND TEMPORAL VARIABILITY OF HYDROGRAPHIC PARAMETERS MEASURED
IN THE ESTUARY OF THE JAGUARIBE RIVER (SEMI-ARID REGION, NORTHEAST, BRAZIL)
Alex Costa da Silva
1, Luiz Drude de Lacerda
2and Jader Onofre de Morais
3 Recebido em 25 maio, 2010 / Aceito em 7 maio, 2012Received on May 25, 2010 / Accepted on May 7, 2012
ABSTRACT.The objective of this work is to characterize the spatial and temporal variability of hydrographic parameters collected in April/2007 and May/2008, at two stations (12 hr and 25 hr) in the estuary of the Jaguaribe river (Semi-arid region, Northeast, Brazil). The time series analyses of the hydrographic data collected at fixed stations during the usual rainy months in the region showed a strong annual variation of the measured parameters. In May/2008, waters with low salinity values (<4) have been observed at a station located in the mouth of the Jaguaribe river. In April/2007, the lowest salinity values were observed around 32 at the same location. The temperature, suspended sediment concentration and turbidity time series values are controlled by the tide dynamic at stations located in the estuary mouth and in the mixture zone, showing highest values during low tide conditions and lowest values during high tide conditions. In April/2007, dissolved oxygen values tend to increase with the increase of salinity, whereas in May/2008, the values tend to increase with the decrease of salinity. The values of chlorophyll-a collected in May/2008 in the mixture zone showed an increase in comparison with April/2007.
Keywords: salinity, temperature, precipitation, currents, tidal cycles.
RESUMO.O trabalho tem como objetivo analisar a variabilidade sazonal e espacial de parˆametros hidrogr´aficos coletados em abril/2007 e maio/2008, em duas estac¸˜oes (12h e 25h) no estu´ario do rio Jaguaribe (Semi-´arido do NE Brasileiro). As an´alises das s´eries temporais dos parˆametros hidrogr´aficos observados nas estac¸˜oes fixas durante os meses habituais de chuva na regi˜ao demonstraram variac¸˜ao anual nos parˆametros medidos. No mˆes de maio/2008 foi observada a presenc¸a de ´aguas com baixa salinidade (<4) na estac¸˜ao localizada na foz e, no mˆes de abril/2007, os menores valores de salinidade foram observados em torno de 32 na mesma localidade. Os valores das s´eries temporais de temperatura, Concentrac¸˜ao de Sedimento em Suspens˜ao e turbidez responderam `as variac¸˜oes das mar´es nas estac¸˜oes localizadas na foz e na zona de mistura, com maiores valores observados em condic¸˜oes de baixa-mar e menores em condic¸˜oes de preamar. Em abril/2007 os valores de oxigˆenio dissolvido tendem a crescer com o aumento da salinidade no estu´ario e em maio/2008 os valores tendem a crescer com a diminuic¸˜ao de salinidade. A an´alise dos dados de clorofila-a coletados em maio/2008 na zona de mistura indica que houve um aumento em seus valores, em comparac¸˜ao aos dados coletados em abril/2007.
Palavras-chave: salinidade, temperatura, precipitac¸˜ao, correntes, ciclos de mar´e.
1Laborat´orio de Oceanografia F´ısica Estuarina e Costeira, Departamento de Oceanografia, Universidade Federal de Pernambuco – LOFEC/DOCEAN/UFPE, Av. Arqui-tetura s/n, Campus Universit´ario, 50739-540 Recife, PE, Brazil. Phone: +55(81) 2126-8225; Fax: +55(81) 2126-8225 or 8228 – E-mails: [email protected], [email protected]
2Instituto de Ciˆencias do Mar, Universidade Federal do Cear´a, Av. Abolic¸˜ao, 3207, 60165-081 Fortaleza, CE, Brazil. Phone: +55(81) 3366-7015 – E-mail: [email protected]
3Universidade Estadual do Cear´a, CCT, LGCO, Av. Paranjana, 1700, Campus do Itaperi, 60740-000 Fortaleza, CE, Brazil. Phone: +55(81) 3101-9786 – E-mail: [email protected]
“main” — 2013/4/5 — 15:29 — page 246 — #2
246
SPATIAL AND TEMPORAL VARIABILITY OF HYDROGRAPHIC PARAMETERS MEASURED IN THE ESTUARY OF THE JAGUARIBE RIVERINTRODUCTION
The physical processes of the estuarine waters and the estuar-ine circulation controls the estuarestuar-ine water residence time and rules the transport of nutrients, sediments, pollutants and other dissolved and suspended constituents discharged in the adjacent oceanic regions.
In this way, little is known about the physical and hydro-graphic parameters of the Jaguaribe (CE) river estuary, located in an area of the semi-arid region of the Brazilian Northeast, an area with scarce water resources where there is a need of hydrological studies and surveys.
The main purpose of this article is to describe the hydro-dynamic and thermohaline system, to identify and quantify the hydrographic properties of the estuarine waters of the Jaguaribe (CE) river, in relation to distinct spatial (Coastal Zone and Mixture Zone) and temporal (April/2007 and May/2008) conditions.
The Jaguaribe river drains into the equatorial Atlantic, in a region of sand beaches with extensive dune fields moving by constant winds. According to data from Secretaria dos Recursos H´ıdricos do Estado do Cear´a – SRH (1992), the Jaguaribe river covers nearly 610 km since its head at Serra da Joaninha (Tau´a) up to the mouth, at the coast of Aracati (CE).
Many dams were built along the Jaguaribe river to control and rectify the water courses, in order to storage water during the prolonged dry periods of this semi-arid region of the Brazilian Northeast. In this way, the Jaguaribe river estuary is limited from the river mouth up to nearly 40 km upstream, as far as Itaic¸aba (CE) district, where there is the last river dam, built in 1993. The Itaic¸aba dam controls the water flow to the river mouth, making the estuarine circulation practically dependent on the influence of the coastal tide during the dry weather period (Paula, 2006). However, these multiple dam systems, built along the drainage basin of the Jaguaribe river, are currently reducing the transport of nutrients, sediments, pollutants and other dissolved and sus-pended constituents.
The impacts on the coastal zone caused by the construction of dams have been widely reported, like the loss of the fishery re-sources and the coast destabilization/erosion, as for example in the Nile, Ebro, Ganges, Danube and San Francisco rivers (Halim, 1991; Sinha et al., 1996; Humborg et al., 1997; Knoppers et al., 2006). In Ebro river (Spain), the construction of dams along the river caused the increase of salinity in the estuary, the decrease of biological productivity, mainly due to the reduction of nutri-ent input, changes in species distribution, reduction of sedimnutri-ent volume, which affected the system geomorphology (Cruzado et al., 2002; Ib´a˜nez & Prat, 2003; Sierra et al., 2004).
The rainfall distribution in the semi-arid region of the Brazil-ian Northeast is strongly induced by the latitudinal positioning of the Intertropical Convergence Zone (ITCZ) over the Atlantic: dry weather conditions occur from August to September, when the ITCZ is positioned farther north (around 14◦N), during the
rainy season (from February till May), the ITCZ gets closer to the equator (Hastenrath & Greischar, 1993). The combination of the ITCZ position with other phenomena, like the Atlantic dipole (SST anomalies in the Atlantic), the Pacific El Ni˜no and La Ni˜na, implies in further disturbances in the rainfall regime in the region (Hastenrath & Heller, 1977; Moura & Shukla, 1981; Hastenrath, 1990; Servain, 1991).
The following work presents a study of the seasonal and spa-tial variability of the main hydrological parameters (temperature, salinity, currents, dissolved oxygen, chlorophyll and turbidity) that were collectedin situ in the Jaguaribe river estuary.
METHODOLOGY
Two water sampling campaigns were performed in the Jaguaribe river estuary (Fig. 1) during April, 16-18/2007 and May, 06-07/2008. During April/2007 the physical, physico-chemical and chlorophyll-a parameters were measured at two fixed previously defined stations: Station 01, located at the estuary mixture zone, and Station 02, located at the mouth of the estuary (approximately 9 km distant from station 1). The maximum registered depth at Station 01 and Station 02 was nearly 5 m. At Station 01 the para-meters were measured with one hour sampling intervals during 12 hours. The sampling intervals were the same at Station 02 but the parameters were measured during 25 hours, in semidiur-nal tidal cycles and spring tide conditions. During May/2008 the water sampling was carried out only at Station 02, with spring tide conditions. Due to the weather conditions in May/2008, it was not possible to continue the sampling campaign at Station 01.
The parameters were measured on the water column at every second, using a SAIV A/S SD204 STD/CTD oceanographic probe for temperature (◦C – Resolution: 0.001◦C), salinity (psu
– Resolution: 0.01), dissolved oxygen (mg L−1– Resolution:
0.01 mg L−1), turbidity – retroflection optical sensor (FTU – For-mazin Turbidity Unit) and chlorophyll-a (μg L−1, Resolution:
−0.03 μg L−1).
The water sampling was carried out on the surface (April/ 2007) and on the surface and near the bottom (May/2008), using a Van Dorn bottle. To analyze the suspended material, the water samples were filtered using a vacuum pump, with Millipore 0.45μ cellulose acetate filters. The difference of the filter weight
Figure 1 – Location map of the measurement stations in the Jaguaribe river estuary. Station 01 (12 hours) – located at the estuary
mixture zone and Station 02 (25 hours) – located at the estuary mouth.
values, before and after the filtrations, was applied to calculate the sample suspended sediment concentration (SSC).
Due to problems with the turbidity data obtained by the retro-flection optical sensor in May/2008, only the SSC values for the water samples will be presented for this period.
Current intensity (cm s−1) and direction (degrees)
measure-ments for the longitudinal component u (direction along the estuarine channel) were carried out on the surface (∼0.5 m) and near the bottom (in 60 second intervals) using the Sensordata SD-6000 mini current meter.
“main” — 2013/4/5 — 15:29 — page 248 — #4
248
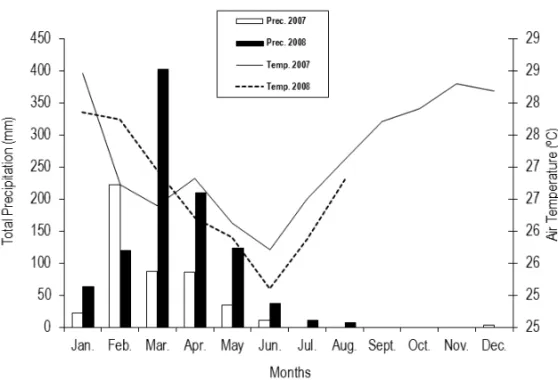
SPATIAL AND TEMPORAL VARIABILITY OF HYDROGRAPHIC PARAMETERS MEASURED IN THE ESTUARY OF THE JAGUARIBE RIVERFigure 2 – Monthly averages total precipitation and air temperature observed in 2007 and 2008.
Tidal measurements were performed during the entire sam-pling period using a traditional analog tide gauge. The meteoro-logical parameter data (direction and intensity of the winds and monthly average precipitation) presented in this work were obtained at the measurement stations of Fundac¸˜ao Cearense de Meteorologia e Recursos H´ıdricos do Estado do Cear´a (FUNCEME), located in Aracati district-CE (4◦34001.0600S –
37◦46001.1000W).
RESULTS
Temporal variability of the climatic parameters
The total precipitation data (mm) obtained at the FUNCEME measurement stations, located in Aracati districts (Aracati sta-tion), demonstrate that the maximum total precipitation values were registered in the first semester of 2007 and 2008, mainly in the rainy season that starts in February and finishes in May. The precipitation tends to decrease from July till November (dry sea-son). Markham (1974) had already observed this temporal rain-fall distribution through analyses of the historical series of the data from 1850-1970.
The maximum monthly average precipitation observed in March/2008 was around 400 mmm, whereas in 2007 the monthly average for the same period did not reach 100 mm (Fig. 2). This 50% difference of total precipitation registered in March/ 2008 in relation to March/2007 was also observed in April, May and June.
The air temperature of the region shows a similar standard in relation to the monthly averages of the two observed years.
The maximum values occurred in January and December (around 28◦C) and a decrease in the air temperature values tended to
hap-pen in June (Fig. 2).
The wind directions in the study region during the sampling campaign months were from NE and NW in April 2007 and chiefly from NE in May 2008. The average wind speed values were around 3.5-4.0 m s−1in these periods (Fig. 3).
Temporal variability of the physical and physico-chemical parameters
Tidal cycle – 12 hours (April/2007)
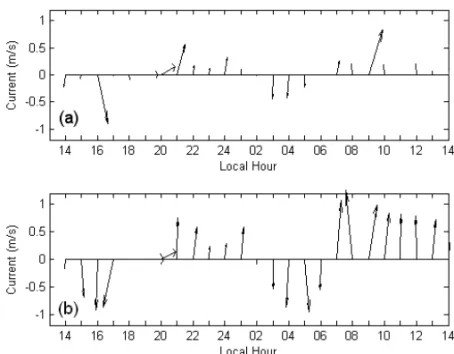
Registers of the intensity and direction of theu longitudinal cur-rent component indicate an asymmetry in the estuary curcur-rents underu > 0 and above u < 0, during the 12 hour temporal series of measurements in a fixed station (Station 01), located at the estuary mixture zone of the Jaguaribe river (Fig. 1). The maximum intensity values of the currents observed on the surface were 67.8 cm s−1and –43.4 cm s−1, under ebb and flood tide
conditions. Near the bottom, the currents reached their maximum intensity around 82.8 cm s−1and –49.2 cm s−1under ebb and
flood tide conditions (Figs. 4a and 4b; Table 1).
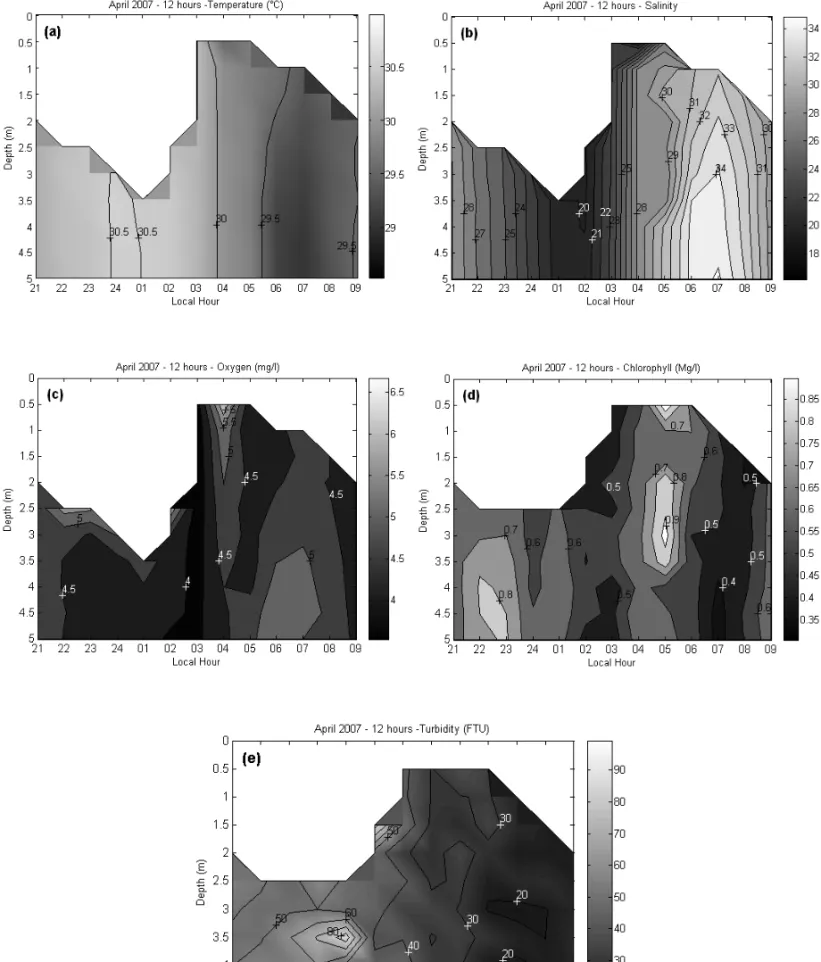
During the 12 hour temporal series measurements, the tem-perature values varied around 1.5◦C between the neap (30.5◦C)
and spring (29.0◦C) tides. The values did not vary along the water
column (Fig. 5a; Table 1). The salinity values also demonstrated that they are affected by the tidal dynamics, varying from 20 during the low-tide to 34 during the high-tide (Fig. 5b).
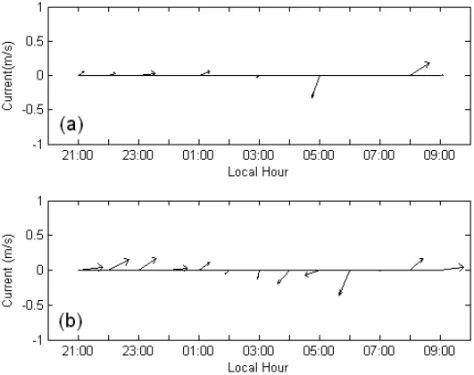
Figure 3 – Monthly averages wind direction (degrees) and velocity (m/s) observed in April/2007 (a) and in May/2008 (b).
Figure 4 – Current dynamics (u) during 12 hours in the estuary mixture zone of Jaguaribe river
(Station 01) in April 2007, (a) surface and (b) bottom. Negative values correspond to currents towards the estuary head and positive values towards the ocean.
The dissolved oxygen values oscillated during the 12 hours, with a maximum value equals to 5.5 mg L−1and a minimum value
equals to 3.7 mg L−1(Fig. 5c).
The chlorophyll concentrations obtained along the water column during the measurements taken in the 12 hour period at the fixed station oscillated between 0.4 μg L−1and 0.9 μg L−1,
with the maximum value observed under high-tide (05:00 hr) (Fig. 5d; Table 1).
During the measurements at Station 01, the turbidity oscil-lated between 20 and 90 (FTU), with maximum turbidity value (90 FTU) observed under ebb and low-tide conditions and min-imum turbidity value (20 FTU) observed under flood- and high-tides (Fig. 5e). The highest suspended sediment concentrations (88.9 mg L−1) were measured under low-tide and the lowest
“main” — 2013/4/5 — 15:29 — page 250 — #6
250
SPATIAL AND TEMPORAL VARIABILITY OF HYDROGRAPHIC PARAMETERS MEASURED IN THE ESTUARY OF THE JAGUARIBE RIVERFigure 5 – Vertical temporal variation (12 hours) of temperature (a), salinity (b), dissolved oxygen (c), chlorophyll-a (d) and turbidity (e) in the estuary mixture zone
Table 1 – Average values integrated along the water column of the physical and physico-chemical parameters collected in April/2007 and May/2008 at two fixed
stations (mixture zone – Station 01 and mouth of the Jaguaribe river – Station 02), during (12 hours (a) and 25 hours (b)) tidal cycle(s). A negative sign corresponds to the velocity of currents towards the estuary head and positive signs correspond to the velocity of currents towards the ocean.
Fixed Temp. Sal. Oxyg. Turb. SSC Chlor. Flood Ebb
station (◦C) (psu) (mg L−1) (FTU) (mg L−1) (μg L−1) Current Current
(cm s−1) (cm s−1) Station 01 Min. 29.1 19.9 3.7 20.3 23.8 (sup.) 0.4 –12.2 3.8 (April/2007) Max. 30.5 33.6 5.5 90 88.9 (sup.) 0.9 –43.4 82.8 Average 29.9 27.0 4.5 39.1 64.1 (sup.) 0.6 –26.1 52.3 Standard 0.4 4.5 0.3 14.1 30.9 (sup.) 0.1 14.1 31.2 Deviation Station 02 Min. 29.0 31 4.8 8.2 15.3 (sup.) 0.4 –18.8 22.4 (April/2007) Max. 30.4 37.6 6.9 40 86.9 (sup.) 1.2 –127.8 130.0 Average 29.5 35.4 5.8 17.6 33.2 (sup.) 0.6 85.1 74.7 Standard 0.4 2.2 0.4 9.0 30.2 (sup.) 0.16 39.9 36.8 Deviation Station 02 Min. 29.1 0.16 5.3 – 134.9 (sup.) 11.7 –11.2 8.8 (May/2008) 141.4 (fun.) Max. 31.2 32.6 7.4 – 188.6 (sup) 22.7 –111.6 131.0 177.5 (fun.) Average 30.1 13.1 6.2 – 153.6 (sup.) 16.9 –69.1 73.5 158.0 (fund.) Standard 0.5 13.7 0.57 – 22.3 (sup.) 3.2 35.7 35.6 Deviation 12.8 (sup.)
Figure 6 – Current dynamics (u) during 25 hours in the mouth of the Jaguaribe river estuary
“main” — 2013/4/5 — 15:29 — page 252 — #8
252
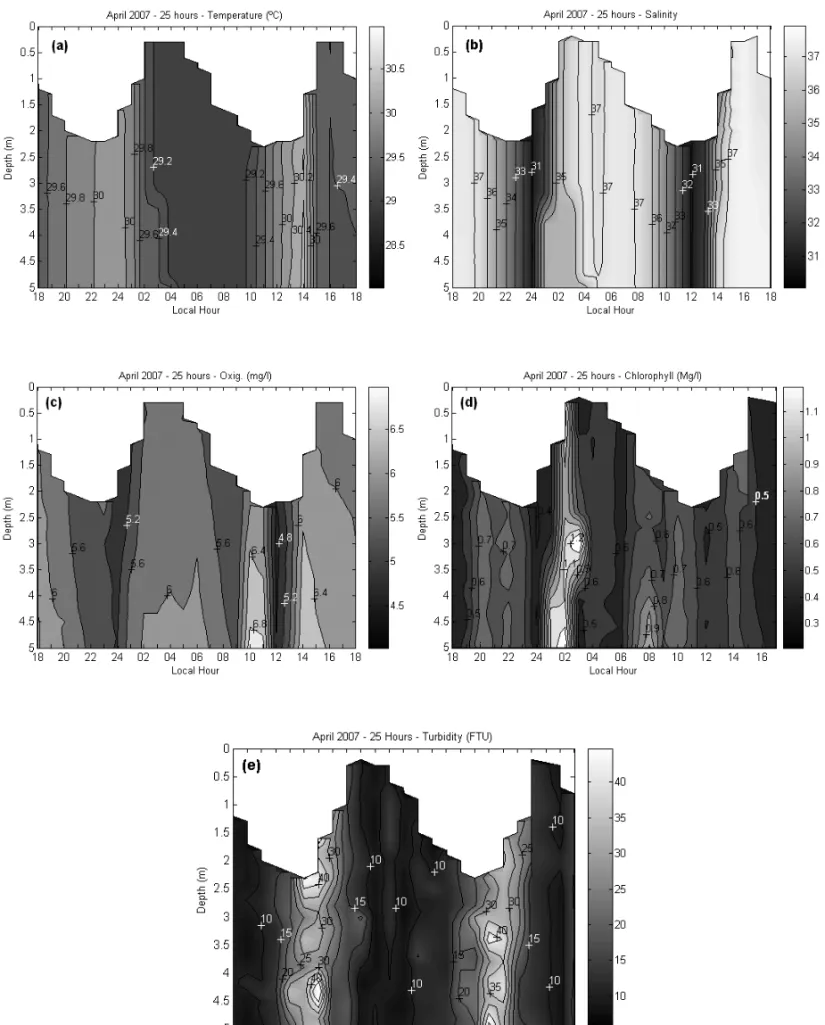
SPATIAL AND TEMPORAL VARIABILITY OF HYDROGRAPHIC PARAMETERS MEASURED IN THE ESTUARY OF THE JAGUARIBE RIVERFigure 7 – Vertical temporal variation (25 hours) of temperature (a), salinity (b), dissolved oxygen (c), chlorophyll-a (d) and turbidity (e) in the mouth of the Jaguaribe
Tidal cycles – 25 hours (April/2007)
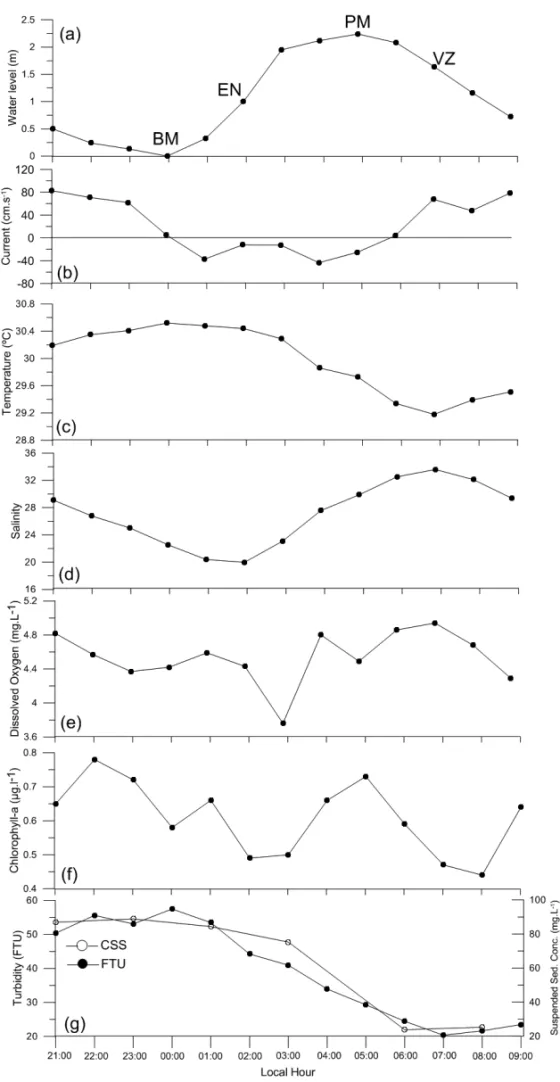
Figures 6 and 7 and Table 1 present the average values of the parameters obtained at a fixed station (Station 02), located at the mouth of the Jaguaribe river estuary (Fig. 1), during April/2007.
In this location, the longitudinal current velocity values (u) oscillated according to the tidal conditions, with maximum val-ues around 130 cm s−1and –127 cm s−1under ebb and flood
tide conditions (Fig. 6; Table 1).
The temperature values responded to the tidal dynamics vari-ations, with maximum temperature values (30.0◦C and 30.4◦C)
observed under low-tide conditions (23:00 hr and 14:00 hr), get-ting a 0.4◦C variation associated to the intensity of solar
ra-diation between the collections carried out at 14:00 hr and at 24:00 hr (Fig. 7a).
In this location, the salinity temporal series values responded to the tidal dynamics variations, with lower salinity values (31-33) observed under ebb and low-tide conditions and higher salinity values (37) observed under flood tide conditions (Fig. 7b).
The dissolved oxygen values observed along the water col-umn presented a maximum value equals to 6.8 mg L−1near the
bottom and a minimum value equals to 4.8 mg L−1 near the
surface of the water column, under low and ebb tide conditions (Fig. 7c).
The temporal variation of chlorophyll concentration along the column during the measurement period was around 0.4-1.1 μg L−1, with higher values observed during the flood and
high-tide conditions (Fig. 7d).
The maximum FTU and SSC values (25-40 FTU and 86.9 mg L−1) were observed under low-tide conditions (Fig. 7e;
Table 1).
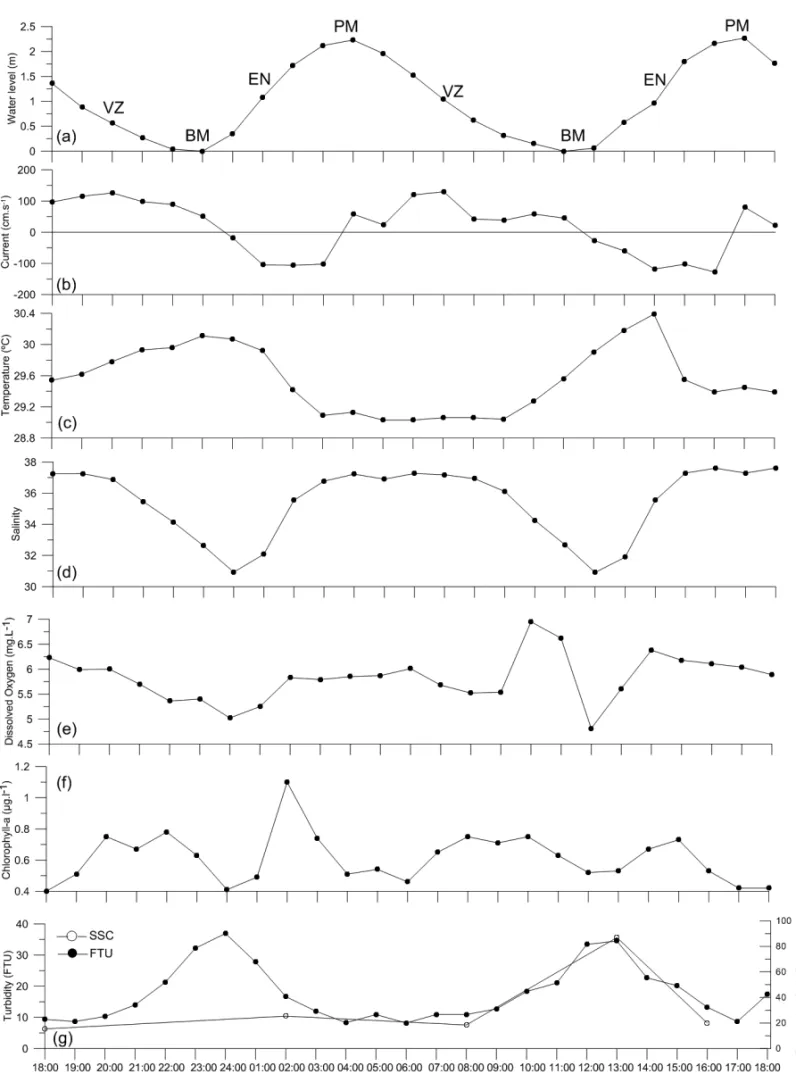
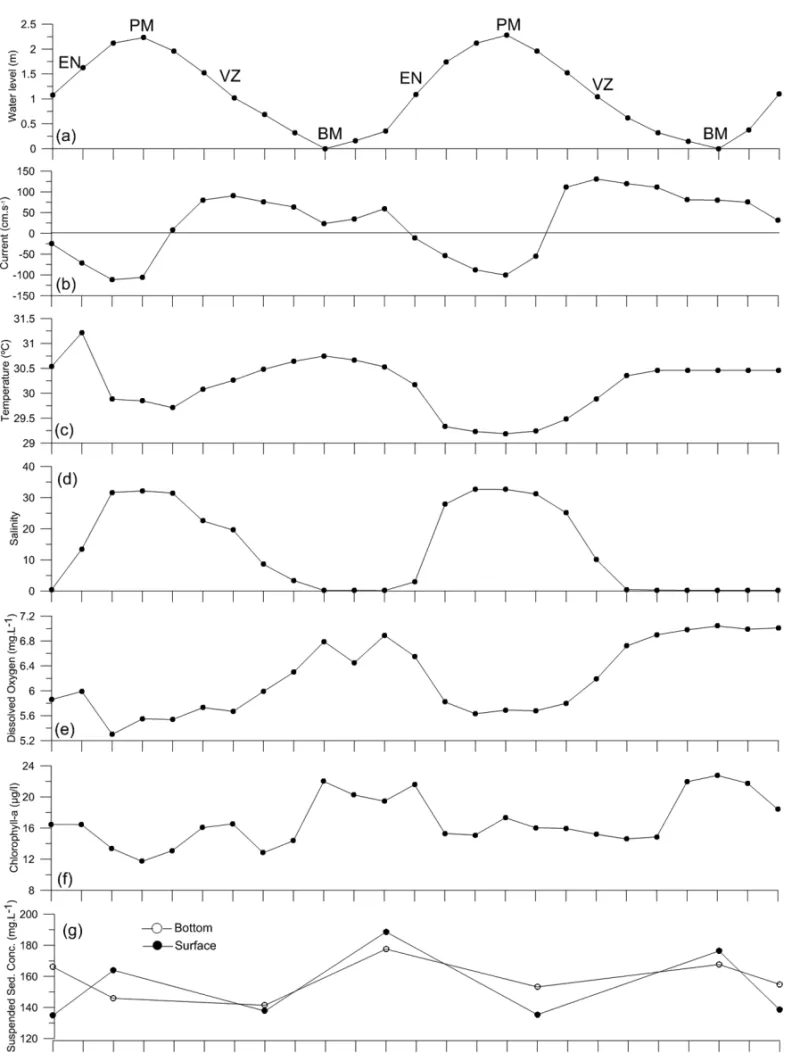
Tidal cycles – 25 hours (May/2008)
The temporal series of measurements performed in May/2008 at Station 02 (located at the mouth of the Jaguaribe river) demon-strated that the averages of the maximum intensity values of the currents were 131 cm s−1and –111 cm s−1, induced by the ebb
(tide + fluvial discharge) and flood tide dynamics, respectively (Fig. 8; Table 1).
The average temperature values oscillated around 30.15◦C,
with a maximum equals to 31.2◦C and a minimum equals to
29.1◦C (Fig. 9a; Table 1). There was no temperature variation
along the water column. The temporal salinity variation oscil-lated according to the tidal dynamics, with the lowest salinity values (0.16-0.22) observed during the ebb and low-tides and the highest salinity values (around 32) observed under flood and high-tide conditions (Fig. 9b; Table 1). The higher dissolved
oxygen values (around 7 mg L−1) were observed under
low-tide conditions (10:00 hr) and the lower dissolved oxygen values (5.4 mg L−1) were observed under high-tide conditions (16:00 hr)
(Fig. 9c). The highest chlorophyll-a concentrations were 21.9-22.7 μg L−1(Fig. 9d).
The SSC temporal variation was also associated to the tidal influence, with higher concentrations (188.6 mg L−1on the
sur-face and 177 5 mg L−1 on the bottom) observed during the
low-tide (Table 1).
DISCUSSION Spatial variability
The averaged values of the physical and physico-chemical para-meters integrated along the water column for the two different stations, located at the mixture zone (Station 01) and at the mouth of the estuary (Station 02), demonstrated the water exchange re-lation between these two estuary sectors, governed by the tidal dynamics. In hourly time scales, the tidal advection under low and ebb tide conditions transport fresh water and under flood and high tide conditions saltwater intrusion occurs, resulting in a strong change in the water properties, like salinity (Uncles & Stephens, 1996), and in the suspended solid particles (Renshun, 1992).
The presented average results (Fig. 10) demonstrates that the lowest salinity observed in April/2007 in the mixture zone of the estuary (Station 01) was around 20 under low tide conditions (± 0.32 m), tending to an increase of the salinity values un-der flood tide conditions. Simultaneously, the minimum salinity measured observed at the mouth of the estuary (Station 02 – Fig. 11d) was 30.91 under low tide condition (0.35 cm), tending to increase the salinity values in the subsequent measurement hours under flood tide conditions (∼= –120 cm s−1).
At Station 01 the dissolved oxygen values tend to have a slight increase (maximum value equals to 4.94 mg L−1) with
the incoming of a saltwater mass related to the flood tide (Fig. 10e). At Station 02, located at the mouth of the Jaguaribe river, the dissolved oxygen values oscillated between 4.8 mg L−1–
6.9 mg L−1, with an average equals to 5.8 m. L−1(Fig. 11e;
Table 1). These results confirm that the presence of saltwater influences the increase of the dissolved oxygen contents in the estuarine environment.
Eschrique (2007) revealed that the estuarine waters of the Jaguaribe river are well oxygenated, with average contents equal to 5.2 mg L−1–7.0 mg L−1, and it can be considered a saturated
to supersaturated environment.
The data related to chlorophyll-a at Stations 01 and 02 did not present significant spatial and temporal variations in
“main” — 2013/4/5 — 15:29 — page 254 — #10
254
SPATIAL AND TEMPORAL VARIABILITY OF HYDROGRAPHIC PARAMETERS MEASURED IN THE ESTUARY OF THE JAGUARIBE RIVERFigure 8 – Current dynamics (u) during 25 hours in the mouth of the Jaguaribe river estuary
(Station 02) in May/2008, near (a) surface and (b) bottom.
Figure 9 – Vertical temporal variation (25 hours) of temperature (a), salinity (b), dissolved oxygen (c) and chlorophyll-a (d) in the mouth of the Jaguaribe river estuary
Figure 10 – Average values integrated along the water column at Station 01, during 12 hours in April/2007. Sea
“main” — 2013/4/5 — 15:29 — page 256 — #12
256
SPATIAL AND TEMPORAL VARIABILITY OF HYDROGRAPHIC PARAMETERS MEASURED IN THE ESTUARY OF THE JAGUARIBE RIVERFigure 11 – Average values integrated along the water column at Station 02, during 25 hours in April/2007. Sea level height (a), currents (b), temperature (c), salinity
their values. The values at the two stations oscillated between 0.4 μg L−1–0.8 μg L−1(Figs. 10f and 11f).
The SSC and turbidity values (Figs. 10g and 11g) observed in the two different estuarine zones (mixture and coastal zones) are controlled by the tide dynamics. The maxima SSC and turbid-ity values observed in April/2007 in the mixture zone (Station 01) was 88.9 mg L−1and 57.4 FTU under low tide condition. The
tur-bidity value decreased with the incoming of the flood tide current. In the estuary mouth (Station 02), the SSC and turbidity highest value observed was 86.9 mg L−1and 36.9 FTU associated to the
low tide level (0.35-0.58 m). The values decreased under flood tide conditions.
Correlation of the temporal series (25 hours) – tide and precipitation influence
The analyses of the temporal series at Station 02 in 2007 and 2008, during the months with higher pluviosity in the region (end of April and beginning of May) demonstrated an annual variation in the values of some physical and physico-chemical parameters, like salinity, turbidity, temperature and dissolved oxygen. This dif-ference among the values of the parameters observed in the end of April/2007 and in the beginning of May/2008 was directly related to the monthly precipitation average. In May/2008 the total pre-cipitation rate was almost 50% higher than the total prepre-cipitation rate observed in April/2007 (Fig. 2). According to Ver´ıssimo et al. (1996), the maximum average precipitation in the Aracati region for 1912 till 1985 was 237.8 mm in March, whereas between June and December the monthly averages for the period were equal or lower than 47.7 mm, with a rainfall minimum average equals to 2.4 mm for September.
The precipitation rate differences observed in the two rainy periods (May/2008 and April/2007) contributed to the variation of the temperature and salinity values of the estuarine waters. Fig-ures 11d and 12d demonstrate the presence of low salinity waters (<4) at Station 02 during May/2008, and during April/2007 the lowest salinity values were around 32 in the same location.
In April/2007 it was observed a saltwater mass intrusion (≥36) from the inner continental shelf towards the estuary head, under flood tide conditions. In other observation in May/2008, the maximum observed salinity was around 32 under flood tide con-ditions (Fig. 9b). The observed salinity variations between mea-surements can be attributed to the elevated rainfall in May/2008, as Figure 2 shows. The temperature vs salinity diagram (Fig. 13a) demonstrates that the lowest salinity values were associated to the highest temperature values, influenced by fresh water discharge induced by ebb tide currents.
During the measurements carried out in May/2008, the dis-solved oxygen values tend to decrease with the increase of salinity under high tide conditions, the opposite of what was observed in April/2007 at the same collection station (Figs. 11e and 12e).
The correlations between the dissolved oxygen and salinity values presented opposite trends between the two campaigns car-ried out at Station 02 in April/2007 and May/2008. In April/2007 the dissolved oxygen values tend to increase with the increase of the saltwater intrusion in the estuary from the inner shelf, whereas in May/2008 the dissolved oxygen values tend to increase with the salinity decrease (Fig. 13b). This dissolved oxygen increase ob-served in May/2008 may be related to the renewal of the fluvial waters in the estuarine environment, caused by the high precipi-tation index in the region.
The analysis of the chlorophyll-a data collected in May/2008 at Station 02 indicates a value increase, when compared with the data collected in April/2007. This increase of the chlorophyll-a contents is also related to the increase of the fluvial water in-put in the coastal zone. Moreira (2005) and Eschrique (2007) demonstrated higher chlorophyll-a values in the upper estuary of the Jaguaribe river, decreasing towards the lower estuary, with a chlorophyll-a increase in the estuarine environment during the samplings performed during the rainy season.
Studies carried out on the Ebro river estuary demonstrated that the constructions of hydraulic structures in the river (dams, reservoirs, channels) can foster phytoplankton development, as-sociated to the higher nutrient concentration, particularly in shal-low and sluggish water portins of the river (Sabater et al., 2008). Spatial variations of chlorophyll-a concentration along the Ebro river during the spring, autumn and winter seasons were pre-sented by Falco et al. (2010), demonstrating a higher chlorophyll-a concentrchlorophyll-ation in the stchlorophyll-ations locchlorophyll-ated chlorophyll-a 100 km from the mouth of the river and decreasing towards the coastal region.
In April/2007 and May/2008, the turbidity values observed in the Jaguaribe river estuary tend to increase under low tide con-dition and between 1-2 hours after the low tide (flood tide). The highest turbidity values are associated to the highest temperature values and to the lowest salinity values observed in the stations during the sampling campaigns (Figs. 12 and 13).
CONCLUSIONS
The values measurements of the hydrographic parameters ob-served in two different fixed stations (located in the mixture zone and mouth of the Jaguaribe river estuary (CE)) demonstrate that the tide dynamics, associated to the fluvial discharge and to the pluviometric index, are the main factors controlling the temporal
“main” — 2013/4/5 — 15:29 — page 258 — #14
258
SPATIAL AND TEMPORAL VARIABILITY OF HYDROGRAPHIC PARAMETERS MEASURED IN THE ESTUARY OF THE JAGUARIBE RIVERFigure 12 – Average values integrated along the water column at Station 02, during 25 hours in May/2007. Sea level height (a), currents (b), temperature (c), salinity
Figure 13 – Diagrams of temperatureversussalinity (a), dissolved oxygenvs.salinity (b) for data collected at Station 02 in April/2007 and May/2008.
and spatial variability of the physico-chemical parameters in the estuarine environment.
The temporal series analyses of the hydrographic parame-ters observed durinng 25 hours at a fixed station, located at the mouth of the Jaguaribe river estuary (CE), during the rainy periods (May/2008 and April/2007), demonstrate large variations. It was observed, for example, the presence of low salinity waters (<4) in May/2008, whereas in April/2007 the lowest salinity values were around 32 at the same location.
It is possible to conclude that the Jaguaribe river (CE) estu-ary undergoes seasonal variations in its physical and physico-chemical parameters, which are directly related to the regional precipitation indexes, that controls the fresh water input to the estuary.
We can also highlight that in the last years the region was affected by climatic changes – large inundations – that modi-fied the estuarine natural exchange and transport of the physical and physico-chemical parameters. The environment was also af-fected by the human modifications (dam constructions along the Jaguaribe river), decreasing the water discharge in the estuarine environment.
ACKNOWLEDGMENTS
The first author thanks CAPES for conceding the PNPD scholar-ship for the period when this project was written. Also, the review-ers that provided suggestions and corrections that contributed to a better quality for this article. And FUNCAP/CNPq for the
“main” — 2013/4/5 — 15:29 — page 260 — #16
260
SPATIAL AND TEMPORAL VARIABILITY OF HYDROGRAPHIC PARAMETERS MEASURED IN THE ESTUARY OF THE JAGUARIBE RIVERfinancial aid through the PPP project (Hidrodinˆamica no Estu´ario do rio Jaguaribe (CE): Caracterizac¸˜ao Experimental e Modelagem Matem´atica (Edital N◦04/2006 – FUNCAP/CNPq)).
REFERENCES
SRH. 1992. Secretaria de Recursos H´ıdricos-SRH. Atlas Eletrˆonico dos Recursos H´ıdricos e Meteorol´ogicos do Cear´a. Available on: <http://atlas.srh.ce.gov.br/>. Access on: May 01, 2012.
CRUZADO A, VEL´AZQUEZ Z, P´EREZ MC, BAHAM´ON N, GRIMALDO NS & RIDOLFI F. 2002. Nutrient fluxes from the Ebro river and subsequent across-shelf dispersi´on. Continental Shelf Research, 22: 349–360. ESCHRIQUE SA. 2007. Hidrogeoqu´ımica do f´osforo no Estu´ario do Jaguaribe (CE). M.Sc. Dissertation on Tropical Marine Science. Uni-versidade Federal do Cear´a. Fortaleza/CE. 2007, 101 p.
FALCO S, NIENCHESKI LF, RODILLA M, GONZALEZ DEL RIO J, SIERRA JP & MOSSO C. 2010. Nutrient flux and budget in the Ebro estuary. Estuarine, Coastal and Shelf Science, 87: 92–102.
HALIM Y. 1991. The impact of human alterations of the hydrological cycle on ocean margins. pp. 301-328. In: MANTOURA RFC, MARTIN J-M & WOLLAST R. (Eds.). Ocean Margin Processes in Global Change. Chichester: John Wiley & Sons, 469 p.
HASTENRATH S. 1990. Prediction of Northeast Brazil rainfall anomalies. Journal of Climate, 3: 893–904.
HASTENRATH S & HELLER L. 1977. Dynamics of climatic hazards in Northeast Brazil. Quarterly Journal of the Royal Meteorological Society, 103: 77–92.
HASTENRATH S & GREISCHAR A. 1993. Circulation mechanisms related to Northeast Brazil rainfall anomalies. Journal of Geophysical Research, 98: 5093–5102.
HUMBORG C, ITTEKKOT V, COCIASU A & VON BODUNGEN B. 1997. Effect of Danube River dam on Black Sea biogeochemistry and ecosys-tem structure. Nature, 386: 385–388.
IB´A˜NEZ C & PRAT N. 2003. The environmental impact of the Spanish National Hydrological Plan on the lower Ebro River and Delta. Water Resources Development, 19(3): 485–500.
KNOPPERS B, MEDEIROS PRP, SOUZA WFL & JENNERJAHN T. 2006. The S˜ao Francisco Estuary, Brazil. In: HANDBOOK of Environment Chem-istry. Berlin Heidelberg: Springer-Verlag, vol. 5, Part H, p. 51–70.
MARKHAM CG. 1974. Apparent periodicities in rainfall at Fortaleza, CE, Brazil. Journal of Applied Meteorology, 13: 176–179.
MOREIRA MOP. 2005. Biomassa do fitoplˆancton (clorophila-a) nos estu´arios do Estado do Cear´a. Programa Zoneamento Ecol´ogico e Eco-nˆomico da Zona Costeira do Estado do Cear´a. Governo do Estado Cear´a e Universidade Federal do Cear´a, 42 p.
MOURA AD & SHUKLA J. 1981. On the dynamics of droughts in northeast Brazil: Observations, theory and numerical experiments with a general circulation model. Journal of the Atmospheric Sciences, 38: 2653–2675.
PAULA DP. 2006. Elaborac¸˜ao de Paisagens Cont´ıguas ao Estu´ario do Rio Jaguaribe-CE. M.Sc. Dissertation on Geography, UECE, Fortaleza (CE), 200 p.
RENSHUN Z. 1992. Suspended sediment transport processes on tidal mud flat in Jiangsu Province, China. Estuarine, Coastal and Shelf Science, 35: 225–233.
SABATER S, ARTIGAS J, DUR´AN C, PARDOS M, ROMAN´I AM, TORN´ES E & YLLA I. 2008. Longitudinal development of chlorophyll and phyto-plankton assemblages in a regulated large river (the Ebro River). Science of The Total Environment, 404: 196–206.
SERVAIN J. 1991. Simple Climatic for the Tropical Atlantic Ocean and Some Applications. Journal of Geophysical Research, 96(8): 15137– 15146.
SIERRA JP, S´ANCHEZ-ARCILLA A, FIGUERAS PA, GONZ´ALEZ DEL R´IO J, RASSMUSEN EK & M¨OSSO C. 2004. Effects of discharge reductions on salt wedge dynamics of the Ebro river. River Research and Applica-tions, 20: 61–77.
SINHA M, MUKHOPADHYAY MK, BAGCHI MM & KARAMKAR HC. 1996. Impact of Farraka Barrage on the hydrology and fishery of Hoo-gly estuary. Estuaries, 19(3): 710–722.
UNCLES RJ & STEPHENS JA. 1996. Salt intrusion in the Tweed Estuary. Estuarine, Coastal and Shelf Science, 43: 271–293.
VER´ISSIMO LS, MEDEIROS MF, SOUZA JF & ANDRADE FTB. 1996. Avaliac¸˜ao das potencialidades h´ıdrica e mineral do M´edio-Baixo Jagua-ribe-CE. Fortaleza, CPRM/Programa de gest˜ao e administrac¸˜ao territo-rial, 89 p.
NOTES ABOUT THE AUTHORS
Alex Costa da Silva. Undergraduate in Geology at Universidade Federal do Par´a, UFPA (2000). Doctorate degree in Physical Oceanography at Departamento de
Oceanografia of Universidade Federal de Pernambuco (DOCEAN/UFPE) with a granted scholarship at Institut de Recherche pour le D´eveloppement (IRD/Brest/France). Presently is adjunct professor at Centro de Tecnologia e Geociˆencias, Departamento de Oceanografia at Universidade Federal de Pernambuco (CTG/DOCEAN/UFPE), participating in the post-graduate program in Oceanography at UFPE. Experience in Oceanography, with emphasis in Physical Oceanography. The main subjects are: physical properties of the seawater, water masses, oceanic and coastal circulation and ocean-atmosphere interaction.
Jader Onofre de Morais. Undergraduate in Geology at Universidade Federal de Pernambuco, UFPE (1966), Master degree in Marine Earth Sciences and Doctorate
degree in Marine Geology at Faculty of Sciences, University of London. Post-Doctorate degree in Environmental Geology focusing in the Coastal Zone at Royal Holloway, University of London (1990). Presently is a full professor at Universidade Estadual do Cear´a, where was also president from 2004 till 2008. Experience on Oceanography, with emphasis in Geological Oceanography. The main subjects are: coastal and marine sedimentation, evolution of the coastal zone, environmental impact, environmental geology, and coastal management.
Luiz Drude de Lacerda. Undergraduate in Biology at Universidade Federal do Rio de Janeiro, UFRJ (1977), Master degree in Biological Sciences (Biophysics) at
Universidade Federal do Rio de Janeiro (1980) and Doctorate degree in Biological Sciences (Biophysics) at Universidade Federal do Rio de Janeiro, UFRJ (1983). Full professor at Universidade Federal Fluminense (UFF). Presently is a Professor at Universidade Federal do Cear´a (UFC) and Academic Coordinator of the Instituto de Ciˆencias do Mar of UFC. Experience in Ecology, with emphasis in Biogeochemistry and Environmental Contamination.