AMTD
8, 33–63, 2015Design and application of
a mobile ground-based
observatory
S. E. Bush et al.
Title Page
Abstract Introduction
Conclusions References
Tables Figures
◭ ◮
◭ ◮
Back Close
Full Screen / Esc
Printer-friendly Version Interactive Discussion
Discussion
P
a
per
|
Discus
sion
P
a
per
|
Discussion
P
a
per
|
Discussion
P
a
per
|
Atmos. Meas. Tech. Discuss., 8, 33–63, 2015 www.atmos-meas-tech-discuss.net/8/33/2015/ doi:10.5194/amtd-8-33-2015
© Author(s) 2015. CC Attribution 3.0 License.
This discussion paper is/has been under review for the journal Atmospheric Measurement Techniques (AMT). Please refer to the corresponding final paper in AMT if available.
Design and application of a mobile
ground-based observatory for continuous
measurements of atmospheric trace-gas
and criteria pollutant species
S. E. Bush1, F. M. Hopkins2, J. T. Randerson2, C.-T. Lai3, and J. R. Ehleringer1,4
1
Dept. of Biology, University of Utah, Salt Lake City, Utah, USA
2
Dept. of Earth System Science, University of California, Irvine, California, USA
3
Dept. of Biology, San Diego State University, San Diego, California, USA
4
Global Change and Sustainability Center, University of Utah, Salt Lake City, Utah, USA Received: 9 July 2014 – Accepted: 12 August 2014 – Published: 6 January 2015 Correspondence to: S. E. Bush ([email protected])
AMTD
8, 33–63, 2015Design and application of
a mobile ground-based
observatory
S. E. Bush et al.
Title Page
Abstract Introduction
Conclusions References
Tables Figures
◭ ◮
◭ ◮
Back Close
Full Screen / Esc
Printer-friendly Version Interactive Discussion
Discussion
P
a
per
|
Discus
sion
P
a
per
|
Discussion
P
a
per
|
Discussion
P
a
per
|
Abstract
Ground-based measurements of atmospheric trace gas species and criteria pollutants are essential for understanding emissions dynamics across space and time. Gas com-position in the surface 50 m has the greatest direct impacts on human health as well as ecosystem processes, hence data at this level is necessary for addressing carbon cycle
5
and public health related questions. However, such surface data are generally associ-ated with stationary measurement towers, where spatial representation is limited due to the high cost of establishing and maintaining an extensive network of measurement stations. We describe here a compact mobile laboratory equipped to provide high-precision, high-frequency, continuous, on-road synchronous measurements of CO2,
10
CO, CH4, H2O, NOx, O3, aerosol, meteorological, and geospatial position data. The
mobile laboratory has been deployed across the western USA. In addition to describing the vehicle and its capacity, we present data that illustrate the use of the laboratory as a powerful tool for investigating the spatial structure of urban trace gas emissions and criteria pollutants at spatial scales ranging from single streets to whole ecosystem and
15
regional scales. We identify fugitive urban CH4 emissions and assess the magnitude of CH4 emissions from known point sources. We illustrate how such a mobile
labo-ratory can be used to better understand emissions dynamics and quantify emissions ratios associated with trace gas emissions from wildfire incidents. Lastly, we discuss additional mobile laboratory applications in health and urban metabolism.
20
1 Introduction
Measurements of atmospheric trace gas species and criteria pollutants are essen-tial for quantifying regional-to-global carbon cycle questions as well as ecosystem dy-namics in both natural and urban ecosystems. There is an increasing need for high-frequency and high-resolution data at finer spatial and temporal scales across different
25
AMTD
8, 33–63, 2015Design and application of
a mobile ground-based
observatory
S. E. Bush et al.
Title Page
Abstract Introduction
Conclusions References
Tables Figures
◭ ◮
◭ ◮
Back Close
Full Screen / Esc
Printer-friendly Version Interactive Discussion
Discussion
P
a
per
|
Discus
sion
P
a
per
|
Discussion
P
a
per
|
Discussion
P
a
per
|
ground-based systems (Crosson, 2008). The primary motivation for the measurement system described here was threefold: (a) to assess spatial patterns of fossil fuel emis-sions in an urban ecosystem (e.g., CO2, CO, CH4and O3along urban to forest
ecosys-tem gradients), (b) to quantify trace gas emissions ratios from wildfires in the western USA, and (c) to provide data for regional scale modeling and data integration among
5
existing stationary measurement towers.
Urban ecosystems play an important role in the global carbon cycle and climate change due to their significant impact on the composition of the atmosphere as-sociated primarily with fossil fuel combustion. They are directly responsible for the largest net source of carbon dioxide to the atmosphere on an annual basis, and
rep-10
resent a significant net source of anthropogenic methane, although the magnitude as-sociated with contributing processes for methane from cities is far less understood (Canadell et al., 2007; IEA, 2008; Wunch et al., 2009; Dhakal, 2010; IPCC, 2013; Miller et al., 2013). Today roughly 50 % of the world’s population resides in cities; by 2050 more than 75 % of the world’s population is expected to be urban (UN, 2011).
Signif-15
icant methodological limitations and uncertainties remain with respect to the science community’s ability to quantify fossil fuel emissions from urban areas, particularly at fine spatial and temporal scales (Gurney et al., 2009, 2012).
Previous studies focused on greenhouse gas emissions from cities have included inventory, direct measurements alone or in combination with atmospheric transport
20
models or stable isotopic data, and model-based approaches. Carbon dioxide emis-sions inventories for cities have historically occurred at a coarse spatial scale, utilizing multiple methods including energy statistics and population census data, often scaled down from regional and national datasets, survey data, modeling, and in many cases are linked only to specific sectors of cities (Kennedy et al., 2009; Wunch et al., 2009;
25
AMTD
8, 33–63, 2015Design and application of
a mobile ground-based
observatory
S. E. Bush et al.
Title Page
Abstract Introduction
Conclusions References
Tables Figures
◭ ◮
◭ ◮
Back Close
Full Screen / Esc
Printer-friendly Version Interactive Discussion
Discussion
P
a
per
|
Discus
sion
P
a
per
|
Discussion
P
a
per
|
Discussion
P
a
per
|
magnitude of emissions over time and space and also in combination with stable iso-topic data to partition total emissions into component source parts (Pataki et al., 2003; Riley et al., 2008; Wunch et al., 2009; NRC, 2010; Haiduc and Beldean-Galea, 2011; Turnbull et al., 2011; Kort et al., 2012; Briber et al., 2013; Kort et al., 2013; Lietzke and Vogt, 2013; Newman et al., 2013; Schneising et al., 2013), while others have used
5
a combination of tower based measurement data and atmospheric transport models to estimate emissions (Strong et al., 2011; Brondfield et al., 2012; McKain et al., 2012; Brioude et al., 2013; Lauvaux et al., 2013; Nehrkorn et al., 2013).
The development of emissions model products with their estimates of carbon diox-ide emissions at the county scale for the coterminous US (e.g., VULCAN) (Gurney
10
et al., 2009) and the whole city scale with spatial resolution down to the individual building level (HESTIA) (Gurney et al., 2012) have not yet been tested with trace gas observations at the parcel-to-city scales. In all of these cases, it is clear that whether for integration of data between stationary tower measurement sites or collection of data to validate and/or improve current emissions model products, high resolution data linked
15
to a mobile platform would help improve our current understanding.
In addition to urban ecosystem fossil fuel emissions, emissions from wildfires rep-resent a significant source of atmospheric CO2, CO, CH4, other trace gases, and
aerosols (Yokelson et al., 2013), and are an important component of the global carbon budget. The gross flux of carbon from wildfires is approximately 2–3 Pg C per year, and
20
is highly variable on interannual timescales (van der Werf et al., 2010). Quantification of carbon emissions from wildfires involves “bottom up” inventories, remote sensing and model-based estimates at various temporal and spatial scales (Spessa et al., 2013). Emissions of other trace gases are estimated from the product of total emissions and emissions factors that define the relationship of their emissions relative to the total
25
AMTD
8, 33–63, 2015Design and application of
a mobile ground-based
observatory
S. E. Bush et al.
Title Page
Abstract Introduction
Conclusions References
Tables Figures
◭ ◮
◭ ◮
Back Close
Full Screen / Esc
Printer-friendly Version Interactive Discussion
Discussion
P
a
per
|
Discus
sion
P
a
per
|
Discussion
P
a
per
|
Discussion
P
a
per
|
Hence, estimates of total trace gas emissions from wildfires would be greatly improved by acquisition of specific emissions factor data both over time for a given geographic location and wildfire incident and across space and different biome types. Acquisition of this kind of data necessarily requires a mobile measurement platform given the stochastic nature of these events. In addition, the ability to link these measurements
5
with remotely sensed data products is a critical component for advancing the ability to assess wildfire emissions impacts at regional and global scales (Sommers et al., 2014). Several studies have described the use of mobile laboratories to provide greenhouse gas mole fraction data at high spatial and temporal resolutions. In general, the mobile facilities have focused on the acquisition of atmospheric aerosol and criteria pollutants
10
data (Bukowiecki et al., 2002; Westerdahl et al., 2005; Pirjola et al., 2009; Weimer et al., 2009; Drewnick et al., 2012) or measurement of one or more greenhouse gas species (Shorter et al., 1996; Farrell et al., 2013; Leifer et al., 2013; Phillips et al., 2013; Jackson et al., 2014). In cases where the capacity for the measurement of multiple variables exists, the facilities are typically large, oversized vans or recreational vehicle
15
platforms, designed to provide stationary (tower based) or mobile functionality, but not both (Kolb et al., 2004; Herndon et al., 2005; Moore, 2009).
Here we describe a compact mobile laboratory equipped to provide continuous, on-road, high spatial and temporal resolution CO2, CO, CH4, H2O, NOx, O3, aerosol,
mete-orological, and geospatial data. We then present data illustrating applications for which
20
this platform can be used to address carbon cycle and public health related objectives.
2 Description of mobile observatory
The mobile observatory was constructed using a compact, four cylinder, two-passenger, Ford Transit Connect van, equipped with dual sliding side doors and sym-metrical rear doors in the cargo area, and the following exterior dimensions: 2.1 m
25
AMTD
8, 33–63, 2015Design and application of
a mobile ground-based
observatory
S. E. Bush et al.
Title Page
Abstract Introduction
Conclusions References
Tables Figures
◭ ◮
◭ ◮
Back Close
Full Screen / Esc
Printer-friendly Version Interactive Discussion
Discussion
P
a
per
|
Discus
sion
P
a
per
|
Discussion
P
a
per
|
Discussion
P
a
per
|
rubber matting, and a series of infrastructural components were designed and fabri-cated to facilitate high quality atmospheric trace-gas measurements. These compo-nents included a tower instrument rack, a telescoping sampling mast for attaching trace-gas inlet plumbing, a high pressure cylinder cage, and an atmospheric flask sam-pling line (Fig. 1). The steel instrument rack (0.6 m width; 0.6 m length; 1.1 m height)
5
was fastened to both the vehicle floor and each sidewall above each sliding door for ad-ditional stability. The telescoping sampling mast (0.08 m OD base cylinder, with smaller cylinder segments extending to 0.03 m OD at the top) was constructed of 10-gauge, aerospace grade aluminum, was designed to fit inside the vehicle when fully collapsed, and extend as much as 5 m above the roof of the vehicle to provide multiple
sam-10
pling height options for both mobile and stationary tower applications. To facilitate the movement of the sampling mast into and out of the vehicle, an access hole was cut out of the roof of the vehicle and a stainless steel mounting plate with a removable threaded lid and gasket seal were installed. The resulting access opening measured 0.1 m in diameter. The sampling mast was fastened with mounting brackets to the side
15
of the instrument rack on the interior of the vehicle directly below the roof access hole. A steel cage with the capacity to secure three high-pressure, seven-liter cylinders was fabricated and fastened to the instrument rack on the side opposite the sampling mast attachment. An atmospheric flask sampling apparatus was constructed of aluminum and perforated steel plate components and attached to the rear, passenger side,
in-20
terior wall of the vehicle to facilitate collection of both 100 mL and 2 L atmospheric air samples in glass flasks sealed with Teflon stopcocks.
2.1 Trace-gas instrumentation
Two cavity ring down spectrometers for measuring trace gas species were installed on the instrument tower. One measured CO2, CO, and H2O (Picarro model G1302
25
Sunnyvale, CA) at two-second intervals and the other CO2, CH4, and H2O (Picarro
AMTD
8, 33–63, 2015Design and application of
a mobile ground-based
observatory
S. E. Bush et al.
Title Page
Abstract Introduction
Conclusions References
Tables Figures
◭ ◮
◭ ◮
Back Close
Full Screen / Esc
Printer-friendly Version Interactive Discussion
Discussion
P
a
per
|
Discus
sion
P
a
per
|
Discussion
P
a
per
|
Discussion
P
a
per
|
stream of either atmospheric air, pulled from an inlet mounted outside the vehicle on the top of the sampling mast, or from known calibration standard tanks. The inlet line consisted of 1/4 inch OD synflex tubing and was split to connect to a series of three-way valves (SS-42GXLS4, Swagelok Inc., Solon, OH) inside the vehicle to allow the user to choose whether the air sampled by the spectrometers was an atmospheric or
5
reference gas sample (Fig. 1b). Downstream of the spectrometers, the sampling line was connected to another three-way valve to control whether the sample stream is pulled by a 12 V pump or is vented to atmosphere, which was necessary during the measurement of reference gases from high-pressure gas cylinders. Two different ref-erence gases directly tied to the CMDL-NOAA network CO2, CO and CH4standards
10
were introduced into the cavity ring down spectrometer sampling streams before and after each measurement campaign in order to standard correct raw instrument data us-ing a two-point slope and intercept linear correction. A wall-mount, flat-screen monitor with touch screen capabilities was mounted to the side of the instrument rack in or-der to interface with both spectrometer instruments (ERG-45-233-200, Ergodirect, San
15
Carlos, CA) via a 4 port KVM switch (GCS1804, IOGear, Foothill Ranch, CA), which was also linked to wireless mouse and keyboard components.
In addition, atmospheric O3 and NOx instruments were installed on the instrument
rack and plumbed with independent atmospheric inlets mounted to the telescoping sampling mast (ozone model 205, nitric oxide model 410, 2B Technologies, Boulder,
20
CO; see http://www.twobtech.com/downloads_205.htm and http://www.twobtech.com/ downloads_410.htm for additional technical spec information). Both the O3 and NOx
instruments were set to output 10 s averaged data logged by an external datalogger (CR3000, Campbell Scientific, Logan, UT).
A portable atmospheric aerosol spectrometer (Model 1.109, Grimm Technologies,
25
AMTD
8, 33–63, 2015Design and application of
a mobile ground-based
observatory
S. E. Bush et al.
Title Page
Abstract Introduction
Conclusions References
Tables Figures
◭ ◮
◭ ◮
Back Close
Full Screen / Esc
Printer-friendly Version Interactive Discussion
Discussion
P
a
per
|
Discus
sion
P
a
per
|
Discussion
P
a
per
|
Discussion
P
a
per
|
the roof access hole to minimize the path length and curvature of the sampling line at-tached to the telescoping sampling mast above the roof of the vehicle. The instrument was plumbed using flexible 5 mm conductive tubing, with an isokinetic stainless steel sampling probe at the atmospheric inlet to facilitate collection of accurate aerosol mea-surements when the vehicle is in motion (1.152, Grimm Technologies, Douglasville,
5
GA; see http://vx083000.server1.viwefix.cz/domain/flox/files/01_imise-grimm/grimm_ 1.10x_lpn_de_akd_090206.pdf for additional isokinetic inlet technical spec informa-tion).
An Airmar weather station instrument (model 200WX WeatherStation, Airmar Tech-nology, Milford, NH) was installed for the collection of meteorological data. The unit
10
was mounted to the top of the telescoping sampling mast and was small enough that the sampling mast could still be easily collapsed into the vehicle without instrument re-moval. One second frequency measurements of temperature, relative humidity, baro-metric pressure, and both true and apparent wind speed and direction were logged to an external laptop using Airmar Weathercaster software.
15
A Garmin GPS instrument was mounted to the roof of the vehicle to collect geospa-tial coordinate data and was wired to interface with the Campbell Scientific CR3000 datalogger mounted inside the vehicle (GPS16X-HVS GPS Receiver, Campbell Scien-tific, Logan, UT). Geospatial position, vehicle speed, direction, and altitude were logged to the datalogger at a 5 s frequency.
20
2.2 Creating a stable instrument power supply
The electrical system was designed to provide power to instrument components from one of three electrical sources (utility line power when stationary, generator when sta-tionary, or vehicle alternator when in motion) without interruption in power supply while switching among sources. Figure 2 illustrates the major components and connectivity
25
associated with the design of this electrical system.
AMTD
8, 33–63, 2015Design and application of
a mobile ground-based
observatory
S. E. Bush et al.
Title Page
Abstract Introduction
Conclusions References
Tables Figures
◭ ◮
◭ ◮
Back Close
Full Screen / Esc
Printer-friendly Version Interactive Discussion
Discussion
P
a
per
|
Discus
sion
P
a
per
|
Discussion
P
a
per
|
Discussion
P
a
per
|
requirements of individual components. The 110 VAC power was supplied via recepta-cles mounted to the rear, left wall of the van interior, with the 12 VDC supply located just below the 110 VAC receptacle bank (Fig. 1).
The inverter-charger was a 12 V, 3000 W, pure sine-wave inverter that served a num-ber of different functions (model 12-3000IC, Newmar, Newport Beach, CA). When the
5
van was plugged in to utility power or generator power via the external power port, the inverter functioned to (1) provide AC power to the AC receptacles via an electric panel distribution box with four circuits having 20 A breaker protection (one breaker per re-ceptacle box) and (2) charge the deep-cycle battery bank and provide 12 VDC power to the 12 VDC terminals. When the van was not plugged in to utility or generator power
10
and instead, was either stationary (engine off) or in motion (driving – engine on), the inverter-charger provided 110 VAC from the 12 VDC supply associated with a deep-cycle battery bank (Figs. 1 and 2). If the van was stationary with the engine off, the inverter pulled power only from the deep cycle battery bank. If the van was in motion, a solenoid switch (54-98-002, Bargman, Plymouth, MI) located under the vehicle hood
15
provided electrical connectivity between the deep cycle battery bank in the rear of the vehicle and the vehicle starting battery. Under these conditions, the factory-installed vehicle alternator functioned to charge both the vehicle starting battery and the deep cycle battery bank. The connectivity between the vehicle starting battery and the deep cycle battery bank was provided by means of a 2O cable that entered the cab through
20
a pre-drilled electrical conduit hole under the steering wheel and was routed under the plastic running boards on the drivers’ side of the vehicle.
The battery bank consisted of two deep cycle batteries (model SRM-27, Interstate Batteries, Dallas, TX, USA), each with 160 min reserve capacity at 25 A, were wired in parallel and connected to the inverter-charger. The battery bank was located in an
25
AMTD
8, 33–63, 2015Design and application of
a mobile ground-based
observatory
S. E. Bush et al.
Title Page
Abstract Introduction
Conclusions References
Tables Figures
◭ ◮
◭ ◮
Back Close
Full Screen / Esc
Printer-friendly Version Interactive Discussion
Discussion
P
a
per
|
Discus
sion
P
a
per
|
Discussion
P
a
per
|
Discussion
P
a
per
|
In operation, with all instruments running, the total maximum power consumption was approximately 900 W. The system was operated with all instrument components running simultaneously for extended time periods, where the factory-installed alterna-tor was sufficient to sustain uninterrupted power to all system components. The vehicle was driven multiple times between northern, Utah, USA (Salt Lake City) and southern
5
California, USA (San Diego and Los Angeles), with drive duration exceeding 12 h and no power loss to any of the instrument components. In addition, the capacity of the battery bank was designed to sustain power for approximately 1 h when functioning as the sole power source for the electrical system. In practice, the maximum time pe-riod experienced in the field did not exceed 45 min, where no power interruption was
10
observed during that time.
2.3 Measurement locations
In 2012 and 2013, we utilized the mobile observatory to collect data from three geo-graphic regions in the western USA: northern Utah, southern California, and central Idaho.
15
The Utah driving transects were performed both along the Wasatch Front, a metropolitan region in the north-central part of the state with a population of approxi-mately 1.7 million, and repeatedly within the Salt Lake Valley, the largest metropolitan area of the Wasatch Front, with a population of approximately 1.2 million. Driving routes in the Salt Lake Valley were designed to capture urban to rural and elevation gradients,
20
differences in traffic features and density across the urban landscape, and emissions point source features.
The mobile observatory was also deployed to collect data associated with Idaho’s Trinity Ridge wildfire in August 2012. The Trinity Ridge Fire occurred in the Boise Na-tional Forest, approximately seven miles northwest of Featherville, Idaho, and burned
25
AMTD
8, 33–63, 2015Design and application of
a mobile ground-based
observatory
S. E. Bush et al.
Title Page
Abstract Introduction
Conclusions References
Tables Figures
◭ ◮
◭ ◮
Back Close
Full Screen / Esc
Printer-friendly Version Interactive Discussion
Discussion
P
a
per
|
Discus
sion
P
a
per
|
Discussion
P
a
per
|
Discussion
P
a
per
|
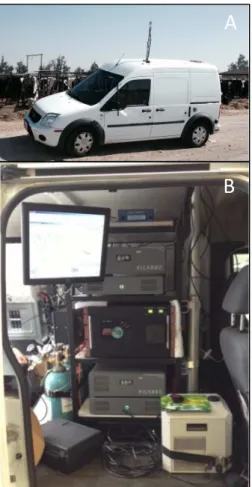
The southern California transects were performed in the broader Los Angeles Basin and greater San Diego metropolitan areas. The greater Los Angeles metropolitan area, including Los Angeles, Orange, and parts of Ventura, Riverside, and San Bernardino counties, encompasses 87 945 km2 and has a population of 18 million people. Five transects covering different parts of the region were repeated at midday and in the
5
evening during winter, spring, summer and fall of 2013. Transects were designed to span the Los Angeles Basin, to target major emission sources such as power plants, landfills, and oil refineries, and to sample different road sizes and representative land cover types. Images of the exterior and interior of the mobile observatory in field oper-ation are shown in Fig. 3.
10
2.4 Data analyses
Data streams associated with all instrument components were collected and post pro-cessed following each data collection period. Both of the Picarro trace-gas spectrom-eters were equipped with independent solid-state hard drives, where daily data files were stored. Data streams associated with GPS, O3and NOxinstruments were stored
15
using an external datalogger, and meteorological data was collected and stored with a laptop computer. Data streams were time averaged and synchronized, and stan-dard corrected where appropriate (Picarro spectrometer data streams), using Mat-lab software (Mathworks, www.mathworks.com/products/matMat-lab). Trace-gas data and geospatial data were combined to generate spatial information using ArcGIS software
20
(www.esri.com) and Google Earth. The legend scale for all map graphics was deter-mined based on natural breaks classification (Jenks optimization).
All trace-gas data presented here are shown as mole fractions above background levels (referred to here as “excess”). To calculate excess mole fractions, background monthly mean mole fractions for CO2, CO and CH4 were obtained from the NOAA
25
AMTD
8, 33–63, 2015Design and application of
a mobile ground-based
observatory
S. E. Bush et al.
Title Page
Abstract Introduction
Conclusions References
Tables Figures
◭ ◮
◭ ◮
Back Close
Full Screen / Esc
Printer-friendly Version Interactive Discussion
Discussion
P
a
per
|
Discus
sion
P
a
per
|
Discussion
P
a
per
|
Discussion
P
a
per
|
measurement values for each gas for a given season were used to estimate the back-ground (Hopkins et al., 2014).
3 Observatory applications
Here we describe the data capacity associated with the mobile observatory’s use as a tool to acquire continuous data and for investigating atmospheric research questions
5
related to both public health and the carbon cycle. We present data illustrating the spatial dynamics of atmospheric criteria pollutants along city roads, carbon dioxide dy-namics of urban regions at multiple spatial and temporal scales, methane emissions of both known and unknown point sources, and relationships between trace-gas species associated with wildfire emissions.
10
Significant fine-scale spatial structure associated with atmospheric criteria pollutants was observed in the Salt Lake Valley, with implications for health, air quality policies, and greenhouse gas emissions. Figure 4 shows carbon monoxide mole fractions col-lected along a stop-lighted highway (Bangerter Highway) in the Salt Lake Valley, Utah. The Bangerter Highway runs north-south across the valley and is parallel to the major
15
interstate highway within the valley, Interstate 15. On the Bangerter Highway the vehi-cle speed limit is 50 mph, but there are multiple intersections with stop lights. In traffi c-light controlled intersections, we continuously observed elevated CO and CO2 mole
fractions (only CO data provided for brevity); CO mole fractions routinely approached 10 ppm or greater above ambient background levels. The current EPA primary limits for
20
CO are 9 ppm measured over eight hours, and 35 ppm measured over a single hour pe-riod (EPA 2010). These transect observations suggest that individuals associated with either businesses or residences located near traffic-controlled intersections may be ex-posed to a much higher health risk, as stationary measurement sites do not provide the spatial resolution necessary to identify these patterns.
25
AMTD
8, 33–63, 2015Design and application of
a mobile ground-based
observatory
S. E. Bush et al.
Title Page
Abstract Introduction
Conclusions References
Tables Figures
◭ ◮
◭ ◮
Back Close
Full Screen / Esc
Printer-friendly Version Interactive Discussion
Discussion
P
a
per
|
Discus
sion
P
a
per
|
Discussion
P
a
per
|
Discussion
P
a
per
|
little information exists regarding the variation in magnitude, structure and spatial extent of trace-gas urban domes. Virtually all state and federal observations are from limited fixed locations. Repeated transects across Salt Lake Valley along a route designed to capture gradients in urban development, urban form, and traffic density revealed significant changes in the magnitude and pattern of emissions across the Salt Lake
5
Valley over the course of a single day as daily activities varied in predictable ways and interacted with boundary layer growth and decay (Fig. 5). We drove the same route in the morning (08:00–11:00 MST – Mountain standard time), afternoon (14:00– 17:00), and nighttime (20:00–23:00) (Fig. 5a–c, respectively) in January 2013. Here we observed elevated carbon dioxide levels varied from 18.0–787.4 ppm above the
10
average January background mole fraction measured at the NOAA baseline station in Wendover, Utah. CO2 mole fractions were highest in and surrounding downtown Salt
Lake City in the morning, with maximums decreasing in the afternoon with increases in the daytime mixed boundary layer and increasing again at night as the mixed boundary layer decreased in size. Even near the outer perimeter of the Salt Lake City urban area,
15
we observed that CO2 values varied from 18 to 40.2 ppm above background mole
fractions. These elevated values may be caused, in part, by the advection of air across the Salt Lake Valley.
The mobile observatory was also used to explore greenhouse gas emissions dy-namics at the regional scale. In a route along the Wasatch Front, a geographic region
20
with approximately 80 % of the total population of the state of Utah, there are exten-sive spaces that are either characterized as urban or non-urban agricultural (Fig. 6). Urbanized areas along this 200 km transect had excess CO2 levels that were 3.3 to 233.9 ppm. Elevated CO2 mole fractions were highest in the Cache Valley (e.g.,
Lo-gan), Ogden Valley (e.g., Ogden), Salt Lake Valley (e.g., Salt Lake City), and Utah
25
Valley (e.g., Provo), but tapered offquickly when leaving the highly urbanized zones. Consistent with CO2patterns, CO values were elevated in urban regions, but the
AMTD
8, 33–63, 2015Design and application of
a mobile ground-based
observatory
S. E. Bush et al.
Title Page
Abstract Introduction
Conclusions References
Tables Figures
◭ ◮
◭ ◮
Back Close
Full Screen / Esc
Printer-friendly Version Interactive Discussion
Discussion
P
a
per
|
Discus
sion
P
a
per
|
Discussion
P
a
per
|
Discussion
P
a
per
|
route was controlled-access highways or freeways, without intersections and traffic sig-nals impacting vehicle speed.
In addition to CO2 and CO, cities can be regions of fugitive methane emissions.
Some of the methane sources within cities include emissions associated with combus-tion processes, fugitive emissions associated with leaks from compressed natural gas
5
filling stations, underground transmission and distribution pipelines, and waste disposal including sewage treatment plants and landfills. We utilized the mobile observatory to investigate atmospheric methane dynamics in and around landfills and to detect fugi-tive methane leaks in the Salt Lake Valley urban ecosystem. We drove a transect from the east side of the valley just south of downtown Salt Lake City to the west side of the
10
valley, where the Salt Lake County landfill is located in the industrial sector of the val-ley (Fig. 7). We found methane mole fractions near background levels (approximately 1.9 ppm) along the entire transect path, with the exception of the road segment adja-cent to the landfill, and inside the landfill area, where mole fractions were nearly an or-der of magnitude greater, around 17 ppm. We were also able to detect fugitive methane
15
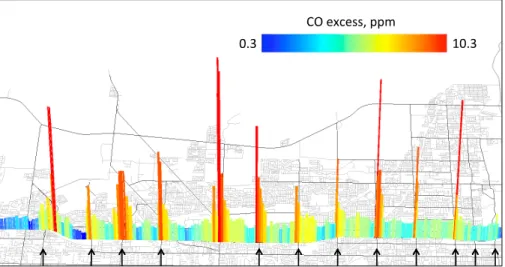
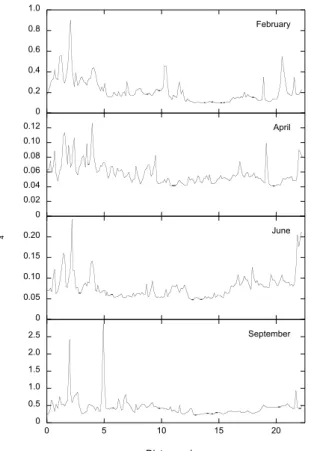
leaks across the Salt Lake Valley (Fig. 8). We found multiple locations where methane mole fractions were double the background mole fraction as well as differences in the magnitude and spatial extent of hot spot areas, with some locations associated with fairly discrete peaks of methane and others with more widespread spatial patterns of excess. Repeated measurements in Los Angeles of the same roadway across
sea-20
sons indicated that methane hotspots/leaks tended to reoccur in the same locations over time (Fig. 9).
The mobile observatory was used to measure trace-gas emissions from the Trinity Ridge wildfire that burned in the Boise National Forest of Idaho in the late summer of 2012. Figure 10 shows a transect driven on 29 August starting from the junction of Sun
25
AMTD
8, 33–63, 2015Design and application of
a mobile ground-based
observatory
S. E. Bush et al.
Title Page
Abstract Introduction
Conclusions References
Tables Figures
◭ ◮
◭ ◮
Back Close
Full Screen / Esc
Printer-friendly Version Interactive Discussion
Discussion
P
a
per
|
Discus
sion
P
a
per
|
Discussion
P
a
per
|
Discussion
P
a
per
|
during the previous nighttime period and characterized by very low visibility (Fig. 10). Mole fractions of CO2, CO and CH4 were significantly elevated to greater than 60.0,
6.0, and 0.8 ppm above background mole fractions, respectively (Fig. 10). We observed that the ratios of CO excess to CO2excess and CH4excess to CO2excess ranged from 0.009 to 4.8 and 0.001 to 0.8, respectively. However, both ratios were very stable during
5
sampling of the emissions layer, with ranges from 0.10 to 0.12 and 0.009 to 0.01 and average values of 0.1±0.0009 and 0.01±0.0002 for CO : CO2and CH4: CO2excess,
respectively.
4 Future directions and opportunities
Here we have presented some examples that highlight the utility of the mobile platform
10
for addressing carbon cycle and public health related questions. However, there are many additional applications for which this mobile laboratory would prove useful. In particular, this observatory is well suited for providing high spatial and temporal resolu-tion measurements to link with current emissions model products (e.g., Hestia) (Gurney et al., 2012) for validation, improvement, and further product development. This
obser-15
vatory also provides a cost effective mechanism to collect data between different per-manent measurement stations to integrate measurements across space and time and also provide vital in situ data required for modeling the trajectory, dispersion and chem-ical composition of the atmosphere from discreet plume events to patterns at larger spatial scales for both stochasitic events and anthropogenic emissions across different
20
geographic areas (Fleming et al., 2012). Indeed, no other atmospheric measurement technique can combine measurements of point source emitters and well-mixed air at the regional scale with the ease of administrative effort required for on-road measure-ment, which contrasts to permissions required for airborne measurement campaigns.
The design of the vehicle, e.g., the standard instrument rack and power capabilities,
25
AMTD
8, 33–63, 2015Design and application of
a mobile ground-based
observatory
S. E. Bush et al.
Title Page
Abstract Introduction
Conclusions References
Tables Figures
◭ ◮
◭ ◮
Back Close
Full Screen / Esc
Printer-friendly Version Interactive Discussion
Discussion
P
a
per
|
Discus
sion
P
a
per
|
Discussion
P
a
per
|
Discussion
P
a
per
|
vehicle in June 2013 for attribution of methane leaks in Los Angeles (Hopkins et al., 2014). In addition, recent studies linking CO2mole fraction with criteria pollutants and
air pollution mortality (Jacobson, 2008, 2010) call for a more in depth examination of the correlation between criteria pollutants and also their relationship to CO2 across different urban sectors.
5
Lastly, the mobile observatory described here represents a great outreach oppor-tunity. Because of its compact size and system design, it provides a great model for deployment to both primary and secondary schools, as a tool for use in combination with higher education courses, and for educating the general public and policy mak-ers. Such outreach activity is critical for providing the education necessary for better
10
understanding of how human activity and associated fossil fuel combustion impact the atmosphere at across multiple spatial and temporal scales, but is also necessary for providing the basis for making informed policy decisions and provides a mechanism to monitor and enforce greenhouse gas emissions and air quality regulations in the future.
Acknowledgements. The funding for the development and construction of the mobile
labora-15
tory, subsequent data collection and analyses was provided by the US Dept. of Energy Office of Science Biological and Environmental Research (BER) division.
References
Briber, B. M., Hutyra, L. R., Dunn, A. L., Raciti, S. M., and Munger, J. W.: Variations in atmo-spheric CO2mixing ratios across a Boston, MA urban to rural gradient, Land, 2, 304–327,
20
2013.
Brioude, J., Angevine, W. M., Ahmadov, R., Kim, S.-W., Evan, S., McKeen, S. A., Hsie, E.-Y., Frost, G. J., Neuman, J. A., Pollack, I. B., Peischl, J., Ryerson, T. B., Holloway, J., Brown, S. S., Nowak, J. B., Roberts, J. M., Wofsy, S. C., Santoni, G. W., Oda, T., and Trainer, M.: Top-down estimate of surface flux in the Los Angeles Basin using a mesoscale
25
AMTD
8, 33–63, 2015Design and application of
a mobile ground-based
observatory
S. E. Bush et al.
Title Page
Abstract Introduction
Conclusions References
Tables Figures
◭ ◮
◭ ◮
Back Close
Full Screen / Esc
Printer-friendly Version Interactive Discussion
Discussion
P
a
per
|
Discus
sion
P
a
per
|
Discussion
P
a
per
|
Discussion
P
a
per
|
Brondfield, M. N., Hutyra, L. R., Gately, C. K., Raciti, S. M., and Peterson, S. A.: Modeling and validation of on-road CO2emissions inventories at the urban regional scale, Environ. Pollut., 170, 113–123, 2012.
Bukowiecki, N., Dommen, J., Prevot, A. S. H., Richter, R., Weingartner, E., and Bal-tensperger, U.: A mobile pollutant measurement laboratory – measuring gas phase and
5
aerosol ambient concentrations with high spatial and temporal resolution, Atmos. Environ., 36, 5569–5579, 2002.
Canadell, J. G., Le Quere, C., Raupach, M. R., Field, C. B., Buitenhuis, E. T., Ciais, P., Con-way, T. J., Gillett, N. P., Houghton, R. A., and Marland, G.: Contributions to accelerating atmospheric CO2 growth from economic activity, carbon intensity, and efficiency of natural
10
sinks, P. Natl. Acad. Sci. USA, 104, 18866–18870, 2007.
Crosson, E. R.: A cavity ring-down analyzer for measuring atmospheric levels of methane, carbon dioxide, and water vapor, Appl. Phys. B, 92, 403–408, 2008.
Dhakal, S.: GHG emissions from urbanization and opportunities from urban carbon mitigation, Current Opinion in Environmental Sustainability, 2, 277–283, 2010.
15
Drewnick, F., Böttger, T., von der Weiden-Reinmüller, S.-L., Zorn, S. R., Klimach, T., Schnei-der, J., and Borrmann, S.: Design of a mobile aerosol research laboratory and data pro-cessing tools for effective stationary and mobile field measurements, Atmos. Meas. Tech., 5, 1443–1457, doi:10.5194/amt-5-1443-2012, 2012.
EPA: Policy Assessment for the Review of the Carbon Monoxide National Ambient Air Quality
20
Standards, United States Environmental Protection Agency, 2010.
Farrell, P., Culling, D., and Leifer, I.: Transcontinental methane measurements: Part 1. A mobile surface platform for source investigations, Atmos. Environ., 74, 422–431, 2013.
Fleming, Z. L., Monks, P. S., and Manning, A. J.: Review: untangling the influence of air-mass history in interpreting observed atmospheric composition, Atmos. Res., 104–105, 1–39,
25
2012.
Gurney, K. R., Mendoza, D. L., Zhou, Y., Fischer, M. L., Miller, C. C., Geethakumar, S., and de la Rue du Can, S.: High resolution fossil fuel combustion CO2emission fluxes for the United States, Environ. Sci. Technol., 43, 5535–5541, 2009.
Gurney, K. R., Razlivanov, I., Song, Y., Zhou, Y., Benes, B., and Abdul-Massih, M.:
Quantifica-30
AMTD
8, 33–63, 2015Design and application of
a mobile ground-based
observatory
S. E. Bush et al.
Title Page
Abstract Introduction
Conclusions References
Tables Figures
◭ ◮
◭ ◮
Back Close
Full Screen / Esc
Printer-friendly Version Interactive Discussion
Discussion
P
a
per
|
Discus
sion
P
a
per
|
Discussion
P
a
per
|
Discussion
P
a
per
|
Haiduc, I. and Beldean-Galea, M. S.: Variation of greenhouse gases in urban areas-case study: CO2, CO and CH4 in three Romanian cities, Intech ISBN 978-953-307-307-1, doi:10.5772/17985, 2011.
Herndon, S. C., Jayne, J. T., Zahniser, M. S., Worsnop, D. R., Knighton, B., Alwine, E., Lamb, B. K., Zavala, M., Nelson, D. D., McManus, J. B., Shorter, J. H., Canagaratna, M. R.,
5
Onasch, T. B., and Kolb, C. E.: Characterization of urban pollutant emission fluxes and ambi-ent concambi-entration distributions using a mobile laboratory with rapid response instrumambi-entation, Faraday Discuss., 130, 327–339, 2005.
Hopkins, F. M., Kort, E. A., Bush, S. E., Ehleringer, J. R., Lai, C.-T., Blake, D. R., and Randerson, J. T.: Spatial patterns and source attribution of urban methane in the Los Angeles Basin, J.
10
Geophys. Res.-Atmos., in review, 2014.
IEA: World Energy Outlook, OECD/IEA Organization for economic cooperation and develop-ment/International Energy Agency, 2008.
IPCC: Climate Change 2013: The Physical Science Basis, Intergovernmental Panel on Climate Change, Cambridge University Press, 2013.
15
Jackson, R. B., Down, A., Phillips, N. G., Ackley, R. C., Cook, C. W., Plata, D. L., and Zhao, K.: Natural gas pipeline leaks across Washington DC, Environ. Sci. Technol., 48, 2051–2058, 2014.
Jacobson, M. Z.: On the causal link between carbon dioxide and air pollution mortality, Geo-phys. Res. Lett., 35, L03809, doi:10.1029/2007GL031101, 2008.
20
Jacobson, M. Z.: Enhancement of local air pollution by urban CO2domes, Environ. Sci. Tech-nol., 44, 2497–2502, 2010.
Kennedy, C. A., Ramaswami, A., Carney, S., and Dhakal, S.: Greenhouse gas emission base-lines for global cities and metropolitan regions, Cities and Climate Change: Responding to an Urgent Agenda, 15–54, doi:10.1596/9780821384930_CH02, 2011.
25
Kolb, C. E., Herndon, S. C., McManus, J. B., Shorter, J. H., Zahniser, M. S., Nelson, D. D., Jayne, J. T., Canagaratna, M. R., and Worsnop, D. R.: Mobile laboratory with rapid response instruments for real-time measurements of urban and regional trace gas and particulate distributions and emissions source characteristics, Environ. Sci. Technol., 38, 5694–5703, 2004.
30
AMTD
8, 33–63, 2015Design and application of
a mobile ground-based
observatory
S. E. Bush et al.
Title Page
Abstract Introduction
Conclusions References
Tables Figures
◭ ◮
◭ ◮
Back Close
Full Screen / Esc
Printer-friendly Version Interactive Discussion
Discussion
P
a
per
|
Discus
sion
P
a
per
|
Discussion
P
a
per
|
Discussion
P
a
per
|
Kort, E. A., Angevine, W. M., Duren, R., and Miller, C. E.: Surface observations for monitoring urban fossil fuel CO2 emissions: minimum site location requirements for the Los Angeles megacity, J. Geophys. Res.-Atmos., 118, 1–8, 2013.
Lauvaux, T., Miles, N. L., Richarson, S. J., Deng, A., Stauffer, D. R., Davis, K., Jacobson, G., Rella, C., Calonder, G.-P., and DeCola, P. L.: Urban emissions of CO2from Davos,
Switzer-5
land: the first real-time monitoring system using an atmospheric inversion technique, J. Appl. Meteorol. Clim., 52, 2654–2668, doi:10.1175/JAMC-D-13-038.1, 2013.
Leifer, I., Culling, D., Schneising, O., Farrell, P., Buchwitz, M., and Burrows, J. P.: Transconti-nental methane measurements: Part 2. Mobile surface investigation of fossil fuel industrial fugitive emissions, Atmos. Environ., 74, 432–441, 2013.
10
Lietzke, B. and Vogt, R.: Variability of CO2 concentrations and fluxes in and above an urban street canyon, Atmos. Environ., 74, 60–72, 2013.
McKain, K., Wofsy, S. C., Nehrkorn, T., Eluszkiewicz, J., Ehleringer, J. R., and Stephens, B. B.: Assessment of ground-based atmospheric observations fro verification of greenhouse gas emissions from an urban region, P. Natl. Acad. Sci. USA, 109, 8423–8428, 2012.
15
Miller, S. M., Wofsy, S. C., Michalak, A. M., Kort, E. A., Andrews, A. E., Biraud, S. C., Dlu-gokencky, E. J., Eluszkiewicz, J., Fischer, M. L., Janssens-Maenhout, G., Miller, B. R., Miller, J. B., Montzka, S. A., Nehrkorn, T., and Sweeney, C.: Anthropogenic emissons of methane in the United States, P. Natl. Acad. Sci. USA, 110, 20018–20022, 2013.
Moore, T. O.: Application of a Mobile Flux Lab for the Atmospheric Measurement of Emissions
20
(FLAME), Virginia Polytechnic Institute and State University, Blacksburg, Virginia, 2009. Nehrkorn, T., Henderson, J., Leidner, M., Mountain, M., and Eluszkiewicz, J.: WRF simulations
of the urban circulation in the Salt Lake City area for CO2modeling, J. Appl. Meteorol. Clim., 52, 323–340, 2013.
Newman, S., Jeong, S., Fischer, M. L., Xu, X., Haman, C. L., Lefer, B., Alvarez, S.,
Rap-25
penglueck, B., Kort, E. A., Andrews, A. E., Peischl, J., Gurney, K. R., Miller, C. E., and Yung, Y. L.: Diurnal tracking of anthropogenic CO2 emissions in the Los Angeles basin megacity during spring 2010, Atmos. Chem. Phys., 13, 4359–4372, doi:10.5194/acp-13-4359-2013, 2013.
NRC: Verifying Greenhouse Gas Emissions: Methods to Support International Climate
Agree-30
AMTD
8, 33–63, 2015Design and application of
a mobile ground-based
observatory
S. E. Bush et al.
Title Page
Abstract Introduction
Conclusions References
Tables Figures
◭ ◮
◭ ◮
Back Close
Full Screen / Esc
Printer-friendly Version Interactive Discussion
Discussion
P
a
per
|
Discus
sion
P
a
per
|
Discussion
P
a
per
|
Discussion
P
a
per
|
Pataki, D. E., Bowling, D. R., and Ehleringer, J. R.: Seasonal cycle of carbon dioxide and its iso-topic composition in an urban atmosphere: anthropogenic and biogenic effects, J. Geophys. Res., 108, 4735, doi:10.1029/2003JD003865, 2003.
Phillips, N. G., Ackley, R. C., Crosson, E. R., Down, A., Hutyra, L. R., Brondfield, M., Karr, J. D., Zhao, K., and Jackson, R. B.: Mapping urban pipeline leaks: methane leaks across Boston,
5
Environ. Pollut., 173, 1–4, 2013.
Pirjola, L., Kupiainen, K. J., Perhoniemi, P., Tervahattu, H., and Vesala, H.: Non-exhaust mea-surement system of the mobile laboratory SNIFFER, Atmos. Environ., 43, 4703–4713, 2009. Riley, W. J., Hsueh, D. Y., Randerson, J. T., Fischer, M. L., Hatch, J. G., Pataki, D. E., Wang, W.,
and Goulden, M. L.: Where do fossil fuel carbon dioxide emissions from California go? An
10
analysis based on radiocarbon observations and an atmospheric transport model, J. Geo-phys. Res.-Biogeo., 113, G04002, doi:10.1029/2007JG000625, 2008.
Schneising, O., Heymann, J., Buchwitz, M., Reuter, M., Bovensmann, H., and Burrows, J. P.: Anthropogenic carbon dioxide source areas observed from space: assessment of regional enhancements and trends, Atmos. Chem. Phys., 13, 2445–2454,
doi:10.5194/acp-13-2445-15
2013, 2013.
Shorter, J. H., McManus, J. B., Kolb, C. E., Allwine, E. J., Lamb, B. K., Mosher, B. W., Har-riss, R. C., Partchatka, U., Fischer, H., Harris, G. W., Crutzen, P. J., and Karbach, H.-J.: Methane emission measurements in urban areas in Eastern Germany, J. Atmos. Chem., 24, 121–140, 1996.
20
Sommers, W. T., Loehman, R. A., and Hardy, C. C.: Wildland fire emissions, carbon, and cli-mate: science overview and knowledge needs, Forest Ecol. Manag., 317, 1–8, 2014. Spessa, A., van der Werf, G., Thonicke, K., Dans, J. G., Lehsten, V., Fisher, R., and Forrest, M.:
Modeling Vegetation Fires and Fire Emissions, Kessel Publishing House, 2013.
Strong, C., Stwerka, C., Bowling, D. R., Stephens, B. B., and Ehleringer, J. R.: Urban carbon
25
dioxide cycles within the Salt Lake Valley: a multiple-box model validated by observations, J. Geophys. Res., 116, D15307, doi:10.1029/2011JD015693, 2011.
Turnbull, J. C., Karion, A., Fischer, M. L., Faloona, I., Guilderson, T., Lehman, S. J., Miller, B. R., Miller, J. B., Montzka, S., Sherwood, T., Saripalli, S., Sweeney, C., and Tans, P. P.: Assess-ment of fossil fuel carbon dioxide and other anthropogenic trace gas emissions from airborne
30
AMTD
8, 33–63, 2015Design and application of
a mobile ground-based
observatory
S. E. Bush et al.
Title Page
Abstract Introduction
Conclusions References
Tables Figures
◭ ◮
◭ ◮
Back Close
Full Screen / Esc
Printer-friendly Version Interactive Discussion
Discussion
P
a
per
|
Discus
sion
P
a
per
|
Discussion
P
a
per
|
Discussion
P
a
per
|
UN: World Urbanization Prospects, United Nations, Department of Economic and Social Affairs, 2011.
van der Werf, G. R., Randerson, J. T., Giglio, L., Collatz, G. J., Mu, M., Kasibhatla, P. S., Mor-ton, D. C., DeFries, R. S., Jin, Y., and van Leeuwen, T. T.: Global fire emissions and the contribution of deforestation, savanna, forest, agricultural, and peat fires (1997–2009),
At-5
mos. Chem. Phys., 10, 11707–11735, doi:10.5194/acp-10-11707-2010, 2010.
van Leeuwen, T. T. and van der Werf, G. R.: Spatial and temporal variability in the ratio of trace gases emitted from biomass burning, Atmos. Chem. Phys., 11, 3611–3629, doi:10.5194/acp-11-3611-2011, 2011.
Weimer, S., Mohr, C., Richter, R., Keller, J., Mohr, M., Prevot, A. S. H., and Baltensperger, U.:
10
Mobile measurements of aerosol number and volume size distributions in an Alpine valley: influence of traffic vs. wood burning, Atmos. Environ., 43, 624–630, 2009.
Westerdahl, D., Fruin, S., Sax, T., Fine, P. M., and Sioutas, C.: Mobile platform measurements of ultrafine particles and associated pollutant concentrations on freeways and residential streets in Los Angeles, Atmos. Environ., 39, 3597–3610, 2005.
15
Wunch, D., Wennberg, P. O., Toon, G. C., Keppel-Aleks, G., and Yavin, Y. G.: Emissions of greenhouse gases from a North American megacity, Geophys. Res. Lett., 36, L15810, doi:10.1029/2009GL039825, 2009.
Yokelson, R. J., Burling, I. R., Gilman, J. B., Warneke, C., Stockwell, C. E., de Gouw, J., Akagi, S. K., Urbanski, S. P., Veres, P., Roberts, J. M., Kuster, W. C., Reardon, J.,
Grif-20
AMTD
8, 33–63, 2015Design and application of
a mobile ground-based
observatory
S. E. Bush et al.
Title Page
Abstract Introduction
Conclusions References
Tables Figures
◭ ◮
◭ ◮
Back Close
Full Screen / Esc
Printer-friendly Version Interactive Discussion
Discussion
P
a
per
|
Discus
sion
P
a
per
|
Discussion
P
a
per
|
Discussion
P
a
per
|
Van roof
Stainless steel marine deck plate Sampling inlet
Telescoping 10-gauge aluminum Airmar weather station
3000 W inverter-charger
Electric panel
Deep cycle battery bank
Instrument tower
Vent to atmosphere
GPS
V1 V2 V3 V4 Datalogger Flat-, touch-screen mounted monitor
A A
B B
Driver and passenger seating area Instrument display
110 VAC
12 V
Figure 1.Schematic of mobile laboratory components and orientation. The viewing angle is
AMTD
8, 33–63, 2015Design and application of
a mobile ground-based
observatory
S. E. Bush et al.
Title Page
Abstract Introduction
Conclusions References
Tables Figures
◭ ◮
◭ ◮
Back Close
Full Screen / Esc
Printer-friendly Version Interactive Discussion
Discussion
P
a
per
|
Discus
sion
P
a
per
|
Discussion
P
a
per
|
Discussion
P
a
per
|
alternator
vehicle battery
deep cycle batteries (2)
inverter-charger
power center circuit breakers/ surge protection
AC power recepticles external 110
VAC
3 terminal battery isolator
generator electronic start and
trailer mounted 12 VDC supply
AMTD
8, 33–63, 2015Design and application of
a mobile ground-based
observatory
S. E. Bush et al.
Title Page
Abstract Introduction
Conclusions References
Tables Figures
◭ ◮
◭ ◮
Back Close
Full Screen / Esc
Printer-friendly Version Interactive Discussion
Discussion
P
a
per
|
Discus
sion
P
a
per
|
Discussion
P
a
per
|
Discussion
P
a
per
|
!"
#"
AMTD
8, 33–63, 2015Design and application of
a mobile ground-based
observatory
S. E. Bush et al.
Title Page
Abstract Introduction
Conclusions References
Tables Figures
◭ ◮
◭ ◮
Back Close
Full Screen / Esc
Printer-friendly Version Interactive Discussion
Discussion
P
a
per
|
Discus
sion
P
a
per
|
Discussion
P
a
per
|
Discussion
P
a
per
|
!"#$%&$''(#))*#
+,-# .+,-#
Figure 4.The CO mole fraction along a north-south segment of Bangerter Highway in Salt
AMTD
8, 33–63, 2015Design and application of
a mobile ground-based
observatory
S. E. Bush et al.
Title Page
Abstract Introduction
Conclusions References
Tables Figures
◭ ◮
◭ ◮
Back Close
Full Screen / Esc
Printer-friendly Version Interactive Discussion
Discussion
P
a
per
|
Discus
sion
P
a
per
|
Discussion
P
a
per
|
Discussion
P
a
per
|
a
b
c
N Salt Lake Valley, January 4, 2013
CO2 excess, ppm
18.0 787.4
28.1 308.9
40.2 324.2
AMTD
8, 33–63, 2015Design and application of
a mobile ground-based
observatory
S. E. Bush et al.
Title Page
Abstract Introduction
Conclusions References
Tables Figures
◭ ◮
◭ ◮
Back Close
Full Screen / Esc
Printer-friendly Version Interactive Discussion
Discussion
P
a
per
|
Discus
sion
P
a
per
|
Discussion
P
a
per
|
Discussion
P
a
per
|
Salt Lake Valley, January 4, 2013
CH4 excess, ppm N
0.1 2.9
AMTD
8, 33–63, 2015Design and application of
a mobile ground-based
observatory
S. E. Bush et al.
Title Page
Abstract Introduction
Conclusions References
Tables Figures
◭ ◮
◭ ◮
Back Close
Full Screen / Esc
Printer-friendly Version Interactive Discussion
Discussion
P
a
per
|
Discus
sion
P
a
per
|
Discussion
P
a
per
|
Discussion
P
a
per
|
0 0.05 0.10 0.15
0.20 June
0 0.02 0.04 0.06 0.08 0.10
0.12 April
0 0.5 1.0 1.5 2.0 2.5
0 5 10 15 20
September 0
0.2 0.4 0.6 0.8 1.0
February
Distance, km
CH
4
e
xce
ss,
p
p
m
AMTD
8, 33–63, 2015Design and application of
a mobile ground-based
observatory
S. E. Bush et al.
Title Page Abstract Introduction Conclusions References Tables Figures ◭ ◮ ◭ ◮ Back Close
Full Screen / Esc
Printer-friendly Version Interactive Discussion Discussion P a per | Discus sion P a per | Discussion P a per | Discussion P a per | 0 0.2 0.4 0.6 0.8 1 0 0.1 0.2 0.3 0.4 0 2 4 6 0 0.02 0.04 0.06
0 10 20 30 40
0 20 40 60 80 100 CO 2 e xce ss, p p m C O e xce ss, p p m CH 4 e xce ss, p p m CO:CO 2 e xce ss CH 4 :CO 2 e xce ss Distance, km
Figure 10. CO2, CO, and CH4 mole fractions and the ratio of CO, and CH4 to CO2