Ana Isabel Machado Mouquinho
Graduation in Chemistry
Selective synthesis under Microwave
Irradiation of New Monomers for potential
applications in PDLC films
Dissertation to obtain the degree of master in Bioorganic
Supervisor: Prof.Dr. João Carlos da Silva Barbosa Sotomayor
(assistant professor, FCT/UNL)
President: Prof. Dr. Paula Cristina de Sério Branco
Examiner: Prof. Dr. Maria Madalena Alves Campos de Sousa Dionísio de Andrade Dr. Ana Maria Madeira Martins Faísca Phillips
Jury: Prof. Dr. João Carlos da Silva Barbosa Sotomayor
Ana Isabel Machado Mouquinho
Graduation in Chemistry
Selective synthesis under Microwave
Irradiation of New Monomers for potential
applications in PDLC films
Dissertation to obtain the degree of master in Bioorganic
Supervisor: Prof. Dr. João Carlos da Silva Barbosa Sotomayor
(FCT/UNL)
“Selective synthesis under Microwave
Irradiation of New Monomers for potential
applications in PDLC films”
Copyright, Ana Isabel Machado Mouquinho, FCT/UNL, UNL
Indicação dos direitos de cópia
A Faculdade de Ciências e Tecnologia e a Universidade Nova de Lisboa têm o direito, perpétuo e sem limites geográficos, de arquivar e publicar esta dissertação através de exemplares impressos reproduzidos em papel ou de forma digital, ou por qualquer outro meio conhecido ou que venha a ser inventado, e de a divulgar através de repositórios científicos e de admitir a sua cópia e distribuição com objectivos educacionais ou de investigação, não comerciais, desde que seja dado crédito ao autor e editor.
Copyright
Acknowledgements
I would like to thank to my supervisor Professor João Sotomayor for his guidance, knowledge and support. Special thanks to the confidence placed in me and freedom of decision.
I also wish to thank and express my appreciation to Professor Teresa Barros for all her contribution to this work, for her insistence, her knowledge and encouragement.
I want to thank all the elements associated with this project, Krasimira Petrova, Alexandre Maiau and Mara Saavedra for all their immense contribution to the results presented in this thesis. For all the difficulties and successes and for their friendship.
I must also thank to the colleagues of laboratory 3.15, 3.16 and 4.15 of the Chemistry Department of FCT/UNL. I am sincerely grateful to all.
I want to thank to the analysis laboratory of the Chemistry Department of FCT/UNL and especially to Carla Rodrigues and Maria do Rosário for technical support of DSC and NMR, respectively.
I want to thank to Professor Ana Isabel Ricardo for the opportunity and to Mara Silva for the technical support to use of GPC.
I would like to thank to Fundação para a Ciência e Tecnologia for the financial support through Project PTDC/CTM/69145/2006
I wish to thank to my mother, father, brother, sister in law and niece for all their love and support.
Abstract
Polymer dispersed liquid crystal (PDLC) films consist, commonly, on nematic liquid crystal domains dispersed in a polymeric matrix. These composites can be switched electrically from an opaque scattering state to a highly transparent state by an applied electric field. The molecular structure of the polymerisable monomers that can be incorporated as polymeric matrix plays an important role in the performance of PDLCs. Therefore, the aims of this work were to design and synthesise several new monomers that could be polymerised photochemically and thermally to be incorporated as polymeric matrices in PDLCs and investigate the influence of the molecular structure on the performance of these devices. Several monomers were synthesised in order to achieve better miscibility between the liquid crystal and the monomers during preparation of PDLC films. For this purpose, the monomers were synthesised so as to mimic some structural elements of the E7 liquid crystal molecules. Thus, several aromatic mono- and dimethacrylates with and without a linear chain spacer with five methylene units, as well as vinylic monomers were successfully synthesised. Mild and solvent free- procedures were developed with reaction times as short as 1 to 5 min, using microwave irradiation. The structures of all isolated monomers were supported by 1H NMR, 13C NMR and FTIR spectroscopy, elemental analysis and melting point. Of all the synthesised monomers, the monomers that included in their structure aromatic rings bearing a cyano group and/or a linear chain spacer with five methylene units were fully characterised due to their higher molecular structure affinity with the E7 liquid crystal molecules. In order to evaluate the effect of these groups, these monomers were compared with those of similar structure but without the respective groups. Thus, DSC and POM with temperature ramps were used for the thermal characterisation of the monomers. The structural morphologies of the polymeric matrices were characterised by SEM. The monomers were also copolymerised with glycidyl methacrylate and the molecular weights of the resulting polymers were evaluated by GPC. The electro-optical properties of the PDLC films were determined by measuring the voltage dependence on the transmitted light.
Resumo
Filmes de cristal líquido disperso num polímero (PDLC) consistem geralmente em domínios de um cristal líquido nemático disperso numa matriz polimérica. Estes compósitos podem ser comutados electricamente de um estado opaco para um estado transparente pela aplicação de um campo eléctrico. A estrutura molecular dos monómeros que constituem a matriz polimérica desempenha um papel importante no desempenho dos PDLCs. Assim, o principal objectivo deste trabalho é sintetizar uma série de monómeros fotoquimicamente e termicamente polimerizáveis de modo a serem incorporados como matriz polimérica em PDLCs e investigar o efeito da estrutura química dos monómeros no desempenho dos respectivos dispositivos. Vários monómeros novos foram sintetizados e concebidos de modo a permitirem uma melhor miscibilidade entre o cristal líquido e o monómero na preparação dos filmes de PDLC. Assim, os monómeros sintetizados foram desenhados com uma estrutura molecular próxima à estrutura das moléculas de cristal líquido, E7. Com este propósito foram sintetizados com sucesso monómeros aromáticos, mono- e di-metacrilatos com e sem uma cadeia linear de cinco unidades de metileno (espaçador) assim como monómeros vinílicos. Para a síntese dos mesmos, foram desenvolvidos procedimentos sem recurso ou com recurso a quantidades mínimas de solvente e com tempos de reacção entre 1 a 5 minutos através de radiação por micro-ondas. A estrutura molecular de todos os monómeros isolados foi comprovada por espectroscopia de 1H RMN,
13
C RMN e de FTIR, análise elementar e ponto de fusão. De entre os monómeros sintetizados existe um grupo que foi amplamente caracterizado devido à maior afinidade estrutural com as moléculas do cristal líquido E7. Estes monómeros incluem na sua estrutura molecular o grupo ciano ligado ao sistema aromático e/ou uma cadeia linear (espaçador). De modo a avaliar o efeito destes grupos, estes monómeros foram comparados com os de estrutura semelhante mas sem os respectivos grupos. Assim, estes monómeros foram termicamente caracterizados por DSC e POM com rampas de aquecimento. As morfologias da matriz polimérica foram caracterizadas por SEM. Os monómeros foram também co-polimerizados com metacrilato de glicidilo e o peso molecular dos respectivos polímeros foi determinado por GPC. As propriedades electro-ópticas dos filmes de PDLC produzidos foram estudadas através da sua resposta electro-óptica pela aplicação de um campo eléctrico.
General Index
Acknowledgements ... IX Abstract ... XI Resumo ... XIII General Index ... XV Figure Index ... XVII Table Index ... XXI Symbols and Abbreviations... XXIII
Chapter I
1 Introduction ... 1
1.1 Liquid Crystals ... 1
1.1.1 Lyotropic liquid crystals ... 1
1.1.2 Thermotropic liquid crystals ... 2
1.2 Liquid crystal properties ... 4
1.3 The nematic Liquid Crystal mixture E7 ... 7
1.4 Polymer Dispersed Liquid Crystals ... 8
1.5 Free radical polymerisation ... 8
1.6 Microstructure of the polymer network ... 11
1.7 PDLC films transmittance ... 13
1.7.1 Electro-optical properties of PDLCs ... 14
1.8 Parameters that influence the performance of PDLC films ... 16
1.8.1 Polymeric conditions ... 17
1.8.2 Molecular structure of polymerisable monomers ... 17
1.9 Applications ... 18
Chapter II 2 Materials and Methods ... 19
2.1
Outline ... 19
2.2
Materials ... 19
2.2.1
Nematic liquid crystal E7 ... 19
2.2.2
Initiators of polymerisation ... 19
2.2.3
Indium tin oxide cells ... 20
2.3
Methods ... 21
2.3.1
Microwave Irradiation ... 21
2.3.2
Characterisation of compounds synthesised ... 23
2.3.3
Preparation of PDLC films by the PIPS method ... 23
2.3.3.1
Photochemical polymerisation ... 24
2.3.3.2
Thermal polymerisation ... 24
2.3.4
Gel permeation chromatography ... 24
2.3.5
Scanning Electron Microscopy (SEM) ... 26
2.3.6
Differential scanning calorimetry (DSC) ... 26
2.3.7
Polarised optical microscopy ... 28
2.3.8
Electro-optical properties ... 29
Chapter III 3 Synthesis and Characterisation ... 31
3.3 Synthesis of methacrylate monomers ... 33
3.3.1 Monomers without a linear chain spacer with five methacrylate units ... 33
3.3.1.1 Experimental method used for monomethacrylate monomers ... 33
3.3.1.2 Experimental method used for dimethacrylate monomers ... 34
3.3.2 Synthesis of aromatic compounds bearing an alkyl bromide chain (precursors) ... 35
3.3.2.1 Experimental method used for monobromide precursors ... 36
3.3.2.2 Experimental method used for dibrominated precursors... 36
3.3.3 Monomers bearing a linear chain spacer with five methylene units (19-24) ... 37
3.3.3.1 Experimental method used for monomethacrylate monomers (19-22) ... 37
3.3.3.2 Experimental method used for dimethacrylate monomers (23-24) ... 38
3.3.4 Synthesis of vinylic monomers (25-26) ... 39
3.3.4.1 Experimental method used for vinylic monomers ... 39
3.4 Characterisation ... 40
3.4.1 Monomethacrylate monomers without spacer ... 40
3.4.2 Dimethacrylated monomers without spacer ... 44
3.4.3 Aromatic compounds bearing an alkyl monobromide chain (precursors) ... 46
3.4.4 Aromatic compounds bearing an alkyl dibromide chain (precursors) ... 48
3.4.5 Monomethacrylate monomers bearing a linear chain spacer with five methylene units 49 3.4.6 Dimethacrylate monomers bearing a linear chain spacer with five methylene units .. 51
3.4.7 Vinylic monomers (25-26) ... 52
3.5 Results obtained under classical synthetic versus microwave irradiation methodologies. .. 53
3.6 Selected monomers ... 54
Chapter IV 4 Thermal Characterisation... 55
4.1 Outline ... 55
4.2 Calorimetric characterisation ... 55
4.3 Polarised optical microscopy characterisation ... 61
Chapter V 5 Structural and electro-optical characterisation ... 71
5.1 Outline ... 71
5.2 Molecular weights and polymer structures ... 71
5.2.1 Characterisation of molecular weights ... 71
5.2.2 Microstructure of the polymer matrix ... 73
5.2.3 Electro-optical characterisation ... 77
Chapter VI 6 Conclusions ... 79
Chapter VII 7 Bibliography ... 81
Chapter VIII 8 Appendix ... 85
Figure Index
Chapter I
Figure 1.1 – Various aggregate morphologies: a micelle (a), cylindrical micelle (b), bilayer (c),
vesicle(d) and inverted micelle(e) (adapted from ref. 5). ... 2
Figure 1.2 – Molecular order in a nematic liquid crystal. The director shows the direction of preferred orientation (adapted from ref. 3). ... 3
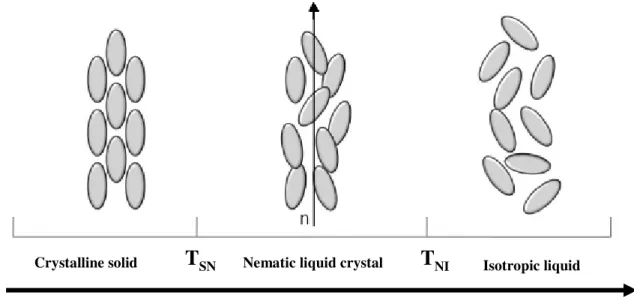
Figure 1.3 – Schematic representation of the sequence of phase transition between solid, nematic liquid crystal and isotropic liquid by increasing temperature (adapted from ref. 3). ... 4
Figure 1.4 – Schematic illustration of the refraction of unpolarised light travelling through a birefringent material (adapted from ref.8). ... 5
Figure 1.5 – Temperature dependence on refractive index of a thermotropic liquid crystal (adapted from ref.3). ... 5
Figure 1.6 – Schematic illustration of the effect of an electric field on liquid crystal molecules (adapted from ref.11). ... 6
Figure 1.7 – Molecular structures of the components of the nematic liquid crystal mixture E7. ... 7
Figure 1.8 – Reaction scheme for the thermal decomposition of N, N-azobisisobutyronitrile (AIBN) in the two isobutyronitrile radicals. ... 9
Figure 1.9 –Reaction scheme for UV induced decomposition of 2,2-dimethoxy-2-phenylacetophenone (DMPA) into an benzoyl and an acetal radical fragments... 9
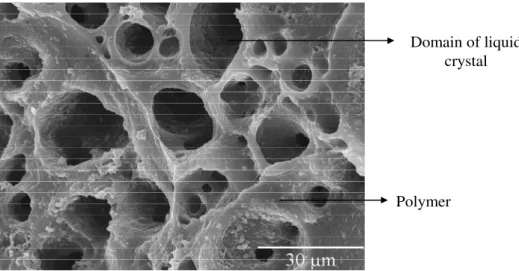
Figure 1.10 – SEM micrograph for the microstructure of the polymer matrix with a swiss cheese morphology type. ... 11
Figure 1.11 - Schematic illustration of bipolar (a) and radial (b) director configurations of the liquid crystals inside spherical droplets (adapted from ref.3). ... 12
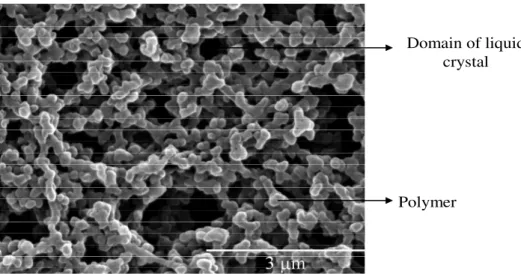
Figure 1.12 – SEM micrograph for the microstructure of the polymer matrix with polymer ball morphology type. ... 12
Figure 1.13 – Schematic representation of the averaged molecular orientation of the liquid crystal within the microdroplets without (a) and with (b) an applied electric field (adapted from ref. 3). ... 13
Figure 1.14 – Example of electro-optical response of PDLC with no hysteresis. ... 14
Figure 1.15 – Example of electro-optical response of PDLC with hysteresis. ... 15
Figure 1.16 –Example of electro-optical response of PDLC with permanent memory effect. ... 15
Figure 1.17 – Images of PDLC dives with permanent memory effect: (a) initial OFF state, (b) upon applying electric field and (c) OFF state after removed electric field. ... 16
Figure 1.18 – Example of application of PDLC in switchable windows in ON (a) and OFF (b) state. 18 Chapter II Figure 2.1 – Schematic illustration of an indium tin oxide (ITO) cell. ... 20
Figure 2.2 –Schematic representation of conventional (a) and microwave heating (b) (adapted from36). ... 21
Figure 2.3 – A schematic representation for the preparation of PDLC films by the PIPS method. ... 23
Figure 2.4 – Schematic diagram of the experimental system set-up used to study electro-optical properties ... 30
Chapter III Figure 3.1 – Molecular structures of synthesised monomers. ... 32
Figure 3.2 – General scheme for the synthesis of (a) monomethacrylate monomers and (b) dimethacrylate monomers. ... 33
Figure 3.5 – General scheme for the synthesis of vinylic monomers... 39
Figure 3.6 – Molecular structure of synthesised monomers with and without cyano and spacer chain group... 54
Chapter IV Figure 4.1 – DSC measurement obtained for monomer 19 during cycle I at 10ºC min-1. ... 56
Figure 4.2 – DSC measurement obtained for monomer 1 during cycle I at 10ºC min-1. ... 56
Figure 4.3 – DSC measurement obtained for monomer 7 during cycle I at 10ºC min-1. ... 57
Figure 4.4 – DSC measurement obtained for monomer 5 during cycle I at 10ºC min-1. ... 57
Figure 4.5 – DSC measurement obtained for monomer 22 during cycle I at 10ºC min-1. ... 57
Figure 4.6 – DSC measurement obtained for monomer 21 during cycle I at 10ºC min-1. ... 58
Figure 4.7 – DSC measurement obtained for monomer 20 during cycle I at 10ºC min-1. ... 59
Figure 4.8 – DSC measurement obtained for monomer 8 during cycle I at 10ºC min-1. ... 59
Figure 4.9 – Optical micrographs of monomer 19 at specific temperatures during the heating and cooling runs at 10ºC min-1. ... 61
Figure 4.10 – Optical micrographs of monomer 1 at specific temperature during the heating and cooling runs at 10ºC min-1. ... 62
Figure 4.11 – Optical micrographs of monomer 7 at specific temperature during the heating and cooling run at 10ºC min-1... 63
Figure 4.12 – Optical micrographs of monomer 5 at specific temperatures during the heating and cooling runs at 10ºC min-1. ... 64
Figure 4.13 – Optical micrographs of monomer 22 at specific temperatures during the heating and cooling runs at 10ºC min-1. ... 65
Figure 4.14 – Optical micrographs of monomer 21 at specific temperatures during the heating and cooling run at 10ºC min-1... 66
Figure 4.15 – Optical micrographs of monomer 20 at specific temperatures during the heating and cooling runs at 10ºC min-1. ... 67
Figure 4.16 - Optical micrographs of monomer 8 at specific temperatures during the first and second heating at 10ºC min-1. ... 68
Chapter V Figure 5.1 – SEM micrographs for the microstructure of the polymer matrix prepared by (a) thermal and (b) photochemical polymerisation of monomer 19. ... 73
Figure 5.2 – SEM micrographs for the microstructure of the polymer matrix prepared by (a) thermal and (b) photochemical polymerisation of monomer 1. ... 74
Figure 5.3 – SEM micrographs for the microstructure of the polymer matrix prepared by (a) thermal and (b) photochemical polymerisation of monomer 7. ... 74
Figure 5.4 – SEM micrographs for the microstructure of the polymer matrix prepared by (a) thermal and (b) photochemical polymerisation of monomer 5. ... 75
Figure 5.5 – SEM micrographs for the microstructure of the polymer matrix prepared by (a) thermal and (b) photochemical polymerisation of monomer 22. ... 75
Figure 5.6 – SEM micrograph for the microstructure of the polymer matrix prepared by (a) thermal and (b) photochemical polymerisation of monomer 21. ... 76
Figure 5.7 – SEM micrograph for the microstructure of the polymer matrix prepared by (a) thermal and (b) photochemical polymerisation of monomer 20. ... 76
Figure 5.8 – SEM micrograph for the microstructure of the polymer matrix prepared by (a) thermal and (b) photochemical polymerisation of monomer 8. ... 77
Chapter VIII
Figure 8.1 – Proton NMR spectrum of monomer 1. ... 85
Figure 8.2 – Carbon NMR spectrum of monomer 1. ... 85
Figure 8.3 – Proton NMR spectrum of monomer 2. ... 86
Figure 8.4 – Carbon NMR spectrum of monomer 2. ... 86
Figure 8.5 – Proton NMR spectrum of monomer 3. ... 87
Figure 8.6 – Carbon NMR spectrum of monomer 3. ... 87
Figure 8.7 – Proton NMR spectrum of monomer 4. ... 88
Figure 8.8 – Carbon NMR spectrum of monomer 4. ... 88
Figure 8.9 – Proton NMR spectrum of monomer 5. ... 89
Figure 8.10 – Carbon NMR spectrum of monomer 5. ... 89
Figure 8.11 – Proton NMR spectrum of monomer 6. ... 90
Figure 8.12 – Carbon NMR Spectrum of monomer 6. ... 90
Figure 8.13 – Proton NMR spectrum of monomer 7. ... 91
Figure 8.14 – Proton NMR spectrum of monomer 7. ... 91
Figure 8.15 – Proton NMR spectrum of monomer 8. ... 92
Figure 8.16 – Carbon NMR spectrum of monomer 8. ... 92
Figure 8.17 – Proton NMR spectrum of monomer 9. ... 93
Figure 8.18 – Carbon NMR spectrum of monomer 9. ... 93
Figure 8.19 – Proton NMR spectrum of monomer 10. ... 94
Figure 8.20 – Carbon NMR spectrum of monomer 10. ... 94
Figure 8.21 – Proton NMR spectrum of monomer 11. ... 95
Figure 8.22 – Carbon NMR spectrum of monomer 11. ... 95
Figure 8.23 – Proton NMR spectrum of monomer 12 ... 96
Figure 8.24 – Carbon NMR spectrum of monomer 12. ... 96
Figure 8.25 – Proton NMR spectrum of compound 13. ... 97
Figure 8.26 – Carbon NMR spectrum of compound 13. ... 97
Figure 8.27 – Proton NMR spectrum of compound 14. ... 98
Figure 8.28 – Carbon NMR spectrum of compound 14. ... 98
Figure 8.29 – Proton NMR spectrum of compound 15. ... 99
Figure 8.30 – Carbon NMR spectrum of compound 15. ... 99
Figure 8.31 – Proton NMR spectrum of compound 16. ... 100
Figure 8.32 – Carbon NMR spectrum of compound 16. ... 100
Figure 8.33 – Proton NMR spectrum of compound 17. ... 101
Figure 8.34 – Carbon NMR spectrum of compound 17. ... 101
Figure 8.35 – Proton NMR spectrum of compound 18. ... 102
Figure 8.36 – Carbon NMR spectrum of monomer 18. ... 102
Figure 8.37 – Proton NMR spectrum of monomer 19. ... 103
Figure 8.38 – Carbon NMR spectrum of monomer 19. ... 103
Figure 8.39 – Proton NMR spectrum of monomer 20. ... 104
Figure 8.40 – Carbon NMR spectrum of monomer 20. ... 104
Figure 8.41 – Proton NMR spectrum of monomer 21. ... 105
Figure 8.42 – Carbon NMR spectrum of monomer 21. ... 105
Figure 8.43 – Proton NMR spectrum of monomer 22. ... 106
Figure 8.44 – Carbon NMR spectrum of monomer 22. ... 106
Figure 8.45 – Proton NMR spectrum of monomer 23. ... 107
Figure 8.46 – Carbon NMR spectrum of monomer 23. ... 107
Figure 8.47 – Proton NMR spectrum of monomer 24. ... 108
Figure 8.48 – Carbon NMR spectrum of monomer 24. ... 108
Figure 8.49 – Proton NMR spectrum of monomer 25. ... 109
Figure 8.50 – Carbon NMR spectrum of monomer 25. ... 109
Figure 8.51 – Proton NMR spectrum of monomer 26. ... 110
Table Index
Chapter I
Table 1.1 – Components and mass composition of the Merck E7 liquid crystal. ... 7
Chapter III
Table 3.1 – Synthesis of monomethacrylate monomers. ... 34Table 3.2 – Synthesis of dimethacrylate monomers. ... 35
Table 3.3 – Synthesis of monobromide precursors. ... 36
Table 3.4 – Synthesis of dibrominated precursors. ... 37
Table 3.5 – Synthesis of monomethacrylate monomers bearing a linear chain spacer with five methylene units. ... 38
Table 3.6 – Synthesis of dimethacrylate monomers bearing a linear chain spacer with five methylene units. ... 39
Table 3.7 – Synthesis of vinylic monomers. ... 40
Chapter IV
Table 4.1 - Thermal properties of monomers obtained by DSC during different cooling/heating cycles ... 60Table 4.2 – Thermal properties of monomers obtained by POM during heating/cooling runs. ... 69
Chapter V
Table 5.1 – Values of average molecular weights (Mn and Mw) and polydispersity index (PDI) for polymers prepared with a mixture of monomer/glycidyl methacrylate (50/50 w/w) by thermal polymerisation. ... 72Symbols and Abbreviations
Hcr – Enthalpy of crystallisation
Hm – Enthalpy of fusion
n – Optical anisotropy – Dielectric anisotropy
13
C NMR – Carbon - 13 Nuclear Magnetic Resonance
1
H NMR – Proton Nuclear Magnetic Resonance 5CB - 4-cyano-4´-pentyl-1,1´-biphenyl
5CT –4´n-pentyl-4-cyanoterphenyl 7CB – 4-n-heptyl-4´cyanobiphenyl 8OCB – 4,4´-n-octyloxycyanobiphenyl AIBN – N,N-azobisisobutyronitrile CDCl3 – Deuterated chloroform
CH2Cl2 – Dichloromethane
d – Doublet
dd – Double doublet
DMF –
DimethylformamideDMPA – 2, 2-dimethoxy-2-phenylacetophenone DSC – Differential Scanning Calorimetry E7 – The nematic liquid crystal E7
E90 – Electric field required for the PDLC to reach 90% of its maximum transmittance
FTIR – Fourier Transform Infrared GPC – Gel Permeation Chromatography Hz – Hertz
ITO – Indium Tin Oxide J – Coupling constant
K2CO3 –
Potassium carbonate
LC – Liquid crystal m – Multiplet m.p. – Melting point
MAOS –Microwave Assisted Organic Synthesis Mn – Number average molecular weight
MW – Microwave
Mw – Weight average molecular weight
ne – Extraordinary refractive index
NEt3 – Triethylamine
Nh /min – Einstein (moles of photons) per minute no – Ordinary refractive index
np - Refractive index of polymer
PDI – Polydispersity index
PDLC – Polymer Dispersed Liquid Crystal PIPS – Polymerisation Induced Phase Separation POM – Polarised Optical Microscopy
ppm – Parts per million q – quadruplet
s – Singlet
SEC – Size Exclusion Chromatography SEM – Scanning Electron Microscopy SIPS – Solvent Induced Phase Separation t – Triplet
Tan – Measure of the loss factor Tc – Crystallisation temperature
TCC – Cold crystallisation temperature
Tg – Glass transition temperature
TIPS - Thermally Induced Phase Separation TLC – Thin Layer Chromatography Tm – Melting temperature
TMI –Mesophase to isotropic transition temperature
TMS – Tetramethylsilane
TNI - Nematic to isotropic transition temperature
TSM – Solid to mesophase transition temperature
TSN - Solid to nematic transition temperature
– Out-of-plane bending vibrations – Bending vibrations
– Chemical shift
⊥ -Dielectric constant according to the direction perpendicular to the director
|| - Dielectric constant according to the direction parallel to the director
1
Introduction
1.1
Liquid Crystals
Liquid crystals (LCs) are materials which have structures between the crystalline solid state and the liquid state. In crystals the molecules maintain fixed positional and orientational order and minimal mobility; on the other hand the opposite occurs in the liquids where there is neither positional or orientational order. Between these two extremes there is the situation in which the liquid crystal molecules are free to flow like a liquid but keeping a certain direction, maintaining some degree of orientation but loosing their positional order 1. For this reason LCs are referred to as intermediate phases or mesophases. The mesophases are true thermodynamic stable states of matter like solids, liquids and gases. Hence LCs are also often referred to the fourth state of matter 2. In a simple way, liquid crystals can be divided into two main groups according to the conditions to achieve a stable liquid crystal phase: the temperature for thermotropic LC and the concentration of the solution for lyotropic LC 1.
1.1.1
Lyotropic liquid crystals
Lyotropic liquid crystals display liquid crystalline behaviour only when mixed with another material (solvent). The temperature is an important variable in determining the phase present. Nevertheless, it is common to indicate the concentration of solution as the main variable to achieve lyotropic liquid crystal domain.3.
Generally, molecules of lyotropic liquid crystals have two distinct parts: a polar, often ionic, head (hydrophilic group) and a nonpolar often hydrocarbon tail (hydrophobic group). In solution, when the concentration gets high enough the amphiphilic molecules form ordered structures, the molecules arrange themselves in such a way that either the polar ends are turned out in a polar solvent (figure 1.1, a,b,c,d) or the nonpolar ends are turn out in a nonpolar solvent (figure 1.1, e). The opposite end is kept isolated from the unlike solvent. For example, when dissolved in a polar solvent such as water, the hydrophobic tails assemble together and present the hydrophilic heads to the solvent. When the concentration gets high enough the molecules assemble themselves. For low concentrations, the solution looks as if it were made-up of any other particles distributed randomly throughout the solvent. Many liquid crystalline biomolecules are found in cell membranes, and such structures have properties
Figure 1.1 – Various aggregate morphologies: a micelle (a), cylindrical micelle (b), bilayer (c), vesicle(d) and inverted micelle(e) (adapted from ref. 5).
The potential applications of lyotropic liquid crystals are related to the area of detergents, food emulsifiers, oil recovery and medical technology 3. The optical switching properties of liquid crystals are characteristic of thermotropic liquid crystals. This type of LC has been widely used in electro-optical applications and therefore is of great interest in this work.
1.1.2
Thermotropic liquid crystals
In a simple way, within thermotropic liquid crystals there are four main types of LCs. These different types include the calamitic, discotic, pyramid and tetrahedral liquid crystals which, depending on the geometrical shape of the molecules resemble a rod, a disc, a pyramid and a tetrahedron, respectively. The calamitic liquid crystal is the most common type of liquid crystal and gives rise to two main phases, smetic and nematic, depending upon the amount of order in the material 1, 3, 6.
n
Figure 1.2 – Molecular order in a nematic liquid crystal. The director shows the direction of preferred orientation (adapted from ref. 3).
In this phase the molecules possess only orientational but no long range positional order. The preferred alignment can be described by a unit vector ~n, called “director”. The direction of ~n is imposed by external forces such as the guiding effect of the wall of the container or electric and magnetic fields. The uniaxial nematic phase is characterised by rotational symmetry of the system around the director
~n1.
As previously mentioned, the transitions involving thermotropic liquid crystal are effected by changing temperature on pure compounds or a mixture of compounds. Normally, when such a crystal melts both types of order, positional and orientational, disappear at the same temperature (Tm). The
resulting phase is an isotropic liquid where molecules move randomly. However, there are special crystalline solids that melt at TSN (solid to nematic transition temperature) but to intermediate state
(nematic phase) and only at higher temperature, when achieve a nematic to isotropic transition temperature, TNI, to isotropic liquid state. In the intermediate state positional order disappears either
fully or partially while some degree of orientational order is maintained. The liquid crystal phase obtained is stable for a certain temperature interval TSN -TNI
1, 7
T
SN Nematic liquid crystalT
NI Isotropic liquid Crystalline solidFigure 1.3 – Schematic representation of the sequence of phase transition between solid, nematic liquid crystal and isotropic liquid by increasing temperature (adapted from ref. 3).
1.2
Liquid crystal properties
Liquid crystals possess many of the mechanical properties of an isotropic liquid, such as, high fluidity and the inability to support shear, but on the other hand, they have some properties similar to crystalline solids such optical anisotropy (birefringence)6.
In the liquid and gaseous states of matter, where there is no orientational order among the molecules any property measured along one direction has the same value in all directions, in other words all directions in space are equivalent. The property by which the some result is obtained regardless the direction of measurement or observation is called isotropy, and a phase that has this property is called an isotropic phase3.On the other hand, as a result of orientational order among the molecules of liquid crystals, the isotropy is destroyed and most physical properties are related to anisotropy. This means that the same properties with different values are measured along different directions. Changing the orientational order of the anisotropic molecules by the application of electric and magnetic fields it is possible to modify the original optical and the mechanical properties. The principal types of anisotropies in liquid crystals are the optic and the dielectric anisotropies.
The optic anisotropy in a nematic liquid crystal is related to birefringence. The birefringence in a nematic liquid crystal is characterised by the fact that an unpolarised light ray entering a liquid crystal is in general divided into two rays, which travel through the liquid crystal with different velocities and directions. This is due to an ordinary, no, and an extraordinary, ne, indices, and having the electric
Ordinary Index (no) (polarised)
Extraordinary Index (ne) (polarised)
Unpolarised Light
Figure 1.4 – Schematic illustration of the refraction of unpolarised light travelling through a birefringent material (adapted from ref.8).
The birefringence of a material is characterised by the difference, n, between the refractive indices for the extraordinary, ne, and ordinary, no, ray
9
:
n= ne-no
The degree of orientational order in liquid crystal varies with temperature, and therefore the refractive indices also change. At still higher temperature TNI, (nematic to isotropic transition temperature) a
mesophase melts into an isotropic liquid with no positional and orientational order and the two indices become closer together in value. At the transition to the isotropic liquid the anisotropy disappears, and one refractive index prevails (figure 1.5) 3.
The dielectric anisotropydetermines the orientation of the liquid crystal molecules in the presence of an electric field. The electric field has a direction associated with it and when external electric fields are applied to a liquid crystal, the phase responds differently depending on direction that the electric field is applied. The freedom of the liquid crystal to change orientation (like liquids) but to do so while maintaining some orientational order among the molecules (like crystalline solids) allows this type of response with the electric field 3.The dielectric anisotropy is characterised by the dielectric constants measured perpendicularly, ||, and parallel, ⊥, to the longitudinal axis of the liquid crystal molecule.
The dielectric anisotropy is given by:
This difference is a measure of the tendency of the director of molecules to align parallel or perpendicular to the electric field applied. If no electric field is applied, the permanent electric dipoles on the liquid crystal molecules are not aligned, even if orientational order is present. When an electric field is applied, the molecules tend to orient according to the director of the electric field. When ||> ⊥,
the dielectric anisotropy, , is positive and the director of molecules on the liquid crystal tends to align parallel to applied the electric field (figure 1.6), but when > || the dielectric anisotropy, , is
negative and the director of molecules on liquid crystal tend to align perpendicularly to the electric field applied 10.
Electric Field
1.3
The nematic Liquid Crystal mixture E7
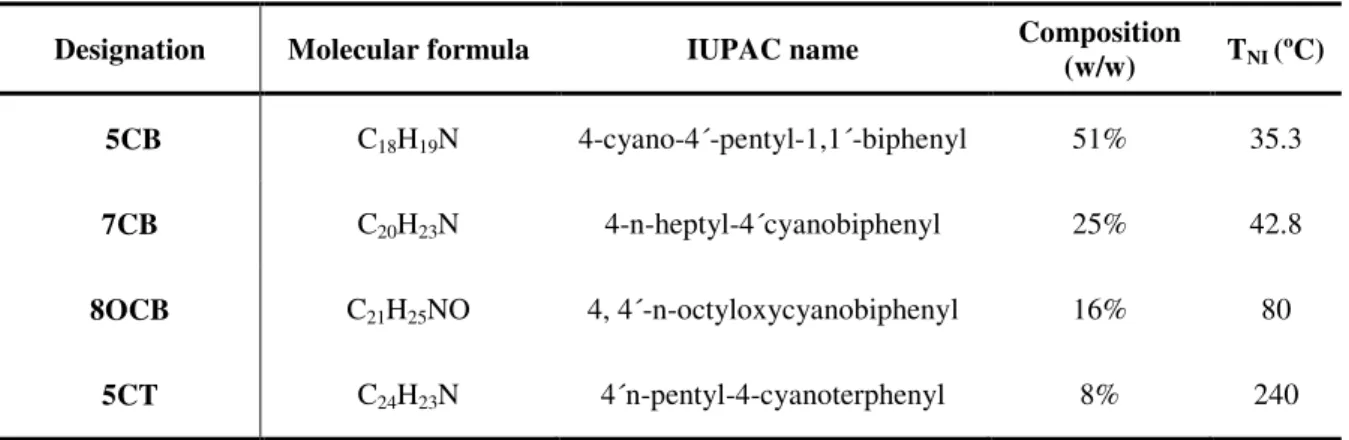
The liquid crystal used in this work is a thermotropic calamitic nematic, know as E7. It is a mixture composed by three different cyanobiphenyls and one cyanoterphenyl in different proportions. The molecular structures of the different components of the nematic liquid crystal E7 are shown in figure 1.7. The weight/weight (w/w) percentage and physical properties of E7 components are shown in table
1.1 7, 12.
C N
5CB
C N
C
O N
C N
7CB
80CB
5CT
Figure 1.7 – Molecular structures of the components of the nematic liquid crystal mixture E7.
Table 1.1 – Components and mass composition of the Merck E7 liquid crystal.
Designation Molecular formula IUPAC name Composition
(w/w) TNI (ºC)
5CB C18H19N 4-cyano-4´-pentyl-1,1´-biphenyl 51% 35.3
7CB C20H23N 4-n-heptyl-4´cyanobiphenyl 25% 42.8
8OCB C21H25NO 4, 4´-n-octyloxycyanobiphenyl 16% 80
5CT C24H23N 4´n-pentyl-4-cyanoterphenyl 8% 240
E7 is widely used in polymer dispersed liquid crystals, and it was selected to be studied in this work, because it offers a wide range of operating temperatures in which it maintains anisotropic characteristics. The refractive indeces of E7 at T=20ºC are given as: no=1.5183, ne= 1.7378
13
. It exhibits a nematic to isotropic transition at nearly TNI=58ºC. At room temperature it still exhibits a
nematic phase and no other transitions between 58 and -62ºC, where it shows a glass transition.
1.4
Polymer Dispersed Liquid Crystals
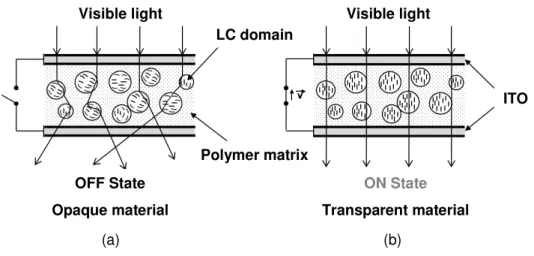
Polymer dispersed liquid crystal (PDLC) films are a mixed phase of nematic liquid crystals (LC) commonly dispersed as inclusions in a solid polymer14. They have remarkable electro-optical behaviour since they can be switched from an opaque to a transparent state simply by application of an electric field 13.
PDLCs have been prepared by two general methods: one in which the system remains heterogeneous during the process, and another in which the system becomes heterogeneous during the process. The first case includes the solvent induced phase separation (SIPS): the LC is mechanically dispersed in a solution of a polymer, the solvent of which does not dissolve liquid crystal. After evaporation of the solvent, the composite structure obtained is stabilised due to the polymer morphology of the system, but is poorly controlled due to a coalescence of droplets during the preparation process. The second case is called thermally induced phase separation (TIPS) or polymerisation induced phase separation (PIPS)14.
The main advantage of preparation by the PIPS method is the possibility to obtain a composite directly between glass plates coated with conductive indium tin oxide (ITO) film without additional laminating procedures. The PDLC film is produced in one technological step. In the PIPS method the phase separation of the initially homogeneous mixture and the polymerisation occur simultaneously. The PIPS process was particularly suitable for our purpose because it is quite simple and allows for a high degree of control over the final properties of the PDLC films 15
In this work the PIPS method is obtained by thermal or photochemical polymerisation of a homogeneous mixture of polymerisable monomers, initiator and liquid crystal. These types of polymerisation occur by a mechanism of free radical polymerisation initiated by radicals.
1.5
Free radical polymerisation
therefore in properties. In this work more attention was given to the thermal and photochemical polymerisation.
In thermal polymerisation the N,N-azobisisobutyronitrile (AIBN) it is one of the most common initiator which fragments mainly into isobutyronitrile radicals (figure 1.8).
CH3
C H3C
CN
N N C
CH3
CH3
CN
CH3
H3C
CN
2 N2
64ºC
Figure 1.8 – Reaction scheme for the thermal decomposition of N, N-azobisisobutyronitrile (AIBN) in the two isobutyronitrile radicals.
Thermal initiator decomposition normally depends on temperature but also on the solvent and the monomer and the solubility. AIBN decomposition normally occurs to an appreciable extent at temperatures greater than 64ºC.
In photochemical polymerisation light sensitive compounds are required as initiators to initiate photochemical polymerisation. These compounds absorb light in the ultraviolet / visible wavelength range and undergo fragmentation leading to the formation of radicals 16. An example is the photochemical decomposition of 2,2-dimethoxy-2-phenylacetophenone (DMPA) which is illustrated in figure 1.9. The main advantage of polymerisation with UV radiation is the possibility to achieve high polymerisation rates in a fraction of seconds 17.
hv
OCH3
OCH3
O
O OCH3
OCH3
Figure 1.9 –Reaction scheme for UV induced decomposition of 2,2-dimethoxy-2-phenylacetophenone (DMPA) into an benzoyl and an acetal radical fragments.
In the initiation step are included radical production (described above for the AIBN and DMPA) and the attack of these radicals to the monomer molecules. The overall mechanism for free radical chain polymerisation can be described as:
Initiation:
i) Generation of free radicals (R ) by homolytic dissociation of the initiator (I).
(Kd- rate constant for the dissociation of the initiator)
ii) Reaction between radicals (R ) previously formed and monomer´s double bond (M1)
producing new active species (M1).
(K1- rate constant for the initiation step)
Propagation:
i) Chain extension by successive addition of monomer molecules (M) to the monomer radical unities (Mn) formed in the initiation step.
(Kp- rate constant for the propagation step)
Termination:
In last step, radicals combine or disproportionate to terminate the chain growth and form polymer molecules.
i) Combination (a simple interaction between two reactive species, Mn and Mm).
(Ktc- rate constant for the termination step by combination)
(Ktc- rate constant for the termination step by disproportionation)
1.6
Microstructure of the polymer network
During polymerisation of what is initially a homogeneous solution of monomers and LC molecules, the polymeric components grow in molecular weight, and when the two components become sufficiently incompatible, there is a decrease of LC solubility which induces formation of phase separation. The polymer matrix acquires a particular morphology with liquid crystal dispersed in its clusters14. The polymeric conditions18, the chemical nature of the liquid crystal 19 and the polymerisable monomers 20 determine the morphology of polymer matrix. Conventional, PDLCs have two main morphologies: swiss cheese or polymer ball types each one with different characteristics. The observation of the microstructure of the polymer matrix is carried out by scanning electron microscopy (SEM). The dark areas in the SEM microphotographs reveal the absence of the material, which would have corresponded to the original liquid crystal domains.
The swiss cheese morphology type (figure 1.10) is characterised by liquid crystal randomly dispersed in a polymer matrix, as microdroplets. The size and the shape of the LC microdroplets have strong dependence on the parameters of preparation and the type of polymeric matrix21, 22.
Domain of liquid crystal
Polymer
In PDLC morphologies with isolated LC microdroplets, two types of distribution of liquid crystal molecules are typically observed.
(a) (b)
Figure 1.11 - Schematic illustration of bipolar (a) and radial (b) director configurations of the liquid crystals inside spherical droplets(adapted from ref.3).
The bipolar and radial configurations (figure 1.11) are related to droplet size and shape and depend on whether the liquid crystal prefers to align parallel or perpendicular to the polymer surface, respectively. Due to these different configurations, liquid crystal molecules would be randomly oriented not uniform within each droplet or from droplet to droplet causing dispersion of the incident light 3.
In the polymer ball morphology type the polymerisable monomers are phase separated from the continuous liquid crystals and form micro-sised polymer balls. These micro-sised polymer balls merge and form a large polymer network structure with diverse shapes of voids in which LC exists. In this case, the LC is in a continuous phase and fills the irregular shaped voids of the polymer network, which are more or less interconnected 22.
Domain of liquid crystal
Polymer
1.7
PDLC films transmittance
As mentioned before, PDLC devices can be switched electrically from an opaque scattering state to a highly transparent state when a film of liquid crystal-polymer mixture is sandwiched between two conductive glass slides and the electric field is applied. The polymer matrix material is optically isotropic so it has a single refractive index (np). The liquid crystal within the micro-domains has an
ordinary refractive index (no) and an extraordinary refractive index (ne) when light ray travel through
the liquid crystal.
When no electric field is applied although the liquid crystal molecules would be oriented within each droplet, this orientation changes from droplet to droplet and light propagation normal to the film surface will probe a range of refractive indices between (no) and (ne). Since the optical anisotropy of
LC molecules used in PDLC is sufficiently large, the effective refractive index is not generally matched with the refractive index of the polymer (np), light will be scattered and the PDLC is opaque
(OFF state). To maximize off-state scattering, the birefringence ( n= ne-no) should be as large as
possible19. On the other hand, when an electric field with sufficient strength to overcome the interactions between polymer matrix and liquid crystal at interfaces of LC domains–polymer matrix, is applied across the film liquid crystal directors within each droplet become uniformly oriented parallel to the direction of the field. If refractive index of the liquid crystal matches the refractive index of the polymeric matrix (np) the film become transparent (ON state)
9
.
Normally, when the applied electric field is removed, the nematic directors return to their random distribution. The film begins to appear opaque again. A schematic representation of a functional PDLC film is shown in figure 1.13.
(a) (b)
Visible light Visible light
OFF State
Opaque material
ON State
Transparent material LC domain
Polymer matrix
ITO
1.7.1
Electro-optical properties of PDLCs
There are three main types of electro-optical response. The factors contributing to the different response are many and still poorly understood. Electro-optical response of PDLC is usually measured by ramping a PDLC up and down in voltage and comparing the optical response at each voltage14. The different types of change of transmittance of PDLC films as a function of the electric field are shown infigure 1.14, 1.15 and 1.16.
One of the parameters used to evaluate the efficiency of electro optical response of PDLC is the electric field required to achieve 90% of the maximum transmittance and is designated as E90. Thus,
the lower the value of E90, the more easily PDLC devices switch from the OFF state to ON state.
The most common electro-optical response reported in the literature for PDLC is when the increasing voltage curve is coincident to the decreasing voltage curve as shown in figure 1.14. It was observed that when the electric field is removed liquid crystal molecules relax back, so that the long shaped molecules which were oriented in the same direction in each droplet return to their original random orientation.
T
ra
n
sm
it
ta
n
ce
(%
)
Electric field (V)
OFF state
ON state
Figure 1.14 – Example of electro-optical response of PDLC with no hysteresis.
When these curves are not coincident the PDLC shows electrical hysteresis. The transmission with increasing voltage is lower than the transmission when the electric field is decreased. This effect is illustrated on figure 1.15 and can be defined as the difference between the increasing voltage curve and the decreasing voltage curve.
film is more transparent under decreasing field voltage than with increasing field, because liquid crystals remain with certain degree of alignment caused by the increasing field voltage. However, at the end of measured electro-optical response, the value of the transmittance for the initial opaque state is coincident which that of the final opaque state23.
Electric field (V)
T
ra
n
sm
it
ta
n
ce
(%
)
ON state
OFF state
Figure 1.15 – Example of electro-optical response of PDLC with hysteresis.
In particular cases, not only the transmission with increasing voltage is lower than the transmission when the voltage is decreased but also a high transparency state is obtained for a long period of time at room temperature even after the applied voltage has been switched off, starting from an opaque state and after reaching a transparent state (figures 1.16-1.17)14.
T
ra
n
sm
it
ta
n
ce
(%
)
Electric field (V)
ON state
FinalOFF' State
High transparency state even after reach ON state
InitialOFF state
Figure 1.16 –Example of electro-optical response of PDLC with permanent memory effect.
electro-optical response has a permanent memory effect and this still remains a poorly understood aspect of PDLC electro-optical behaviour.
Initial OFF State ON State Final OFF' State
Applied Electric Field Removed Electric Field
(a) (b) (c)
Initial OFF State ON State Final OFF' State
Applied Electric Field Removed Electric Field
(a) (b) (c)
Figure 1.17 – Images of PDLC dives with permanent memory effect: (a) initial OFF state, (b) upon applying electric field and (c) OFF state after removed electric field.
Various factors can influence the performance of a PDLC and therefore the permanent memory effect. However, the most frequently explanation mentioned in literature is related with the anchoring effect7,
21, 24, 25
. This effect consists on the interaction between the liquid crystal molecules and polymer matrix at the interface of LC domains and polymer matrix. When an electric field is applied inducing the orientation of LC molecules, it opposes the anchoring effect. If this orientation remains even after the applied voltage has been switched off, the liquid crystal does not relax back completely but remains aligned with the electric field and a high transparency state is displayed without any more energy consumption. Therefore for this to happen there must be a weak force between LC molecules and the polymer surface.
The permanent memory effect is very revolutionary in the study of PDLCs because it allows a switch in transparency and the new state is kept without the need for energy to be spent. The only energy required is that needed to switch the PDLC from the OFF state to the ON state, therefore these devices become low power consumers and environmentally friendly.
1.8
Parameters that influence the performance of PDLC films
Despite the fact that PDLC films can be switched between a highly scattering opaque state and a clearly transparent state, these devices sometimes have disadvantages such as the high driving voltage (E90) and the insufficient maximum transmittance (TMAX)
26
decreased the anchoring effect increase. This effect is directly related with the voltage needed to align the liquid crystal molecules in the domain. Strong anchoring forces hinder the alignment of liquid crystal molecules. Therefore a high voltage is needed to align liquid crystal molecule along the electric field, and the reverse for lower anchoring effects 27. Therefore, an understanding of the relationships between preparation conditions and molecular structure of the monomers on electro-optical performance of PDLCs is crucial to control device properties.
1.8.1
Polymeric conditions
The phase separation phenomenon between LC and polymeric matrix in PDLCs is a rate process where the transport parameters can play an important role in determining the domain size and amount of LC separated from the polymer matrix. The rate of polymerisation and also some physical parameters, such the viscosity of the systems change the LC domain size. In general the thermal polymerisation is slower (can take several hours) which combined with the effect of temperature that significantly decreases the viscosity of the medium may cause a promotion of the growth of LC domains by diffusion and coalescence. On the other hand, photochemical polymerisation produces a higher polymerisation rate. Smaller domain size can be achieved by higher viscosity of the systems and poor diffusion of free radicals of the polymerisable monomers during polymerisation and the reduced coalescence of LC domains. Therefore, small LC domains can be obtained18, 29.
1.8.2
Molecular structure of polymerisable monomers
with five methylene units was introduced into some of the structures between the aromatic systems and the methacrylate group to mimic the structure of 5CB the liquid crystal component present with the highest percentage in E7.
1.9
Applications
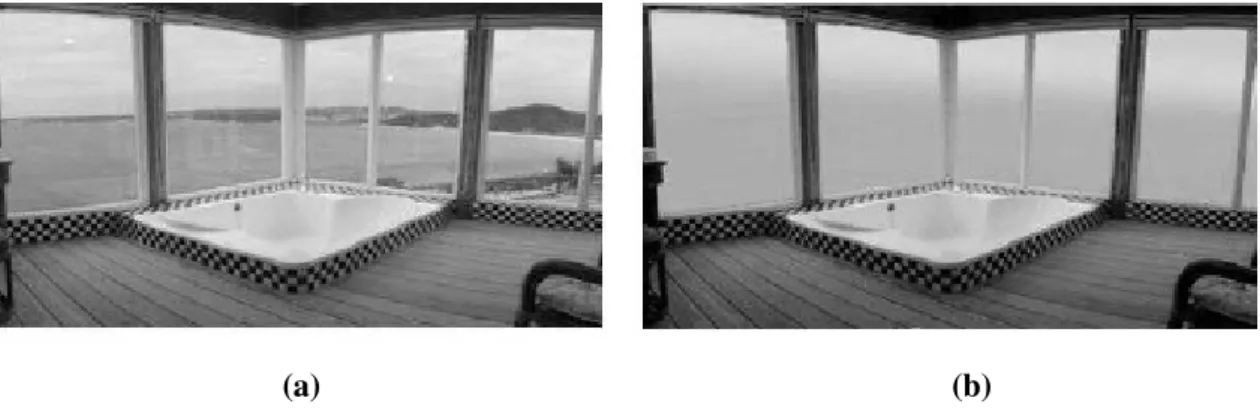
The applications of PDLCs have received considerable attention because of their great variety of electro-optical applications. Polymer dispersed liquid crystal do not require the polarizer and alignment layers to be switched electrically to a transparent state. Beyond this, they show a quick electro-optical response, simple fabrication and low cost production 29. Therefore, PDLCs are potential materials for electro-optical devices such as reflective displays, optical switches and variable transmittance windows 14, 32, 33. However the most extensive application for PDLCs is in switchable windows as is shown in figure 1.18.
(a) (b)
Figure 1.18 – Example of application of PDLC in switchable windows in ON (a) and OFF (b) state.
2
Materials and Methods
2.1
Outline
This chapter describes materials and methods used in the preparation and characterisation of the monomers synthesised and the PDLC films. A series of photochemical and thermal polymerisable monomers, mono- and dimethacrylate with and without a linear chain spacer with five methylene units and vinylic monomers were synthesised under microwave (MW) irradiation. The structures of all compounds isolated were supported by proton and carbon nuclear magnetic resonance spectroscopy (1H and 13C NMR), Fourier transform infrared spectroscopy (FTIR), elemental analysis and by melting point (m.p.) determinations. On other hand, to achieve a relationship between the molecular structures of the polymerisable monomers and the performance of the PDLC film, the monomers with higher structural affinity with E7, were characterised thermally by differential scanning calorimetry (DSC) and polarised optical microscopy (POM) with temperature ramps. The morphology of the polymeric matrix was evaluated by scanning electronic microscopy (SEM). The monomers were also copolymerised with glycidyl methacrylate by photochemical and thermal polymerisation. The molecular weights of the resulting polymers were evaluated by gel permeation chromatography (GPC). The electro-optical properties of the PDLC films were determined by measuring the voltage dependence on the transmitted light.
2.2
Materials
2.2.1
Nematic liquid crystal E7
The liquid crystal knows as E7 used was purchased from Merck and used without further purification. The chemical composition and properties of the nematic liquid crystal E7 were previously described in section 1.3.
2.2.2
Initiators of polymerisation
2.2.3
Indium tin oxide cells
The commercial cells used for electro-optic studies are made-up from a transparent conducting glass coated with a thin layer of indium tin oxide (ITO). Transparent conducting electrodes with the combination of high optical transmission and good electrical conductivity are essential to electric light devices. Indium tin oxide is commonly used because of its relatively high transparency to visible light and low sheet resistance for electrical current conduction 34.A schematic illustration of an indium tin oxide cell is illustrated in figure 2.1. All properties described in table 2.1about the cells were provided by Instec. Inc.
Tabela 2.1 – Indium tin oxide (ITO) cell characteristics.
Part
Number Cell type
ITO area ( m)
Cell gap ( m)
Cell Thickness (mm)
ITO resistance ( / )
LC2-20.0 Homogeneous
alignment 5x5 20.0+0.2 1.5 100
2.3
Methods
2.3.1
Microwave Irradiation
High-speed synthesis with microwave irradiation (MW) has attracted a considerable amount of attention in recent years. The area of microwave assisted organic synthesis (MAOS) reports the use of microwave heating to accelerate organic chemical transformations 35.
Traditionally, organic synthesis is carried out by conductive heating with an external heat source, for example an oil bath. This can be an inefficient method to transfer energy into the system, since it depends on the thermal conductivity of the various materials that must be penetrated. This process can take hours. Conductive heating also hinders the chemist´s control over the reaction. However, microwave irradiation produces efficient internal heating because energy is applied directly to the reagents, leading to a rapid rise in temperature (figure 2.2). Microwave enhanced chemistry is based on the efficient heating of materials by “microwave dielectric heating” effects 36.
(a) (b)
Localised heating
Figure 2.2 –Schematic representation of conventional (a) and microwave heating (b) (adapted from36).
The ability of a substance to convert electromagnetic energy into heat at a given frequency and temperature is determined by the so-called loss factor (tan ):
where the dielectric loss, ´´, is indicative of the amount of input microwave energy that is lost to the sample by heat and ´, the dielectric constant is describing the ability of the molecules to be polarised by the electric field36.
Therefore, to use microwave heating in organic reactions it is important to pay attention to the solvent used in the reaction mixture as for example:
i) organic solvent with higher tan is required to converts, efficiently, microwave energy into thermal energy
ii) higher chemical stability and inertness to minimise side reactions
iii) high boiling point for reactions that are to be carried out at atmospheric pressure 35.
An efficient choice of solvent, for reactions in microwave, should conjugate the dielectric loss values based on the general rules of synthetic organic chemistry, such as protic and aprotic solvent, to develop the specific conditions to optimize the synthesis 36.
2.3.2
Characterisation of compounds synthesised
1
HNMR spectra were recorded at 400 MHz on a Bruker AMX-400 instrument in deuterated chloroform (CDCl3) with chemical shift values ( ) reported in parts per million (ppm) downfield from
tetramethylsilane (TMS) and coupling constants (J) in Hertz (Hz). 13C NMR spectra were obtained at 101 MHz in CDCl3. FTIR spectroscopy was recorded on a PerKin-Elmer Spctrum BX apparatus,
using NaCl discs as support for the sample. The measurements were carried out in the wave number range from 400 to 4000 cm-1 accumulating 128 scans having a resolution of 4 cm-1. Elemental analyses were performed with a Thermo Finnigan-CE Flash EA 1112 CHNS series analyser. Melting points were determined with a capillary apparatus (Buchi 530), and are uncorrected.
2.3.3
Preparation of PDLC films by the PIPS method
The optimised conditions used in photochemical and thermal polymerisation such curing temperature, UV light intensity, time of polymerisation and proportions of monomer and E7 in mixtures were previously studied by the research group. The results of that complementary work that used several commercial monomers were adopted for preparation of PDLC films with monomers synthesised in this work.
For the preparation of PDLC films, mixtures of monomer and E7 with weight ratios of 30% and 70%, respectively, and 1% by weight with respect to the monomer mixture of AIBN or 1% of DMPA for thermal and photochemical polymerisations, respectively, were mixed together at room temperature until the mixture became homogeneous. Samples were prepared by introducing the mixtures into a 20 m ITO cell by capillarity action. Polymerisations reactions occur directly in the ITO cell. Schematic representation for preparation of PDLC is show in figure 2.3.
2.3.3.1
Photochemical polymerisation
The photochemical polymerisation were carried out using Oriel 60115 equipment, with a 100W mercury medium pressure lamp powered by an Oriel 68800. The lamp is cooled by a water circuit and a rotary fan. The 366 nm UV light emission is selected by the following four filters:
• A water filter that absorbs at wavelengths higher than 2800 nm; • A glass filter that absorbs at wavelengths lower than 300 nm; • A BG3 filter that transmits at wavelengths between 250 and 500 nm; • A Filter that transmits at wavelengths between 360 and 370 nm.
Photochemical polymerisation was achieved by exposing the cells filled with the mixture to UV radiation for 2000 s. All photochemical polymerisations were carried out at room temperature and an incident light intensity of 3.91x10-05Nh min-1.
2.3.3.2
Thermal polymerisation
The thermal polymerisation were carried out in a handmade oven. This oven has an auto-tune temperature controller provided by CAL Controls, model CAL 3300, with a resistance thermometer, Pt100/RTD-2, whose sensor range takes temperature in the interval -200 to ~400ºC. The cells filled with the mixture were kept isothermally for 8 hours at 74ºC.
2.3.4
Gel permeation chromatography
Synthetic polymers are not constituted by macromolecules of only one single molecular weight but are composed of macromolecules having a distribution of molecular weight. Size exclusion chromatography (SEC) is an important method for the determination of molecular weights (Mn and
Mw) 40
. It is a type of liquid chromatography that separates molecules according to sizes. In other words in SEC the separation is not done by chemical interaction of the dissolved analyte molecules with the stationary phase but through the differences in volume of the polymers associated with their different molecular weights41. Substrates consist of materials with pore sizes between 5 nm and 500 nm and an SEC with a gel as the substrate is also called gel permeation chromatography (GPC).
In polymer science, the number average molecular weight (Mn) follows the conventional definition for
Where Mi is the molecular weights of a chain and Ni is the number of chains of that molecular weight.
This average is only sensitive to the number of molecules present. However, polymers are composed of macromolecules of similar structure but different molecular weight. Generally, individual polymer chains rarely have exactly the same degree of polymerisation and molar mass. There is a distribution around an average value. These types of materials are called polydisperse. As a consequence of this polydispersity molecular weights are mean values only. The polymer properties depend not only on the number of polymer molecules but also on the size or weight of each polymer molecule. For a more complete characterisation it is necessary to consider the chain length distribution. This parameter is given by the weight average molecular weight (Mw) and is defined by:
Compared to Mn, Mw takes into account the molecular weight of a chain in determining contributions
to the molecular weight average40. The polydispersity index (PDI) is a simple measure of the width of a molecular weight distribution and is given by 41:
Gel permeation chromatography was performed on a Knauer system equipment with a HPLC Smartline Pump 1000, a light scattering detector PL-ELS 1000m and a Smartline Autosampler 3800 and controlled by Clarity and PL-ELS GPC software. Dimethylformamide (DMF) as used as eluent at a flow rate of 1mL min-1 on a Plus Pore 7.5 mm ID column at 85ºC. The detectors alignment and instrument sensitivity parameters were previously calibrated using a molecular weight distribution polystyrene standard. For the calibration of the GPC column was used a calibration curve which correlates the elution time with the logarithm of the polystyrene standard molecular weight,ln M.
monomer because of its well-known action as a reactive solvent in polymerisation systems 42. For the preparation of samples for GPC analysis, monomers and glycidyl methacrylate with weight ratios of 50:50 with 1% of initiator, AIBN or DMPA, depending on whether thermal or photochemical polymerisation was used, were placed between two KBr disks. After polymerisation these discs were immersed into water in order to dissolve the KBr. The resulting materials were dried under vacuum for 24 hours and used without purification. All sample solutions were prepared from about 0.5 mg of material dissolved in 1 mL of DMF. Then, the mixtures were filtered through a 0.20 m pore size membrane prior to the injection of a volume of 150 L the GPC column.
2.3.5
Scanning Electron Microscopy (SEM)
Scanning Electronic Microscopy provides images of the morphology of the polymeric matrix, of composites of liquid crystal with polymers, and allows their characterisation through parameters such as the size and the shape of voids that accommodate the liquid crystal. As mentioned before, the quantity, shape and size of LC domains in the polymer matrix have an influence on the optical properties of the composites. The scanning electron microscope has many advantages over traditional microscopes. The SEM has a grater depth of field, which allows more of a specimen to be in focus at once. The SEM also has much higher resolution images, so closely spaced specimens can be magnified at much higher levels. This technique is the most used of the surface analytical techniques41.
For SEM studies of the polymeric matrix of PDLC films the conditions for the preparation of a PDLC film were reproduced but instead of the thermal or photo-polymerisation of mixtures occurring within the ITO cell, they took place between two KBr disks. After polymerisation these discs were immersed into water in order to dissolve the KBr. To extract the LC the samples were immersed into acetonitrile and then the remaining polymer matrix was dried under vacuum for 24h. The resulting samples were mounted on aluminium stubs carbon cement (D-400, Neubaeur Chemikalien) and a thick gold coating was deposited using a dual ion beam sputter coating apparatus. The measurements were obtained on a SEM Hitachi S-2400 instrument with a Rontec standard energy dispersive x-ray spectroscopy (EDS) detector.