Catarina Isabel Cabral de Carvalho e Melo
Simões Barbosa
Mestre em Engenharia Química e Bioquímica
Carbon Dioxide Hydrogenation Towards
Methane with Ruthenium Nanoparticles
in Ionic Liquid Media
Dissertação para obtenção do Grau de Doutor em Química Sustentável
Orientador:
Dr.ª Ewa Bogel-Łukasik, Investigadora
Auxiliar, FCT-UNL
Co-orientador:
Prof. Dr. Manuel Nunes da Ponte,
Professor Catedrático, FCT-UNL
Júri:
Presidente: Prof. Doutor José Paulo Barbosa Mota
Arguentes: Prof. Doutor Carlos Manuel Faria de Barros Henriques Prof. Doutora Lúcia Raquel Brandão Moreira
Vogais: Prof. Doutor Luís Alexandre Almeida Fernandes Cobra Branco Prof. Doutora Ana Maria Staack Reis Machado
Prof. Doutora Ewa Bogel-Łukasik
iii Copyright © Catarina Isabel Cabral de Carvalho e Melo Simões Barbosa, FCT-UNL, UNL
A Faculdade de Ciências e Tecnologia e a Universidade Nova de Lisboa têm o direito, perpétuo e sem limites geográficos, de arquivar e publicar esta dissertação através de exemplares impressos reproduzidos em papel ou de forma digital, ou por qualquer outro meio conhecido ou que venha a ser inventado, e de a divulgar através de repositórios científicos e de admitir a sua cópia e distribuição com objetivos educacionais ou de investigação, não comerciais, desde que seja dado crédito ao autor e editor.
v
vii
A
CKNOWLEDGMENTSDuring the course of a doctoral thesis many are the challenges that we are faced with. Those could never be overcome without the contribution of the following people that I would like to thank:
First, to Professor Manel Nunes da Ponte, for receiving me in his laboratory as part of his group since the beginning of my master thesis. For all the support and wise guidance that he provided me all along these years, a wa
rmful thank you.
To Dr. Ewa Bogel-Łukasik, my supervisor, who granted me the opportunity and encouraged me to embark into the PhD journey.
To Dr. Luís Branco, for the availability and all the time spent with this project. This work would not be the same without all the advices and ideas suggested.
To all students that worked with me in this project, Joana Afonso, Patricia Marques, Anna Szczepańska and Duarte Rente. Thank you all for your company, hard work and dedication.
To Portuguese Foundation for Science and Technology for funding my PhD through grant SFRH/BD/85593/2012.
To the project “SunStorage-Harvesting and storage of solar energy”, with reference POCI- 01-0145-FEDER-016387, funded by European Regional Development Fund (ERDF), through COMPETE 2020-Operational Programme for Competitiveness and Internationalisation (OPCI), and by national funds (PTDC/QEQ- QFI/1971/2014), through FCT-Fundação para a Ciência e a Tecnologia.
To Dr. Ana Reis Machado and Sofia Messias, (aka Messi, aka Mrs Fugas) for all the help provided with GC analysis of my gas samples.
To Andreia Forte, who provided me with helpful tips and material from photochemistry lab necessary for the synthesis of my ILs.
viii
To all my lab colleagues, “old” and “new”, for their companionship and collaboration in the lab’s daily base problems. Unfortunately, I cannot mention you all, but I’ll leave a few honourable mentions: Maria Romeu, “Clarainda” Costa, Paninho, Raquel, Filipa, Mia, Rita Gameiro, Ana Nunes, Teresa Casimiro and Gonçalo Carrera.
Last, but certainly not least, my family. You provided me with all the love and moral support necessary to finish this thesis. A special thanks to Alix, my husband and love of my live, who financially supported this last months of thesis writing, and pressured me to finish this (I wonder why?). I wobe u beri maxe! To my kids, Tálio (Tl) and Túlio (Tm) for being cutest elements ever!
Finally, to my mother and grandmother, who both saw the start of this journey but weren’t able to accompany me to its end. I miss you. You were the people who raised and made me you I am today.
ix
R
ESUMOO dióxido de carbono (CO2) é um gás de estufa de grande impacto ambiental cujas emissões continuam a subir a cada ano. Imensa investigação é feita para desenvolver métodos de captura e utilização deste composto. No âmbito da utilização, a aplicação de CO2 na produção de combustíveis é uma estratégia bastante atrativa.
Este trabalho focou-se no desenvolvimento de um processo onde líquidos iónicos são utilizados na síntese e estabilização de nanopartículas metálicas, que, num meio bifásico de CO2+H2/LI, vão catalisar a hidrogenação de CO2 em metano.
Durante este trabalho sintetizaram-se de uma forma simples e in situ nanopartículas de ruténio com um diâmetro médio entre os 1,6-2,9 nm capazes de converter CO2 em metano com uma seletividade de 100%. Estas reações foram realizadas a 150℃, temperaturas bastante baixas neste tipo de processo. O desempenho das reações foi avaliado a partir dos seus rendimentos. O estudo dividiu-se nas seguintes partes:
Otimização, onde diferentes condições de reação foram testadas, tais como: o tipo de precursor e a sua quantidade; temperatura e duração de reação e a proporção dos reagentes.
Estudo do efeito de vários líquidos iónicos diferentes, na sua maioria fluorados de base imidazólica, onde se verificou que o desempenho da reação dependia principalmente da estabilização das nanopartículas. Esta foi favorecida pela presença de longas cadeias alquílicas no catião e de cadeias fluoradas laterais no anião. O nonaflato de 1-octil-3-metilimidazólio, [C8mim][NfO], apresentou o melhor desempenho com 84,4% de rendimento. Ao utilizar aniões de baixo volume molar, a forte coordenação destes levou a uma mudança da seletividade, formando-se monóxido de carbono.
Estudo da reciclabilidade, onde foi possível reutilizar o sistema, havendo uma pequena desativação no fim de cada reutilização causada pela agregação de NPs e acumulação de água no sistema. No geral esta reação apresenta potencial parar ser implementada num processo em contínuo.
xi
A
BSTRACTCarbon dioxide (CO2) is a greenhouse gas of major environmental impact whose emissions continue to rise each year. Extensive research is being done to develop methods of capturing and utilization. Regarding CO2 utilization, its application towards fuel production is a very attractive strategy.
This work focuses on the development of a chemical process that converts CO2 into methane. This process aims at using ionic liquids in the synthesis and stabilization of metal nanoparticles that catalyse CO2 hydrogenation in a biphasic CO2+H2/IL medium.
In this work ruthenium nanoparticles with a mean size between 1.6-2.9 nm were synthesized in-situ through a simple and straightforward process. These nanoparticles can convert CO2 into methane with a selectivity of 100%. These reactions were carried out at temperatures of 150℃
and below, a very low value for this kind of process. Reaction performance was assessed though its yield. The study was divided into three main parts:
Optimization, where different reaction conditions were tested such as: type and quantity of precursor; temperature and duration of reaction; and reactant ratio.
Study on the effect of several ILs, mostly imidazolium based with fluorinated anions, where it was observed that reaction performance depended mainly on nanoparticle stabilization. This was favoured by the presence of long alkyl chains in the cation and fluoride chains in the anion. 1-Octyl-3-methylimidazolium nonaflate, [C8min][NfO], presented the best results with 84.4% yield. When using low molar volume anions, their strong coordination led to a change of selectivity, towards the formation of carbon monoxide.
Recyclability study, where it was possible to reuse the system, although the catalyst slightly deactivated after each reuse due to nanoparticle aggregation and water accumulation in the system. Overall, this reaction reveals potential for implementation in a continuous process.
xiii
T
ABLE OFC
ONTENTSAcknowledgments ... vii
Resumo ... ix
Abstract ... xi
Table of Contents ... xiii
List of Figures ... xvii
List of Tables ... xxiii
List of Symbols and Abbreviations ... xxv
Chapter 1 – Scope of the Thesis and General Introduction ... 1
1.1 Scope of the Thesis ... 1
1.2 CO2 Emissions... 2
1.3 CO2 Mitigation ... 3
1.4 CO2 Utilization ... 5
1.4.1 CO2 conversion into fuel ... 6
1.5 Power to Gas Technology ... 7
1.6 CO2 Methanation ... 8
1.7 High Pressure CO2 ... 9
1.8 Ionic Liquids ... 11
1.9 Nanoparticles ... 13
Chapter 2 – Experimental Section ... 15
2.1 Description of the Apparatus ... 16
2.2 Materials and Methods ... 19
2.2.1 Reactants ... 19
2.2.2 Catalysts ... 19
2.2.3 Solvents ... 19
2.2.4 Ionic liquids ... 20
2.2.5 Other materials and compounds ... 27
2.2.6 CO2 hydrogenation protocols ... 28
Screening catalytic tests ... 28
CO2 hydrogenation with homogeneous catalysts ... 28
CO2 hydrogenation with Ru nanoparticles ... 29
Nanoparticle synthesis ... 29
Catalyst recyclability study ... 30
xiv
Gas chromatography analysis ... 30
Transmission electron microscopy analysis ... 31
Nuclear magnetic resonance ... 32
UV-vis spectroscopy ... 32
Morphological analyses ... 32
Karl-Fisher titration ... 32
Differential scanning calorimetry ... 32
2.3 Reactor Calibration ... 33
2.3.1 Determination of the apparatus volume ... 33
2.3.2 Reaction yield ... 36
Calculation of the amount of hydrogen loaded into the reactor, 𝒏𝑯𝟐𝒊 ... 36
Calculation of the amount of methane formed in the in the reactor, 𝒏𝑪𝑯𝟒𝒇 ... 37
Calculation of the mole fraction of CH4 in the gas mixture, 𝒚𝑪𝑯𝟒𝒇 ... 38
Calculation of the amount of CO2 loaded in the reactor ... 39
Calculation of the amount of CO formed in the in the reactor, 𝒏𝑪𝑶𝒇 ... 45
2.3.3 Reactor with strong stirring system ... 46
2.3.4 Turn over number ... 50
2.3.5 Carbon dioxide conversion ... 50
Chapter 3 – Results and Discussion ... 51
3.1 Introductory Work ... 51
3.2 Optimization Reactions ... 57
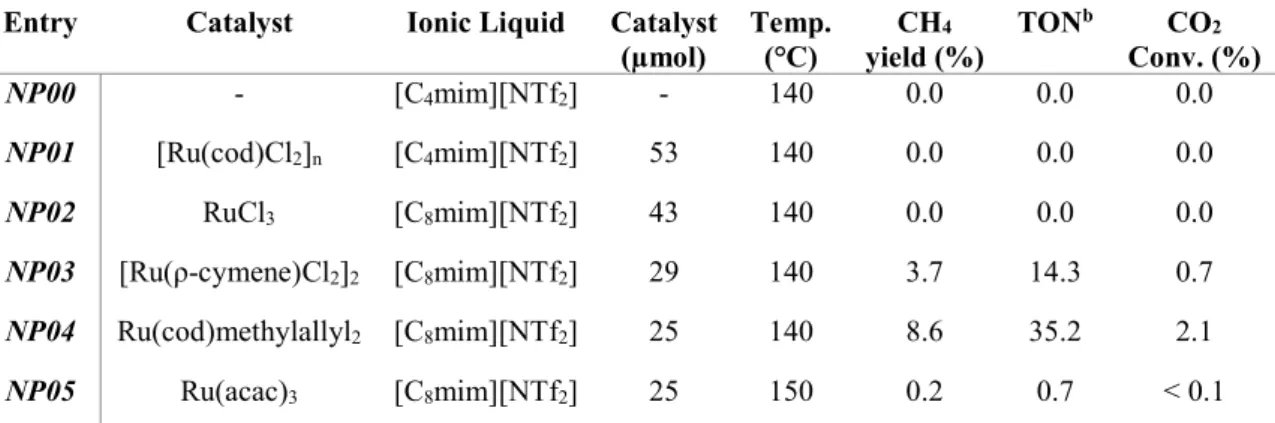
3.2.1 Catalyst ... 57
3.2.2 Temperature ... 59
3.2.3 Time of reaction ... 61
3.2.4 Pressure gas ratio ... 61
3.2.5 Summary ... 63
3.3 Catalyst Identification and Characterization ... 64
3.3.1 UV/vis studies ... 64
3.3.2 DLS ... 70
3.3.3 Morphology ... 70
3.3.4 TEM ... 71
3.4 Additional Studies ... 72
3.4.1 Stirring ... 72
xv
3.4.3 NPs synthesis... 73
3.5 Study of the Effect of different Ionic Liquids on reaction yield ... 75
3.5.1 Cation effect ... 76
Alkyl chain length ... 76
Imidazolium’s ring C2 protection ... 78
Other cations ... 80
3.5.2 Anion effect ... 81
3.6 Catalyst Recycling ... 89
3.6.1 1st reutilization test ... 89
3.6.2 2nd reutilization test ... 92
3.7 Screening Tests ... 95
Chapter 4 – Conclusions and Future Perspectives ... 99
References ... 101
Appendix A. NMR spectra of the synthesized Ionic liquids. ... 109
Appendix B. DSC of ILs solid at room temperature ... 123
Appendix C. Calibration certified of the hydrocarbon gas mixture used to calibrate GC-TCD of GC1 ... 125
Appendix D. Calibration curves used in GC2 ... 127
xvii
L
IST OFF
IGURESFigure 1.1. Scheme of CO2 methanation ... 2
Figure 1.2. Annual mean of CO2 atmospheric levels collected by NOAA-ESRL at the Mauna Loa observatory, Hawaii. CO2 concentrations are expressed in mole fraction in dry air, abbreviated as ppm [10]. ... 3
Figure 1.3. Schematics of Power-to-Gas process. ... 8
Figure 1.4. Phase diagram of CO2. ... 10
Figure 1.5. Common cations and anions of ionic liquids. ... 11
Figure 2.1. Schematics of the hydrogenation apparatus: (RZ) reaction zone, (EZ) expansion zone, (CZ) capture zone, (C) CO2 compressor, (R) reactor, (OB) oil bath, (MS) magnetic stirrer, (PT) pressure transducer, (M) manometer, (EV) expansion vessel, (CB) cooling bath, (CV) capture vessel, (v-1 to v-10) valves. ... 16
Figure 2.2. Picture of the reactor. From the right to the left: head of the reactor with a dip tube, cylinder, split ring closure rings with bolts, drop band. ... 17
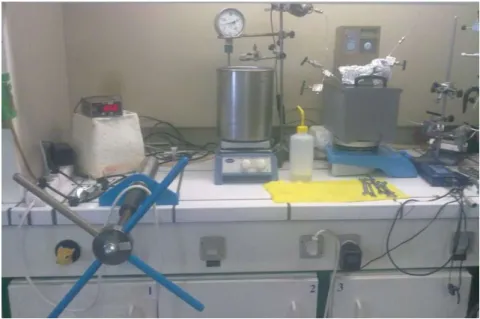
Figure 2.3. Picture of the reaction apparatus. ... 18
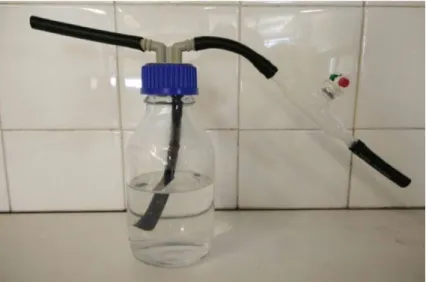
Figure 2.4. Picture of the trap used to capture gas sample in method 2 of GC analysis. ... 31
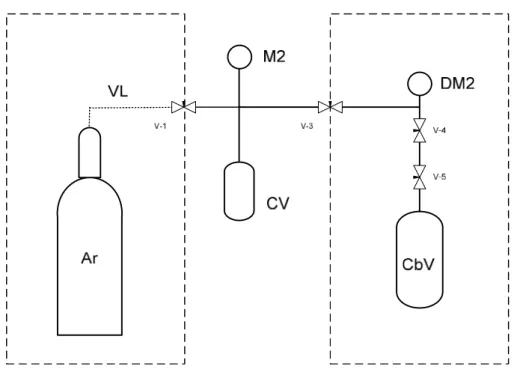
Figure 2.5. Schematics of the calibration of the reactor: (Ar) argon bottle, (VL) Argon inlet and vacuum line, (PT) pressure transducer, (R) reactor, (DM2) digital manometer, CbV calibration vessel, (v-1 to v-5) valves. ... 34
Figure 2.6. Schematics of the calibration of the capture vessel. (Ar) argon bottle, (VL) Argon inlet and vacuum line, (CV) capture vessel, (M2) manometer, (DM2) digital manometer, CbV calibration vessel, (v-1 to v-5) valves. ... 34
Figure 2.7. Schematics of the calibration of the expanse vessel. (Ar) argon bottle, (VL) Argon inlet and vacuum line, (M1) manometer, (EV) expansion vessel, (DM2) digital manometer, CbV calibration vessel, (v-1 to v-5) valves. ... 35
Figure 2.8. Schematics of reaction zone, where the screw injector is assembled to the apparatus: (C) CO2 compressor, (R) reactor, (OB) oil bath, (MS) magnetic stirrer, (PT) pressure transducer, (M3) manometer, (SI) screw injector, (v-1, v-7 to v-12) valves. ... 40
Figure 2.9. Picture of the screw injector assembled to the apparatus... 40
Figure 2.10. Pressure (bar) vs amount of CO2 (mol) for the system where initially 40 bar of H2 were introduced in the reactor. (), data values with the reactor in a 40°C bath; (), data values with the reactor in a 140 °C bath. ... 41
Figure 2.11. Pressure (bar) vs amount of CO2 (mol) for the system where initially 60 bar of H2 were introduced in the reactor. (), data values with the reactor in a 40°C bath; (), data values with the reactor in a 140°C bath ... 41
xviii
Figure 2.13. Graphic representing corrected values of 𝑥𝑇𝐶𝑂2 ∙ 𝑃′𝐶𝑂2 vs 𝑦′𝐶𝑂2 ∙ 𝑃′𝐶𝑂2. ()
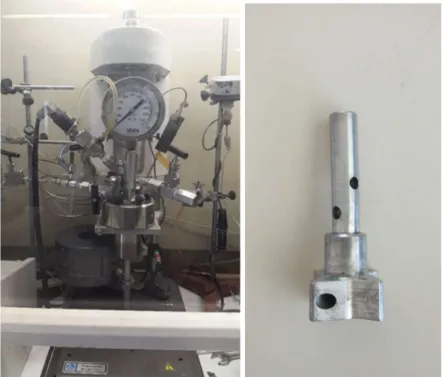
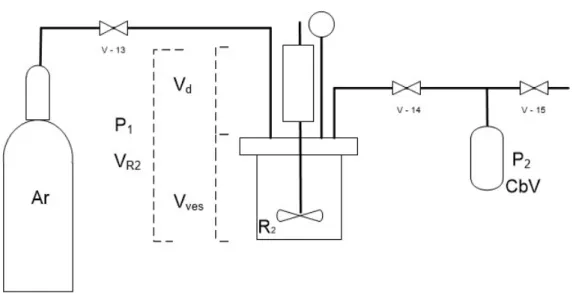
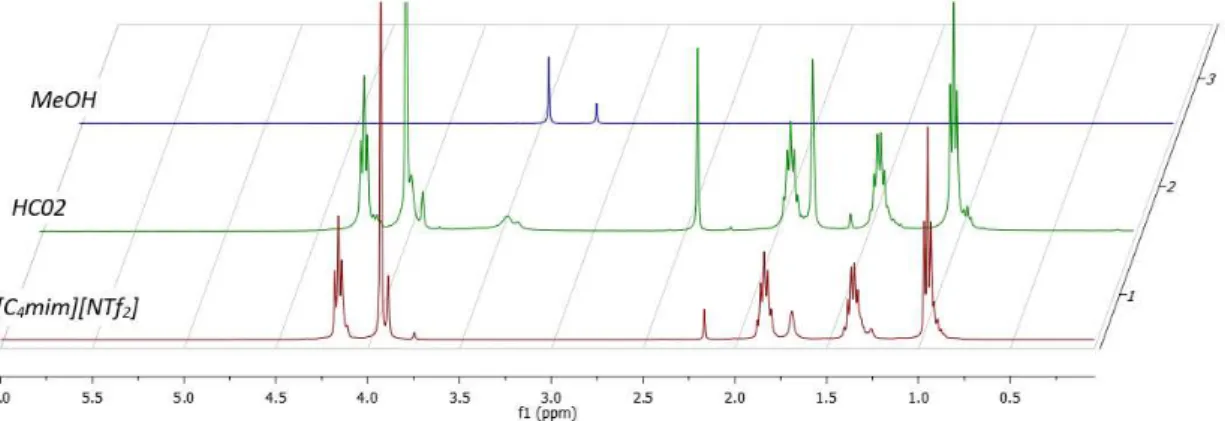
values calculated from experimental data () value calculated from literature data [90] ... 45 Figure 2.14. Photograph of the series 4591 micro Parr reactor installation on the left; picture of the stirring mixer. ... 47 Figure 2.15. Scheme of the calibration installation of the 4591 micro Parr reactor. (Ar) argon bottle, (R2) Parr reactor, (PT) pressure transducer, (CbV) calibration vessel, (v-11 to v-13) HIP valves, (VR2) volume of the reactor, (Vves) Volume of the vessel, (Vd) volume inside the drive, (P1) Pressure inside the reactor, (P2) pressure inside the calibration vessel. ... 48 Figure 3.1. 1H NMR (400 MHz, CDCl3) spectrum of reaction mixture of HC02 liquid sample compared with the ionic liquid before reaction and methanol spectra. ... 52 Figure 3.2. 1H NMR (400 MHz, CDCl3) spectra of reaction mixtures HC06 and HC07 liquid sample compared with toluene and methylcyclohexane spectra. ... 53 Figure 3.3. 1H NMR (400 MHz, CDCl3) spectra of reaction mixtures HC08 and HC09. ... 54 Figure 3.4. Picture of a generic reaction sample containing only Ru(cod)methylallyl2 as
precursor and [C4mim][NTf2] as IL. a) sample before reaction; b) sample after reaction. ... 55 Figure 3.5. Effect of the amount of Ru precursor in CO2 methanation yield at 150 ℃ using [C8mim][NTf2] as solvent. ... 58 Figure 3.6. Effect of reaction temperature in CO2 methanation yield using 25 μmol of
Ru(cod)methylallyl2 as precursor and [C8mim][NTf2] as solvent. ... 60 Figure 3.7. Picture of samples B1 (Ru(cod)methyallyl2 in [C4mim][NTf2], freshly prepared) and B4 (Ru(cod)methyallyl2 in [C4mim][NTf2], 2 days old). ... 64 Figure 3.8. UV/vis spectra of blank samples along time in [C4mim][NTf2]. ... 65 Figure 3.9. UV/vis spectra of blank samples of in [C8mim][NTf2] ... 65 Figure 3.10. UV/vis spectra of samples of Ru nanoparticles reduced at 4 bar of H2 and 50°C in [C4mim][NTf2] with different times of reduction. ... 66 Figure 3.11. UV/vis spectra of samples of Ru nanoparticles reduced at 4 bar of H2 and 50°C in [C8mim][NTf2] with different times of reduction. ... 67 Figure 3.12. UV/vis spectra of samples of Ru nanoparticles reduced at 60 bar of H2 and 50°C in [C4mim][NTf2] with different times of reduction. ... 67 Figure 3.13. UV/vis spectra of samples of Ru nanoparticles reduced at 60 bar of H2 and 50°C in [C8mim][NTf2] with different times of reduction. ... 68 Figure 3.14. Comparison between UV/vis spectra of blank sample and reaction samples in [C4mim][NTf2]. ... 68 Figure 3.15. Comparison between UV/vis spectra of blank sample and reaction samples in [C8mim][NTf2]. ... 69 Figure 3.16. Morphologi G3 images of sample NP07 reaction mixture, 75 μmol of
xix Figure 3.17. TEM micrograms and histograms showing the size distribution of Ru(0) NPs generated with 100 μmol of Ru(cod)methuallyl2 in [C8mim][NTf2] at 150 ℃ for 24h with a pressure ratio of 1:1 of H2:CO2. , sample NP08. ... 71 Figure 3.18. Solubility of CO2 in [C8mim][NTf2] and C4mim based ionic liquid with different anions at 40 ℃: [NfO];[104] [DCA], [CTf3], [NTf2], [BF4], [OTf] and [PF6];[91] [TFA][105] and [MeSO3].[106] ... 75 Figure 3.19. Effect of the size of the alkyl size chain of the cation of the IL used as solvent for CO2 methanation ... 77 Figure 3.20. TEM micrograph and histogram showing the size distribution of Ru NPs generated in [C4mim][NTf2]. ... 77 Figure 3.21. TEM micrograph and histogram showing the size distribution of Ru NPs generated in [C4dmim][NTf2], sample NP36. ... 79 Figure 3.22. Photographs of sample NP38 after reaction. ... 82 Figure 3.23. Photographs of sample NP40 after reaction. ... 83 Figure 3.24. TEM images of Ru NPs generated in [C8mim][OTf], sample NP42. ... 83 Figure 3.25. TEM micrograph and histogram showing the normal size distribution of Ru NPs generated in [C8mim][NfO], sample NP44. ... 84 Figure 3.26. TEM and histogram showing the size distribution of Ru NPs generated in
[C8mim][CTf3], sample NP46. ... 85 Figure 3.27. Gas Chromatograph of gas sample taken from CO2 hydrogenation in Ru
NPs/[C4mim][MeSO3]. Peaks observed: H2, RT=2.94 min.; O2 (traces), RT=4.77 min.; N2 (traces), RT=4.97 min.; CO, RT=6.13 min.; CO2, RT=37.86 min. ... 85 Figure 3.28. TEM micrograph and histogram of Ru NPs generated in [C8mim][MeSO3], sample NP48. ... 86 Figure 3.29. TEM micrograph and histogram showing the size distribution of Ru NPs generated in [C8mim][TFA], sample NP50. ... 86 Figure 3.30. TEM micrograph and histogram showing the size distribution of Ru NPs generated in [C8mim][PFO], sample NP52. ... 87 Figure 3.31. CO2 methanation yield of the recyclability study for Ru(0) NPs in [C8mim][NTf2] system. ... 90 Figure 3.32. Time-line of the recyclability study for the Ru(0) NPs in [C8mim][NTf2] system. 91 Figure 3.33. CO2 methanation yield of the recyclability study for the Ru(0) NPs in
[C8mim][NfO] system. ... 93 Figure 3.34. TEM micrographs of sample NP52 at the right (Ru NPs in [C8mim][NfO] after one reaction) and sample CR12 in the right (Ru NPs in [C8mim][NfO] after 6 hydrogenation
xx
Figure 3.36. Chromatogram of entry ST11 provided by channel 1, method 1. 1st peak
corresponds to H2, 2nd peak corresponds to CH4. ... 95 Figure 3.37. Chromatogram of entry ST11 provided by channel 2, method 1. 1st peak
corresponds to CO2... 96
Figure A.1. 1H NMR spectrum of [C
4mim][NfO]. ... 109 Figure A.2. 13C NMR spectrum of [C4mim][NfO]. ... 109 Figure A.3. 19F NMR spectrum of [C4mim][NfO]. ... 110 Figure A.4. 1H NMR spectrum of [C
8mim][NfO]. ... 110 Figure A.5. 13C NMR spectrum of [C8mim][NfO]. ... 111 Figure A.6. 19F NMR spectrum of [C8mim][NfO]. ... 111 Figure A.7. 1H NMR spectrum of [C
4mim][CTf3]. ... 112 Figure A.8. 13C NMR spectrum of [C4mim][CTf3]. ... 112 Figure A.9. 19F NMR spectrum of [C4mim][CTf3]. ... 113 Figure A.10. 1H NMR spectrum of [C
8mim][CTf3]. ... 113 Figure A.11. 13C NMR spectrum of [C
8mim][CTf3]. ... 114 Figure A.12. 19F NMR spectrum of [C8mim][CTf3]. ... 114 Figure A.13. 1H NMR spectrum of [C
4mim][MeSO3]. ... 115 Figure A.14. 13C NMR spectrum of [C4mim][MeSO3]. ... 115 Figure A.15. 1H NMR spectrum of [C8mim][MeSO3]. ... 116 Figure A.16. 13C NMR spectrum of [C
8mim][MeSO3]. ... 116 Figure A.17. 1H NMR spectrum of [C4mim][TFA]. ... 117 Figure A.18. 13C NMR spectrum of [C4mim][TFA]. ... 117 Figure A.19. 19F NMR spectrum of [C4mim][TFA]. ... 118 Figure A.20. 1H NMR spectrum of [C
8mim][TFA]. ... 118 Figure A.21. 13C NMR spectrum of [C8mim][TFA]. ... 119 Figure A.22. 19F NMR spectrum of [C4mim][TFA]. ... 119 Figure A.23. 1H NMR spectrum of [C
4mim][PFO]. ... 120 Figure A.24. 13C NMR spectrum of [C4mim][PFO]. ... 120 Figure A.25. 19F NMR spectrum of [C4mim][PFO]. ... 121 Figure A.26. 1H NMR spectrum of [C
xxii
xxiii
L
IST OFT
ABLESTable 2.1 List of commercial ILs used. ... 20 Table 2.2. List of commercial ILs used for synthesis of new ILs. ... 22 Table 2.3. List of synthesized ILs. ... 22 Table 2.4. Calibration volumes. ... 35 Table 2.5 Mass (g) of 12 random glass vials used in hydrogenation reaction. ... 37 Table 2.6. Experimental data output for CO2 quantification tests. ... 42 Table 2.7. Amount of gas calculated in the gas phase for 𝑃𝑖𝐻2= 40 bar and 𝑃′𝐶𝑂2 = 40 bar at 40 °C. ... 44 Table 2.8. Data for CO2 quantification, 𝑦𝐶𝑂2. 𝑃′𝐶𝑂2 and 𝑥𝑇𝐶𝑂2. 𝑃′𝐶𝑂2 values after
implementing of the correction factor. ... 44 Table 2.9. Experimental values for P1 and P2. Calculated values for VR2. ... 48 Table 3.1. CO2 hydrogenation with homogeneous catalysts, initial reactions.a ... 52 Table 3.2. CO2 hydrogenation with Ru(cod)methylallyl2 precursor and PPh3 ligand.a ... 53 Table 3.3. Conditions and results of the study on the effect of the catalyst on CO2 methanation.a ... 57 Table 3.4. Conditions and results of the on study of the amount of Ru precursor in CO2
methanation.a ... 58 Table 3.5. Summary of reaction results of CO2 methanation using the same conditionsa for error determination. ... 59 Table 3.6. Conditions and results of the study on the effect of the reaction temperature in CO2 methanation. ... 60 Table 3.7. Conditions and results of the study on the effect of the reaction time in CO2
methanation.a ... 61 Table 3.8. Conditions and results of the study on the effect of reactant pressure gas ratio in CO2 methanation.a ... 62 Table 3.9. Conditions and results of the study on the effect of stirring in CO2 methanation.a .... 72 Table 3.10. Examples of reaction conditions of CO2 methanation reactions where conversion did not occur.a ... 73 Table 3.11. Conditions and results of the study on the effect of water content in CO2
xxiv
xxv
L
IST OFS
YMBOLS ANDA
BBREVIATIONSCations:
[C2C1py] 1-ethyl-3-methylpyridinium
[C2mim] 1-ethyl-3-methylimidazolium
[C4(3)pz] 1-Butil-2,3,5-trimethylpyrazolium
[C4mim] 1-butyl-3-methylimidazolium
[C4dmim] 1-butyl-2,3-dimethylimidazolium
[C8mim] 1-methul-3-octylimidazolium
[C10mim] 1-decyl-3-methylimidazolium
Anions:
[Cl] Chloride
[CTf3] tris(trifluoromethanesulfonyl]methide/ triflide
[BF4] tetrafluoroborate
[MeSO3] methanesulfonate/mesylate
[NfO] nonafluoro-1-butanesulfonate / nonaflate
[NTf2] bis(trifluoromethylsulfonyl)imide
[OTf] trifluoromethanesulfonate/triflate
[PF6] hexafluorophosphate
[PFO] perfluorooctanoate
xxvi
Other Abbreviations:
Al2O3 alumina
Ar argon
CCD charged-coupled device
CCU carbon capture and utilization
CDCl3 deuterated chloroform
CDU carbon dioxide utilization
CH4 methane
CO carbon monoxide
CO2 carbon dioxide
DCM dichloromethane
DLS dynamic light scattering
DSC differential scanning calorimetry
EDS energy dispersive spectroscopy
GC gas chromatography
H2 hydrogen
HClO4 perchloric acid
IL/ILs ionic liquid/ ionic liquids
MeOH methanol
M-NPs metal nanoparticles
NMR nuclear magnetic resonance
NPs nanoparticles
xxvii PPh3 triphenylphosphine
R ideal gas constant
RuCl3 ruthenium chloride
Ru(acac)3 ruthenium(III) acetylacetonate
[Ru(cod)Cl2]n dichloro(1,5-cyclooctadiene)ruthenium(II), polymer
[Ru(ρ-cymene)Cl2]2 dichloro(p-cymene)ruthenium(II) dimer
Ru(cod)methylally2 bis(2-methylallyl)(1,5-cyclooctadiene)ruthenium(II)
SDS sodium dodecyl sulphate
Tc critical temperature
TCA trichloroanisole
TCD thermal conductivity detector
TEM transmission electron microscopy
TSIL task-specific ionic liquids
UV-vis ultraviolet-visible
1
Chapter 1
–
S
COPE OF THE
T
HESIS AND
G
ENERAL
I
NTRODUCTION
1.1
S
COPE OF THET
HESISIn this project we intend to explore the use of CO2 as a renewable source of carbon and we aim to convert it into fuels, preferably methane.
The reaction process was based in a continuous-flow hydrogenation of CO2 concept [1]. In our process CO2 hydrogenation reactions take place in the ionic liquid-rich phase on a biphasic IL+CO2/H2 system. The IL acts as a stationary phase where the catalyst is immobilized, and the reaction occurs. At high pressure, high-density CO2 facilitates H2 diffusion into the IL. The ILs negligible vapor pressure allows gas phase to dissolve in the liquid phase, while preventing liquid evaporation. The high thermal stability allows the use of ionic liquids at high reaction temperature without degradation. Furthermore, the implementation of ionic liquids in this process emulates a novel reactor concept that uses a liquid phase with high heat capacity for temperature control. The heat produced during the reaction is removed allowing the process to occur in isothermal conditions[2].
In the first stage of the work, commercial heterogeneous catalysts and Ru homogeneous were tested. Later we used a straightforward process where Ru(0) nanoparticles are formed and stabilized in-situ due to the steric and electrotactic properties of the IL to catalyse CO2 hydrogenation towards CH4. According to literature a similar process has been used for formic acid synthesis [3,4].
Reactions selectivity and activity were studied, and conditions of reaction optimized. We attempted to study nanoparticles properties and compare them with reactions outcome. ILs properties were also studied, in order to understand how they can promote or inhibit the reaction results and also how can they influence nanoparticle formation. The possibility of converting this reaction into continuous process was also studied.
2
Figure 1.1. Scheme of CO2 methanation
For the duration of this thesis, a total of four supervised students collaborated with the experimental work. Joana Afonso (Master student), assembled part the apparatus and preliminary tests, section 3.7. Patricia Marques (Bachelor student) followed initial reactor calibration and UV-Vis tests section 3.3.1. Anna Szczepańska (Erasmus student) contributed with part of optimizations tests, section 3.2, and finally Duarte Rente (Master student) participated in some IL tests (including IL synthesis) and the catalysts recycling study, sections 3.5 and 3.6. From this work resulted one peer reviewed article in ChemSusChem [5], two oral communications in international scientific symposia, and a second article is currently in preparation for submission.
1.2
CO
2E
MISSIONS3 in 2015 reached the alarming 400 ppm [9]. Nowadays (2018) concentrations surpassed 410 ppm [10].
Figure 1.2. Annual mean of CO2 atmospheric levels collected by NOAA-ESRL at the Mauna Loa
observatory, Hawaii. CO2 concentrations are expressed in mole fraction in dry air, abbreviated as ppm [10].
1.3
CO
2M
ITIGATIONLately, several efforts are being taken in account to mitigate CO2 emission. The United Nations Paris agreement [11] is a global action climate deal between 195 countries that strives for limiting global warming to well 2℃.
Technically, there are three main strategies for reducing the CO2 build-up in the atmosphere: reduction of the amount of CO2 produced; storage of CO2; and utilization of CO2 [12].
Reduction strategy consists simply in using the energy in a more efficient way and promoting energy conservation; resource to energy sources with low carbon fuels (natural gas instead of coal) or switching to non-fossil fuels such as hydrogen or renewable energies.
4
CCS methods can be classified as: pre-combustion capture, oxy-fuel process, and post-combustion capture [14].
In Pre-combustion capture, the fuel is pre-treated with oxygen before combustion to create syngas (CO and H2 mixture). The syngas will undergo water gas shift reaction with steam producing more H2 and CO2. The CO2 is later separated by cryogenic distillation or chemical absorption process [15].
In oxy-fuel combustion, nearly pure oxygen is used for combustion instead of ambient air, and this results in a flue gas that is mainly CO2 and H2O, which are separated by water condensation [16].
In Post-combustion capture the removal of CO2 is made from the flue gas produced after fuel combustion has taken place. This flue gas is usually at 1 atm, contains 10–15% of CO2 concentration by volume and inert gases [12]. It is primarily used in pulverized coal power plants and natural gas combined cycle power plants and it is considered the most important, since it is the most preferred. It is a more mature technology, and can easily retrofit into existing plants [17]. All this capture technologies are available in the market but are costly in general, and contribute to around 70–80% of the total cost of full CCS system including capture, transport and storage [18].
Commonly, CO2 separation is made through adsorption with a liquid solvent. Most traditional sorbents used are monoethanolamine (MEA), diethanolamine (DEA) and potassium carbonate. MEA aqueous solutions are found to be most efficient, with absorption that can reach over 90%[17]. However the process of amine regeneration after capture requires an immense amount of energy due to the use of high temperature (100-140ºC) [19]. Amine-based scrubbing systems indicate a parasitic power requirements of 22-30% of power plants output [20]. MEA corrosiveness, solvent degradation in the presence of oxygen and volatility of solvent contribute for environmental pollution [19]. Nowadays, solutions are intensively being researched and developed. Among several strategies we can enumerate the following: changing solvent concentration, the use of corrosion inhibitors, or using alternative sorbents like alternative alkanolamines, amino acid salts, sodium carbonate solutions, ammonia, blended solvents [18] the use of ionic liquids [19] and IL based compounds [21,22]. Calcium looping process is an emerging and low-cost process that may allow capture from atmospheric air based on carbonation/calcination of CaO [23].
5 transported in pipelines and injected at high pressure in underground geological formations. The main concerns about geo-sequestration are the environmental impact associated with the possibility of leakage and ocean acidification [14]. Furthermore, when stored in underground reservoirs CO2 plays nothing else more than the role of a waste.
These requests an alternative or at least complementing option, which send us to the third strategy mentioned previously, CO2 utilization.
1.4
CO
2U
TILIZATIONCarbon Dioxide Utilization (CDU), is a set of strategies that aims to use CO2 as a chemical feedstock in different applications as a means of helping to address climate change. CO2 can be used as solvent or working fluid. Supercritical CO2 is nowadays used industrially in processes such as decaffeination of tea or coffee beans or extraction of trichloroanisole (TCA) from cork. As a technological fluid it can also be used to enhance oil recovery or, as air conditioning coolant, dry washing, food preservation and in beverage industries [24,25]. All these processes are of direct use and require no CO2 conversion.
CO2 can also take the part of starting material, as a carbon building block to produce valuable-added compounds that can be applied in the chemical industry. It is a desirable source of C1 due to its abundancy, low price, nontoxicity and non-flammability. There are several methods used in CO2 conversion namely chemical, biochemical, photochemical and electrochemical conversion [24]. In this study we will focus on catalytic chemical synthesis. Nowadays, the most common use of CO₂ as a chemical feedstock is in the formation of urea, which is found in around 90% of the world’s fertilisers. Other compounds include carbamates, carbonates carboxylates, and biodegradable polymers [13,24]. However, it is obvious that conversion of CO2 into chemical products will not be the final answer for greenhouse effect, after all, even if CO2 was the starting material of all chemical compounds that could possibly be produced with it, only a small fraction of anthropogenic CO2 would be consumed. A total of 110 million tons of CO2 are used to produce chemicals, which corresponds to only 1% of the net annual anthropogenic release of CO2 (13000 million tons) [26].
6
storing hydrogen in a liquid form [28]. Formic acid can be obtained through CO2 hydrogenation, see equation 1. Synthesis of formic acid is one of the CO2 hydrogenation reactions that require less consumption of H2 and milder reaction conditions.
Currently it is still industrially produced by the carbonylation of methanol with carbon monoxide to methyl formate and the following hydration of the ester with water [29]. Recently, much research is made on CO2 conversion into formic acid using both heterogeneous and homogeneous catalysts [4,30–32].
1.4.1
CO
2 CONVERSION INTO FUELAlternatively demand of the energy sector always high and keeps rising. Converting CO2 back into fuels that can be reused in this sector could be the solution. This will not only reintegrate the CO2 captured back into the carbon cycle but also lower the use of fossil fuel. CO2 can be the starting material for potential fuels such as methanol, dimethyl ether, methane, and higher chain hydrocarbons. These products, however, would require great investment in infrastructures that would allow them to be stored and distributed in large scale.
Nowadays, methanol is mainly used as feedstock for a variety of chemicals. Noble prize winner, George Olah, proposed the “methanol economy” by defending methanol as best alternative to fossil fuels. He stated that hydrogen can be stored by CO2 conversion to MeOH, “a convenient liquid fuel and raw material for synthetic hydrocarbons and their products” [33]. Also mentions that it is an excellent fuel due to its capacity to be blended with gasoline, although it has half the volumetric energy density relative to gasoline or diesel. However, before being able to be used pure as fuel, issues like metal corrosion and/or cold engine start, still need to be solved [34].
Through CO2 hydrogenation, MeOH is most commonly obtained using catalysts that contain Cu and Zn as the main components together with different modifiers. Among noble-based catalyst, Pd is the most commonly used, exhibiting considerate activity and selectivity [35].
𝐶𝑂 + 𝐻 ↔ 𝐻𝐶𝑂𝑂𝐻 (1)
7 CO2 hydrogenation to methanol with heterogeneous often requires high temperature (>200℃) and/or high pressure (>50 bar). Homogeneous catalysts have been studied because they can operate at lower temperatures. Also hydrogenation reaction is entropically unfavourable, performing it at lower temperature would improve the overall theoretical yield [36].
Dimethyl ether (DME) is also an emergent chemical that can be used as fuels. It is considered a good alternative to diesel since it has high centane number, produces smoke-free combustion and quickly vaporizes in the engine [34]. It can be synthesised by the reaction of methanol produced by CO2 reduction [28]. This reaction is exothermic, is not affected by pressure. It is favoured at low temperatures.
1.5
P
OWER TOG
AST
ECHNOLOGYOne of the methods of CO2 conversion into fuels that employs renewable energy is Power-to-Gas (PtG). Although well established, renewable energies such as solar energy and wind energy are dependent on intermittent and floating sources and it is necessary to balance them to stabilize the energy network. PtG is a process that uses the surplus energy from renewable sources, and that otherwise would go to waste, and converts it into synthetic natural gas that can be injected in the gas grid and later used when energy demand is higher than renewables can supply. Methane can also be applied in transportation sector and heat production. The method uses the excess electricity in the electrolysis of water to generate H2. This H2 is used to reduce CO2 producing a gas mixture that mainly contains CH4 and H2O, that after treatment into a gas-rich gas can be added to the natural gas grid. [2,37,38].
8
Figure 1.3. Schematics of Power-to-Gas process.
The development and implementation of this type of technologies is becoming increasingly necessary. As an example, in March 2018, for the first time in decades Portugal’s renewable energy production exceeded demand on mainland (103.6%) [39]. However, due to the lack of a robust connected energy grid and/or storage solutions capable of satisfying the energy needs,the country was still dependent on fossil fuels and energy imports to balance supply energy [40].
1.6
CO
2M
ETHANATIONMethane is the main component of natural gas and it seems to be one of the most feasible options of CO2 conversion since it can be fed into the existing infrastructures of natural gas without any further investment.
Methane can be obtained through the complete reduction of CO2. This reaction is called CO2 methanation or Sabatier reaction since it was first discovered by Sabatier and Sanders [41].
CO2 methanation is a reversible reaction, highly exothermic and thermodynamically favourable [42], however, there are several kinetic limitations involved with the eight-electron process to reduce the fully oxidized carbon into methane [38,43,44].
9 Typically, temperature of reaction range between 200-450 °C depending on catalyst, support and reaction conditions [45]. Reaction temperature is a critical factor due to the exothermic nature of the reaction, a lower value improves the selectivity of the process towards methane production.
Despite the studies carried out on CO2 methanation, the exact reaction mechanism is not yet fully known. Two mechanisms have been proposed for the reaction. The first mechanism involves the formation of CO as an intermediate product through RWGS reaction, which is later converted into methane. The second mechanism involves the direct reaction of CO2 with H2 to form methane [42,46,47].
Industrially this process uses Nickel catalysts at high temperatures, due to this catalyst low cost and considerate activity [45]. However, Ni based catalyst can be deactivated even at low temperatures due to nickel particles sintering [42]. This contributed to the development of new metals catalyst.
A wide variety of other noble and non-noble metals have been widely studied as catalyst, such as Fe, Co, Cu, Pd, Rh, Ru, Pt, Mo, Re, Ag and Au. Among these, Ru reveals to be one of the most active and stable metals requiring lower reaction temperatures [43],[48].
Supported Ru and Rh catalysts are known to be more efficient that those based on Ni, but they are also increase the price of the process.
Research on CO2 methanation with Ru mainly focus on the catalyst support since catalytic activity greatly depends on the metal dispersion and support material [45]. Ceria is one of the materials that has been widely used, improving reaction rate at 250°C when added to Ru/Al2O3 catalyst [49]. Methanation of CO2 with Ce0.96Ru0.04O2 and Ce0.95Ru0.05O2 catalyst reached a conversion of 55% and 99% selectivity at 450 °C reaction temperature [50]. Zamani et al. [51] optimized Ru/Mn/Cu-Al2O3 preparation (10.9 wt.% of metal loading, 1035 °C calcination temperature and 5 wt.g of catalyst loading) for CO2 methanation at 220°C, obtaining a CO2 conversion value of 98.8%.
1.7
H
IGHP
RESSURECO
210
this state the interface between gas and liquid disappears and the density of the both phases becomes identical varying rapidly with temperature and pressure. The fluid exhibits gas-like transport properties (viscosities), liquid-like densities and diffusivities intermediate to that of a liquid and a gas. Furthermore, the capacity to dissolve organic compounds like a nonpolar solvent makes this kind of fluids a great alternative solvent for many applications.
Figure 1.4. Phase diagram of CO2.
Supercritical CO2 (scCO2) is the most widely used SCF due to its non-toxicity, relative inertness and nonflammability, while remaining abundant and inexpensive [54]. The solvent power of scCO2 can be easily tuned by small changes in both temperature and pressure. Due to these properties, CO2 is commonly considered as a “green solvent”. It has been widely studied as solvent for extraction and purification, chemical reactions, polymerizations, materials processing and particle formation [55].
11
1.8
I
ONICL
IQUIDSIonic liquids (ILs) are commonly defined as salts that are liquid at temperatures below 100ºC. Unlike common salts that are composed by inorganic ions, like chloride (Cl-) or fluoride (F-) and sodium (Na+) or potassium (K+) cations, ILs are generally composed of an organic cation and either an organic or an inorganic anion [59,60]. Those bulky organic ions usually possess a delocalized charge that causes disruption of crystal packing and reduction of the crystal lattice energy [61]. The weak interactions between these low-coordinated ions results in a reduction of melting point that can go low enough to make this kind of compounds liquid at room temperature (RTILs). Figure 1.5 illustrates some examples of the most common cations and anions constituents of ILs.
Figure 1.5. Common cations and anions of ionic liquids.
12
and can simultaneously dissolve organic and inorganic substances [63]. For these reasons they have been widely used as solvents for separation processes and chemical reactions. Nowadays ILs have already been tested as catalysts [64], reaction media [65], battery electrolytes, lubricants [66] and stabilizing media [67].
Solubility of CO2 can be significantly higher in ILs than in conventional organic liquids, even in the case of physical absorption. Furthermore, the low volatility of ILs allows a great dissolution of CO2 in the IL phase with no transference at all the IL in the gas phase.
As mention earlier, ILs have been recently tested as CCS solvents. The interest on CO2 capture from flue gases of power stations or from natural gas sources has promoted the study of task-specific ionic liquids with high absorption capacity of that gas [68,69] and highly selective solubility in relation to other gases, like nitrogen or methane [70]. The advantage of IL over the amines that are currently used for CO2 absorption is that they are much more amenable to in situ transformations, avoiding the high energy losses involved in the absorption-desorption cycles from amines. Research for CO2 capture involving ILs include the use the task specific ILs, IL-based solvents, membranes and polymers [22,71].
Mixtures of high pressure carbon dioxide and ILs were first used for green processing by Brennecke and collaborators [72]. Their initial works with imidazolium based ILs, a common kind of cation, allowed to understand that CO2 interaction with the anion is the main factor in which solubility depends on. In this study, the anions that presented stronger connection were the ones with fluoroalkyl groups in their structure, namely [OTf], [NTf2], and [CTf3]. The increase of the chain length of the cation also increases CO2 solubility; however, it is a much minor effect.
Thermal stability is also primarily related to the nature of the anion, accordingly with Papaiconomou at al [73] for every cation they studied the thermal stability follows the trend: [NTf2] > [NfO] > [OTf] > [DCA].
13 reactions in biphasic ionic liquid + supercritical CO2 mixtures. In their work, IL 1-butyl-3-methylimidazolium hexafluorophosphate was applied in for hydrogenation of alkenes and CO2.
1.9
N
ANOPARTICLESNanoparticles (NPs) are defined as any material with at least one dimension within 1-100 nm range size [76]. Due to their catalytic, optical, magnetic and electronic properties, fine metal particles in the nanometre size range have numerous applications in different fields such as chemical processes, medicine, biology, micro and nanoelectronics [77,78].
There are several methods of nanoparticle synthesis, however these can be classified into two main categories: top-down and bottom-up. In the top-down approach, the nanoparticles are formed by size reduction (usually through grinding) of metallic aggregates, this method being associated with high costs of synthesis and is limited to the formation of MNP's with 100 nm [77]. On the other hand, bottom-up approaches aim at the use of a molecular precursor as starting point, such as reduction of metal salts or the photolytic, sonolytic, or thermal decomposition of metal– organic precursors [79].
Nanoparticles have properties intermediate between bulk and single particles. One of the main advantages to use nanoparticles as catalysts is related with their high catalytic activity. However, these nanoparticles need to be stabilized against aggregation into larger particles and eventually bulk aggregates, in order to retain their catalytic activity. Aggregation occurs due to their extensively large surface area and the main means of their stabilization in solution utilizes electrostatic or steric protection.
14
Dupont et al reported [67] the use of alkylmethylimidazolium based ILs as suitable reaction media for the ruthenium nanoparticles production. Normally, imidazolium ILs reaction media provides both steric and electronic protection [83] to stabilize the Ru nanoparticles produced when the precursor is reduced by H2. In his work he formed Ru(0) NPs using Ru (II) precursors such as Ru(cod)methylally2 and ILs as well as mild conditions and was able to use them in hydrogenation reactions of arenes. In the case of Ru NPs, the size and shape is governed by the degree of self-organization of the imidazolium based IL in which they are generated: in general the more structured IL corresponds to smaller NPs [84].
15
Chapter 2
–
E
XPERIMENTAL
S
ECTION
This chapter contains a variety of information regarding the experimental work and is divided in tree main sections:
Section 2.1 describes in detail the apparatus that was designed and built from scratch for the execution of this work. All hydrogenating reactions (with one exception, see section 2.3.3 and 3.4.1) took place in this installation. Changes made to the apparatus during the work are also described in this section.
Section 2.2, named material and methods begins with the description of all compound and materials used for the work, giving a special emphasis to the ILs used. Among these ILs used, a total of 10 imidazolium ILs were synthesised. Their syntheses, NMRs and elemental analyses is also described in this section. After materials description, follows the protocols of different hydrogenation reactions executed in the installation described in section 2.1. These protocols are ordered chronologically. The final part of this section describes the analytical methods executed to the reaction samples during the work.
Section 2.3, named Reactor Calibration, describes all laboratory work and necessary calculations involved on the assessment of the reaction performance, most precisely, all work involved in the calculation the reactions yield. This work started with the simple determination of the apparatus volume. The second part contains all calculations and equations and methods that lead to the reaction’s yield of methane using the initial amount of H2 and the produced amount of CH4. Later it’s explained how the initial amount of H2 and final amount of CH4 are calculated. Since the final amount of CH4 is dependent of CH4 molar fraction and the initial amount of CO2, this section is followed by an explanation on how GC data is converted into the required molar fraction of CH4 and the two experimental methods used to find a correlation between experimental values and CO2 initial amount. Methane was the main product of reaction, but not the only one, the next section describes the changes in the calculations in case CO is the reaction product.
Hydrogenation reaction used a Parr reactor once to test stirring effect, this reactor is described in section 2.3.3. All procedures required to calculate the yield are presented in this section including volume determination and the explanation of how the magnetic drive’s dead volume changes CH4 yield calculations.
16
2.1
D
ESCRIPTION OF THEA
PPARATUSA new high-pressure apparatus, where to carry out hydrogenations of carbon dioxide, was designed and built. This apparatus included the reactor and its feeding lines, as well as two additional sections, designed to obtain representative samples of the gaseous reaction products. The apparatus (Figure 2.1) was thus composed by tree main sections: (RZ) reaction zone, (EZ) expansion zone, (CZ) capture zone. All main parts and connections were made in stainless steel, and it was assembled inside a fume hood.
Figure 2.1. Schematics of the hydrogenation apparatus: (RZ) reaction zone, (EZ) expansion zone, (CZ) capture zone, (C) CO2 compressor, (R) reactor, (OB) oil bath, (MS) magnetic stirrer, (PT) pressure
transducer, (M) manometer, (EV) expansion vessel, (CB) cooling bath, (CV) capture vessel, (v-1 to v-10) valves.
17 Figure 2.2. Picture of the reactor. From the right to the left: head of the reactor with a dip tube, cylinder, split ring closure rings with bolts, drop band.
The use of an oil bath to heat the reactor was adopted, due to the lower risk of deflagration with this method. Reactor heating was achieved by dipping it inside a Grant W6 Heated Water Bath Circulator filled with oil. Oil bath maximum temperature set is 150ºC. Stirring in the reactor was obtained using a magnetic stirrer (MS) below the oil bath and a magnetic stirring bar inside the autoclave (see Figure 2.1). The oil bath kept mixed by the circulator motor.
The expansion zone is composed by a large vessel (EV) connected to a manometer (M), a valve for pressure release (v-2), and a connection for the capture vessel (CV). The expansion vessel has is used to depressurize the system into a contained area, lowering the pressure inside the system and facilitate sampling.
18
A picture of the apparatus is displayed below:
Figure 2.3. Picture of the reaction apparatus.
During the experimental work, some minor changes took place in the apparatus. The cooling bath of the expansion zone was removed. The size of the magnetic bars was changed.
19
2.2
M
ATERIALS ANDM
ETHODS2.2.1
R
EACTANTSHydrogen and carbon dioxide were supplied by Air Liquid with a stated molar purity of 99.999% and 99.98% respectively.
2.2.2
C
ATALYSTSCommercial heterogeneous catalysts: Palladium (0.5 wt.%) on alumina in 3.2 pellets, Rhodium (0.5 wt.%) on alumina in 3.2 pellets, Ruthenium (0.5 wt.%) on alumina in 3.2 pellets were supplied by Sigma-Aldrich.
Ruthenium catalytic Precursors: Dichloro(1,5-cyclooctadiene)ruthenium(II), polymer, 95%; Dichloro(p-cymene)ruthenium(II) dimer; Bis(2-methylallyl)(1,5-cyclooctadiene)ruthenium(II) and Ruthenium (III) chloride hydrate and Ruthenium(III) acetylacetonate, 97% were supplied by Aldrich.
2.2.3
S
OLVENTS20
2.2.4
I
ONIC LIQUIDSA list of all used ILs with some detailed information (structure, molecular weight, purity and supplier) can be found in tables Table 2.1, Table 2.2 and Table 2.3:
Table 2.1 List of commercial ILs used.
Name: 1-Ethyl-3-methylimidazolium bis(trifluoromethylsulfonyl)imide
MW: 391.31 g.mol-1 Supplier: Solchemar Purity: ≥ 98%
[C2mim][NTf2]
Cation structure Anion structure
Name: 1-Butyl-3-methylimidazolium bis(trifluoromethylsulfonyl)imide
MW: 419.36 g.mol-1 Supplier: Solchemar Purity: ≥ 98%
[C4mim][NTf2]
Cation structure Anion structure
Name: 1-Methyl-3-octylimidazolium bis(trifluoromethylsulfonyl)imide
MW: 475.47g.mol-1 Supplier: Io-li-tec Purity: 99%
[C8mim][NTf2]
Cation structure Anion structure
Name: 1-Decyl-3-Methylimidazolium bis(trifluoromethylsulfonyl)imide
MW: 503.53 g.mol-1 Supplier: Solchemar Purity: >98%
[C10mim][NTf2]
Cation structure Anion structure
Name: 1-Butyl-2,3-dimethylimidazolium bis(trifluoromethylsulfonyl)imide
MW: 433.39 g.mol-1 Supplier: Io-li-tec Purity: 99%
[C4dmim][NTf2]
21 Name: 1-Butyl-3-methylimidazolium triflate
MW: 288.29 g.mol-1 Supplier: Io-li-tec Purity: 99%
[C4mim][OTf]
Cation structure Anion structure
Name: 1-Methyl-3-octylimidazolium triflate
MW: 344.40 g.mol-1 Supplier: Io-li-tec Purity: 99%
[C8mim][OTf]
Cation structure Anion structure
Name: 1-Butyl-3-methylimidazolium tetrafluoroborate
MW: 226.02 g.mol-1 Supplier: Solchemar Purity: >98%
[C4mim][BF4]
Cation structure Anion structure
Name: 1-Methyl-3-octylimidazolium tetrafluoroborate
MW: 282.13 g.mol-1 Supplier: Solchemar Purity: >98%
[C8mim][BF4]
Cation structure Anion structure
Name: 1-Methyl-3-octylimidazolium hexafluorophosphate
MW: 340.29 g.mol-1 Supplier: Solchemar Purity: >98%
[C8mim][Pf6]
Cation structure Anion structure
Name: 1-Butyl-3-methylimidazolium dicyanoamide
MW: 205.26 g.mol-1 Supplier: Solchemar Purity: >98%
[C4mim][DCA]
22
Table 2.2. List of commercial ILs used for synthesis of new ILs.
Table 2.3. List of synthesized ILs.
Name: 1-Ethyl-3-methylpyridinium perfluorobuanesulfonate
MW: 421.28 g.mol-1 Supplier: Merck Purity: 98%
[C2C1py][NfO]
Cation structure Anion structure
Name: 1-Butyl-3-methylimidazolium chloride
MW: 174.67 g.mol-1 Supplier: Solchemar Purity: >98%
[C4mim][Cl]
Cation structure Anion structure
Name: 1-Methyl-3-octylimidazolium chloride
MW: 230.78 g.mol-1 Supplier: Solchemar Purity: >98%
[C8mim][Cl]
Cation structure Anion structure
Name: 1-Butyl-3-methylimidazolium perfluorobuanesulfonate MW: 438.31 g.mol-1
[C4mim][NfO]
Cation structure Anion structure
Name: 1-Methyl-3-octylimidazolium perfluorobuanesulfonate MW: 494.42 g.mol-1
[C8mim][NfO]
Cation structure Anion structure
Name: 1-Butyl-3-methylimidazolium tris(trifluoromethanesulfonyl]methide MW: 559.99 g.mol-1
[C4mim][CTf3]
23 Name: 1-Methyl-3-octylimidazolium tris(trifluoromethanesulfonyl]methide MW: 606.54 g.mol-1
[C8mim][CTf3]
Cation structure Anion structure
Name: 1-Butyl-3-methylimidazolium mesylate MW: 234.32 g.mol-1
[C4mim][MeSO3]
Cation structure Anion structure
Name: 1-Methyl-3-octylimidazolium mesylate MW: 290.42 g.mol-1
[C8mim][MeSO3]
Cation structure Anion structure
Name: 1-Butyl-3-methylimidazolium trifluoroacetate MW: 252.23 g.mol-1
[C4mim][TFA]
Cation structure Anion structure
Name: 1-Methyl-3-octylimidazolium trifluoroacetate MW: 308.34 g.mol-1
[C8mim][TFA]
Cation structure Anion structure
Name: 1-Butyl-3-methylimidazolium perfluorooctanoate MW: 552.28 g.mol-1
[C4mim][PFO]
Cation structure Anion structure
Name: 1-Methyl-3-octylimidazolium perfluorooctanoate MW: 608.38 g.mol-1
[C8mim][PFO]
24
Syntheses of ionic liquids
The experimental methods applied to the syntheses of the ionic liquids used in this work that could not be bought from commercial suppliers are detailed below, NMR spectra can be found in Appendix A.
Synthesis of [C4mim][NfO]: Potassium nonafluoro-1-butanesulfonate (1.2 equiv.) was added slowly to a stirred solution of [C4mim][Cl] (3.17 g, 0.018 mol) in DCM (40 cm3). The mixture was stirred overnight at room temperature. The precipitated salt was filtered off, and the solution was washed with water (3 x 20 cm3). The organic layer was collected, dried with a rotary evaporator, and kept under vacuum for 24h. This IL was obtained in 82.3% yield and presented itself as a colourless liquid. 1H NMR (400 MHz, CDCl
3): δ 9.07 (s, 1H), 7.37 (d, J=14.8 Hz, 2H), 4.5 (t, J = 7.4 Hz, 2H), 3.93 (s, 3H), 1.88 – 1.76 (m, 2H), 1.38 – 1.25 (m, 2H), 0.90 ppm (t, J = 7.3 Hz, 3H). 13C NMR (101 MHz, CDCl
3): δ 137.02, 123.99, 122.52, 119.22, 116.35, 114.23, 111.10, 50.12, 36.56, 32.23, 19.61, 13.45 ppm. 19F NMR (376 MHz, CDCl3): δ -81.02 (t, J = 9.9 Hz, 3F), -114.69 – -115.16 (m, 2F), -121.55 – -121.92 (m, 2F), -125.80 – -126.28 ppm (m, 2F). Anal. Calc.: C, 32.88; H, 3.45; N, 6.39. Found: C, 32.71; H, 3.48, N, 6.25.
Synthesis of [C8mim][NfO]: Potassium nonafluoro-1-butanesulfonate (1.2 equiv.) was added slowly to a stirred solution of [C8mim][Cl] (3.05 g, 0.013 mol) in DCM (45 cm3). The mixture was stirred overnight at room temperature. The precipitated salt was filtered off, and the solution was washed with water (3 x 20 cm3). The organic layer was collected, dried with a rotary evaporator and kept under vacuum for 24 h. This IL was obtained in 67.9% yield as a white solid at room temperature. After reaching melting temperature (Tm = 38.33°C) the IL presents itself as a colourless liquid. 1H NMR (400 MHz, CDCl3): δ 9.14 (s,1H), 7.37 (s,1H), 7.30 (s,1H), 4.17 (t,
J = 7.3 Hz, 2H), 3.97 (s, 3H), 1.92 – 1.75 (m, 2H), 1.43 – 1.13 (m, 10H), 0.86 ppm (t, J = 6.4 Hz, 3H). 13C NMR (101 MHz, CDCl3): δ 136.93, 123.79, 122.19, 119.07, 116.93, 114.39, 114.05, 50.26, 36.44, 31.73, 30.26, 29.05, 28.94, 26.25, 22.70, 13.99 ppm. 19F NMR (400 MHz, CDCl
3): δ -80.94 (t, J = 9.8 Hz, 3F), 114.81 – 114.98 (m, 2F), 121.62 – 121.82 (m, 2F), 125.93 – -126.13 ppm (m, 2F). Anal. Calc.: C, 38.87; H, 4.69; N, 5.67. Found: C, 38.81; H, 4.70; N, 5.62.
25 (t, J = 7.4 Hz, 2H), 3.86 (s, 3H), 1.90 – 1.97 (m, 2H), 1.37 – 1.27 (m, 2H), 0.92 ppm (t, J = 7.3 Hz, 3H). 19F NMR (376 MHz, CDCl3): δ -77.04 ppm (s,9F). Anal. Calc.: C, 34.80; H, 2.74; N, 5.07. Found: C, 26.14; H, 2.97; N, 4,83.
Synthesis of [C8mim][CTf3]: Potassium tris(trifluoromethanesulfonyl)methide (1.2 equiv.) was added slowly to a stirred solution of [C8mim][Cl] (3.11g, 0.013 mol) in a 1:1 mixture of ethanol and DCM (40 cm3). The mixture was stirred overnight at room temperature. The precipitated salt was filtered off, and the solution was in dried by rotary evaporator, washed with water (3 x 2 cm3), dried again by rotary evaporator and kept under vacuum for 24 h. This IL was obtained in 86.4% yield and presented itself as a colourless liquid. 1H NMR (400 MHz, CDCl3): δ 8.54 (s, 1H), 7.28 (d, J = 10.2 Hz, 4H), 4.12 (t, J = 7.4 Hz, 2H), 3.90 (s, 3H), 1.91 – 1.76 (m, 2H), 1.38 – 1.19 (m, 10H), 0.85 (t, J = 6.9 Hz, 3H). 13C NMR (101 MHz, CDCl3): δ 135.82, 123.86, 122.40, 121.82, 118.64, 50.40, 36.41, 31.71, 30.15, 29.01, 28.88, 26.20, 22.64, 14.09 ppm. 19F NMR (376 MHz, CDCl3): δ = -76.71 ppm (s, 9F). Anal. Calc.: C, 31.68; H, 3.82; N, 4.62. Found: C, 31.60; H, 3.63; N, 3,42.
Synthesis of [C4mim][MeSO3]: Sodium mesylate was prepared by adding 25 cm3 of a 0.5M sodium hydroxide solution to 10 cm3 of a 1M methanesulfonic acid solution in methanol, and dried via rotary evaporator and vacuum.Sodium mesylate (1.2 equiv) was added slowly to a stirred aqueous solution (30 cm3) of [C4mim][Cl] (2.11 g, 0.012 mol). The mixture was stirred overnight at room temperature. Later all water was removed using a rotary evaporator followed by under vacuum heating. The dried sample was washed with ethanol, and the precipitated salt was filtered off, and the solution was again dried with a rotary evaporator and placed under vacuum. Later, the sample was washed with DCM, any remaining salt was filtered off, and the solution was again in dried by rotary evaporator and kept under vacuum for 24 h. This IL was obtained in 73.4% yield and presented itself as a colourless liquid. 1H NMR (400 MHz, CDCl3): δ 10.14 (s, 1H), 7.53 (s, 1H), 7.40 (s, 1H), 4.25 (t, J = 7.3 Hz, 2H), 4.02 (s, 3H), 2.90 (s, 3H), 1.89 – 1.72 (m, 2H), 1.39 – 1.22 (m, 2H), 0.89 ppm (t, J = 7.3 Hz, 3H). 13C NMR (101 MHz, CDCl3): δ 137.97, 123.35, 121.79, 49.61, 39.52, 36.36, 31.98, 19.30, 13.27 ppm.Anal. Calc.: C, 46.13; H, 7.74; N, 11.96. Found: C, 46.14; H, 7.54; N, 12.14.
Synthesis of [C8mim][MeSO3]: Sodium mesylate was prepared by adding 25 cm3 of a 0.5M sodium hydroxide solution to 10 cm3 of a 1M methanesulfonic acid solution in methanol, and dried via rotary evaporator and vacuum. Sodium mesylate (1.2 equiv.) was added slowly to a stirred aqueous solution (60 cm3) of [C
26
was filtered off, and the solution was again dried with a rotary evaporator and placed under vacuum. Later, the sample was washed with DCM, any remaining salt was filtered off, and the solution was again in dried by rotary evaporator and kept under vacuum for 24 h. The obtained IL, 78.1% yield presented itself as a colourless liquid.1H NMR (400 MHz, CDCl3): δ 10.08 (s, 1H), 7.48 (s, 1H), 7.33 (s, 1H), 4.23 (t, J = 7.4 Hz, 2H), 4.03 (s, 3H), 2.72 (s, 3H), 1.89 – 1.75 (m, 2H), 1.35 – 1.12 (m, J = 7.7 Hz, 10H), 0.82 ppm (t, J = 6.5 Hz, 3H).13C NMR (101 MHz, CDCl3): δ 138.48, 123.88, 122.07, 50.45, 40.02, 36.91, 32.01, 30.65, 29.30, 26.61, 22.92, 18.85, 14.40 ppm. Anal. Calc.: C, 53.76; H, 9.02, N, 9.65. Found: C. 53.92; H, 9,17; N, 9.88.
Synthesis of [C4mim][TFA]: Sodium trifluoroacetate (1.2 equiv) was added slowly to a stirred solution of [C4mim][Cl] (2.89 g, 0.017 mol) in ethanol (35 cm3). The mixture was stirred overnight at room temperature. The precipitated salt was filtered off, and the solution was dried with a rotary evaporator and placed under vacuum. Later, the sample was washed with DCM, any remaining salt was filtered off, and the solution was again dried by rotary evaporator and kept under vacuum for 24h. This IL was obtained in 68.9% and presented itself as a colourless liquid. 1H NMR (400 MHz, CDCl3): δ 9.99 (s, 1H), 7.37 (d, J = 25.5 Hz, 2H), 4.18 (t, J = 7.3 Hz, 2H), 3.95 (s, 3H), 1.87 – 1,71 (m, 2H), 1.38 – 1.22 (m, 2H), 0.89 ppm (t, J = 7.3 Hz, 3H). 13C NMR (101 MHz, CDCl3): δ 162.27, 139.17, 124.10, 122.55, 119.55, 116.60, 50.51, 37.00, 32.79, 20.12, 14.04 ppm. 19F NMR (376 MHz, CDCl3): δ -75.22 ppm (s,3F). Anal. Calc.: C, 47.62; H, 5.99; N, 11.11. Found: C, 47,39; H, 6,18; N, 10,99.
Synthesis of [C8mim][TFA]: Sodium trifluoroacetate (1.2 equiv.) was added slowly to a stirred solution of [C8mim][Cl] (2.79 g, 0.012 mol) in ethanol (40 cm3). The mixture was stirred overnight at room temperature. The precipitated salt was filtered off, and the solution was in dried by rotary evaporator and placed under vacuum. Later, the sample was washed with DCM, any remaining salt was salt was filtered off, and the solution was again in dried by rotary evaporator and kept under vacuum for 24h. The obtained IL, 75.2% yield presented itself as a yellowish liquid. 1H NMR (400 MHz, CDCl3): δ 9.88 (s,1H), 7.30 (d, J = 32.0 Hz, 2H), 4.18 (t, J = 7.3 Hz, 2H), 3.95 (s, 3H), 1.90 – 1.74 (m, 2H), 1.35 – 1.14 (m, 10H), 0.85 ppm (t, J = 6.4 Hz, 3H). 13C NMR (101 MHz, CDCl3): δ 162.19, 161.86, 137.98, 123.94, 122.11, 118.89, 115.97, 50.34, 36.56, 32.05, 30.51, 29.36, 29.28, 26.53, 22.96, 14.41 ppm. 19F NMR (376 MHz, CDCl
3): δ -75.64 (s, 3F). Anal. Calc.: C, 54.53; H, 7.52; N, 9.09. Found: C, 54.74; H, 7.63; N, 9.11.
![Figure 3.5. Effect of the amount of Ru precursor in CO 2 methanation yield at 150 ℃ using [C 8 mim][NTf 2 ] as solvent](https://thumb-eu.123doks.com/thumbv2/123dok_br/16695498.743802/90.892.176.717.641.949/figure-effect-precursor-methanation-yield-using-ntf-solvent.webp)

![Figure 3.10. UV/vis spectra of samples of Ru nanoparticles reduced at 4 bar of H 2 and 50°C in [C 4 mim][NTf 2 ] with different times of reduction](https://thumb-eu.123doks.com/thumbv2/123dok_br/16695498.743802/98.892.167.723.341.652/figure-spectra-samples-nanoparticles-reduced-different-times-reduction.webp)