BGD
9, 16213–16237, 2012
Distribution of methane in the Lena Delta and Buor Khaya
Bay, Russia
I. Bussmann
Title Page
Abstract Introduction
Conclusions References
Tables Figures
◭ ◮
◭ ◮
Back Close
Full Screen / Esc
Printer-friendly Version
Interactive Discussion
Discussion
P
a
per
|
Dis
cussion
P
a
per
|
Discussion
P
a
per
|
Discussio
n
P
a
per
|
Biogeosciences Discuss., 9, 16213–16237, 2012 www.biogeosciences-discuss.net/9/16213/2012/ doi:10.5194/bgd-9-16213-2012
© Author(s) 2012. CC Attribution 3.0 License.
Biogeosciences Discussions
This discussion paper is/has been under review for the journal Biogeosciences (BG). Please refer to the corresponding final paper in BG if available.
Distribution of methane in the Lena Delta
and Buor Khaya Bay, Russia
I. Bussmann
Alfred Wegener Institute for Polar and Marine Research, Marine Station Helgoland, Kupromenade 201, 27498 Helgoland, Germany
Received: 1 October 2012 – Accepted: 17 October 2012 – Published: 15 November 2012
Correspondence to: I. Bussmann ([email protected])
BGD
9, 16213–16237, 2012
Distribution of methane in the Lena Delta and Buor Khaya
Bay, Russia
I. Bussmann
Title Page
Abstract Introduction
Conclusions References
Tables Figures
◭ ◮
◭ ◮
Back Close
Full Screen / Esc
Printer-friendly Version
Interactive Discussion
Discussion
P
a
per
|
Dis
cussion
P
a
per
|
Discussion
P
a
per
|
Discussio
n
P
a
per
|
Abstract
The Lena River is one of the largest Russian rivers draining into the Laptev Sea. The permafrost areas surrounding the Lena are predicted to melt at increasing rates due to global temperature increases. With this melting, large amounts of carbon – either organic or as methane – will reach the waters of the Lena and the adjacent Buor Khaya
5
Bay (Laptev Sea).
Methane concentrations and the isotopic signal of methane in the waters of the Lena Delta and estuary were monitored from 2008 to 2010. Meltwater run-offof permafrost soils produced hotspots for methane input into the river system (median concentra-tion 1500 nM) compared with concentraconcentra-tions of around 100 nM observed in the main
10
channels of the Lena. Within the river, especially at sites with meltwater input, mi-crobiological experiments indicated strong in situ methane production but a very low methane oxidation potential. In the estuary of Buor Khaya Bay, methane concentra-tions decreased towards background levels of 20 nM. Here, the strong stratification of the water column permits the dilution of methane with seawater, and methane is
re-15
leased mainly by diffusion into the atmosphere.
1 Introduction
The Arctic Ocean is an intercontinental sea surrounded by the landmasses of Alaska, Canada, Greenland and Siberia/Russia. Large areas are shallow shelf seas into which about 10 % of global runoffflows (Lammers et al., 2001). Many Arctic rivers carry high
20
concentrations of dissolved and particulate material and, in addition, eroding coastlines also contribute to a strong terrestric input (Dittmar and Kattner, 2003; Lantuit et al., 2011).
Although most regions of Earth have warmed over recent decades, that observed in the Arctic far exceeds the global average, and consequently, observed changes
25
BGD
9, 16213–16237, 2012
Distribution of methane in the Lena Delta and Buor Khaya
Bay, Russia
I. Bussmann
Title Page
Abstract Introduction
Conclusions References
Tables Figures
◭ ◮
◭ ◮
Back Close
Full Screen / Esc
Printer-friendly Version
Interactive Discussion
Discussion
P
a
per
|
Dis
cussion
P
a
per
|
Discussion
P
a
per
|
Discussio
n
P
a
per
|
obvious and straightforward implications of the observed warming, is that river runoff
will change/increase (Peterson et al., 2002). Additionally, one of the most profound fu-ture consequences of permafrost thaw is that the Arctic terrestrial freshwater system is likely to undergo a transition from a surface-water-dominated system to a groundwater-dominated system (Frey and McClelland, 2009). The disproportionate influence of
5
rivers on the Arctic Ocean means that changes in the discharge or chemistry of Arc-tic rivers have potentially large implications for ocean physics, chemistry and biology (Holmes et al., 2011).
Because methane is an efficient greenhouse gas, understanding methane sources and sinks is important for studying local processes and determining global methane
10
budgets. However, methane release from the Arctic area, including gas hydrate and marine permafrost, is not currently included in the IPCC methane budget calculations. While it is clear that there are substantial stocks of carbon in the Arctic, there are also significant uncertainties associated with the magnitude of organic matter stocks contained in permafrost, and the storage of methane hydrates beneath both
subter-15
ranean and submerged permafrost of the Arctic (McGuire et al., 2009). The Arctic is a substantial source of methane to the atmosphere (between 32 and 112 Tg CH4yr−1), primarily because of the large area of wetlands throughout the region (McGuire et al., 2009).
The Lena River is the second-largest river (530 km3yr−1) draining into the shallow
20
Laptev Sea, and further into the Arctic Ocean (Peterson et al., 2002). The methane cy-cle in the Laptev and East Siberian Sea has been investigated intensively by Shakhova and Semiletov and co-workers. The rivers Indigirka and Kolyma transport significant amounts of methane into the East Siberian Sea (Shakhova et al., 2005), and even the atmospheric methane signal mirrored the strong methane import of this area
25
BGD
9, 16213–16237, 2012
Distribution of methane in the Lena Delta and Buor Khaya
Bay, Russia
I. Bussmann
Title Page
Abstract Introduction
Conclusions References
Tables Figures
◭ ◮
◭ ◮
Back Close
Full Screen / Esc
Printer-friendly Version
Interactive Discussion
Discussion
P
a
per
|
Dis
cussion
P
a
per
|
Discussion
P
a
per
|
Discussio
n
P
a
per
|
The aim of this study is a detailed analysis of methane distribution in the Lena River and its estuary. With the help of experiments and isotopic methane signature, we as-sess the further fate of this riverine methane, and process of dilution, oxidation and atmospheric flux.
2 Material and methods
5
2.1 Study site
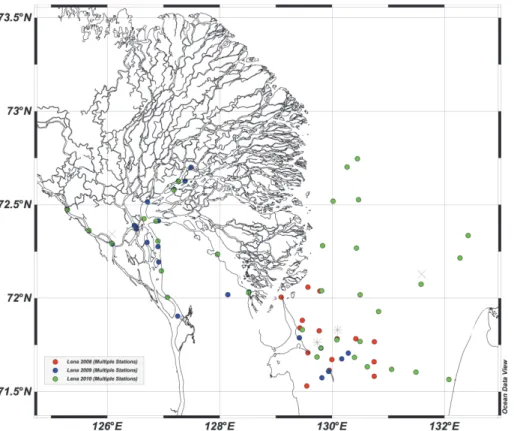
Water samples were collected during three summer expeditions in 2008, 2009 and 2010 (Boike et al., 2009; Wetterich et al., 2011) within the main channels of the Lena River and Buor Khaya Bay (Fig. 1). River water was sampled from the “Puteyski 405” survey ship, via a Unite water sampler (Unite, Austria). Coastal water was sampled with
10
Niskin bottles from the ship “TB 0012” during 2010. Additional parameters (tempera-ture, salinity, oxygen, pH) were obtained either with a portable multi-parameter probe (Multi 350i, WTW) on board, or with a CTD probe (Eco 159, Sea and Sun) directly in the water. Water samples were collected from the surface, above and below the thermocline if applicable, and near the bottom.
15
Serum bottles (120 ml) were flushed extensively and closed with butyl stoppers; ex-cess water could escape via a needle in the stopper. Samples were poisoned with 0.01 % HgCl2. In the laboratory, 20 ml of nitrogen were added to extract methane from
the water phase, and excess water could escape via a needle. The volumes of the water and gas phases were calculated by differential weighing.
20
Meltwater running offthe permafrost soil in small streams was filled directly into 12 ml serum vials and analysed as described above.
2.2 Gas analysis
Headspace methane concentrations were analysed in the laboratory with a gas chro-matograph (GC 2014, Shimadzu) equipped with a flame ionisation detector and
BGD
9, 16213–16237, 2012
Distribution of methane in the Lena Delta and Buor Khaya
Bay, Russia
I. Bussmann
Title Page
Abstract Introduction
Conclusions References
Tables Figures
◭ ◮
◭ ◮
Back Close
Full Screen / Esc
Printer-friendly Version
Interactive Discussion
Discussion
P
a
per
|
Dis
cussion
P
a
per
|
Discussion
P
a
per
|
Discussio
n
P
a
per
|
a molecular sieve column (Hay Sep N, 80/100, Alltech). The temperatures of the oven, the injector and detector were 40◦C, 120◦C and 160◦C, respectively. The carrier gas (N2) flow was 20 ml min−
1
, with 40 ml min−1H2and 400 ml min− 1
synthetic air. Gas stan-dards (Air Liquide) with methane concentrations of 10 and 100 ppm were used for cali-bration.
5
After measuring the methane concentration, the headspace was analysed for the isotopic composition of methane. Depending on the methane concentration of the headspace, 0.5–2.5 ml of the headspace was transferred into an evacuated 20-ml gas sampling tube. These data are only available for 2010.
Theδ13CCH
4 values were determined by a Finnigan DELTAplus XP mass
spectrom-10
eter. The extracted gas was purged and trapped with a PreCon unit to pre-concentrate the sample. The reproducibility, as derived from duplicates, was 1.6 %. The isotope ra-tios are presented relative to the VPDB (Vienna Pee Dee Belemnite) standard using the conventional delta notation (Craig, 1957).
2.3 Calculation of methane oxidation
15
For the calculation of the fraction of methane oxidised, the maximum methane concen-tration of a sample group was set as fraction 1, and the other concenconcen-trations were re-lated to this concentration accordingly. Starting from the data point with the maximum methane concentration and the corresponding δ13C, the theoretical δ13C of a given methane fraction was calculated. A Rayleigh distillation model of the type discussed by
20
(Coleman et al., 1981), i.e.
δ13CCH
4=1000·(1/α−1)·lnf +(δ 13C
CH4)0 (1)
was used to determine fractionf of the methane remaining (thus, 1−f is the methane
consumed by oxidation), where α is the kinetic isotope fractionation factor and (δ13CCH4)0 is the starting stable isotopic composition. From the literature, fractiona-25
BGD
9, 16213–16237, 2012
Distribution of methane in the Lena Delta and Buor Khaya
Bay, Russia
I. Bussmann
Title Page
Abstract Introduction
Conclusions References
Tables Figures
◭ ◮
◭ ◮
Back Close
Full Screen / Esc
Printer-friendly Version
Interactive Discussion
Discussion
P
a
per
|
Dis
cussion
P
a
per
|
Discussion
P
a
per
|
Discussio
n
P
a
per
|
et al., 2002) to 1.017 for Arctic marine water (Damm et al., 2007). When only diffusion is assumed, anα of 1.0009 is reported (Happell et al., 1995).
2.4 Mixing experiments
Microorganisms were separated from their original water (8 l) by filtration through 3-and 0.2-µm filters (Satorius). The filters were resuspended in 20–40 ml of the original
5
water, and kept cool (4◦C) until further processing. The estuarine sample originated from station T1 1005 at 10 m water depth (Fig. 1), with an in situ temperature of 0.8◦C, a salinity of 15.2 and a methane concentration of 19 nM. The riverine sample originated from station T5 1003 surface (Fig. 1), with an in situ temperature of 19.5◦C, a salinity of 0 and a methane concentration of 363 nM. The “permafrost” sample was obtained from
10
a meltwater stream at the foot of a melting permafrost cliff(72◦20.169 N 126◦17.750 E); no bacterial samples were taken.
For the experiment, the filters were vigorously mixed, and 1-ml subsamples were dis-tributed into 12-ml glass vials. The concentrate was diluted with 3 ml of the filtered river or marine water. Incubation was initiated with the addition of methane to a final
con-15
centration of 335 nM. Twelve samples served as controls and were killed immediately after the addition of methane. Each combination was measured in triplicate. Samples were incubated in the dark and outside. Temperatures ranged from 6 to 16◦C. Incu-bation was stopped after 40 h by the addition of HgCl2 (0.01 % final concentration). In
the home laboratory, methane concentrations within the headspace were determined.
20
BGD
9, 16213–16237, 2012
Distribution of methane in the Lena Delta and Buor Khaya
Bay, Russia
I. Bussmann
Title Page
Abstract Introduction
Conclusions References
Tables Figures
◭ ◮
◭ ◮
Back Close
Full Screen / Esc
Printer-friendly Version
Interactive Discussion
Discussion
P
a
per
|
Dis
cussion
P
a
per
|
Discussion
P
a
per
|
Discussio
n
P
a
per
|
3 Results
3.1 Hydrographic/oceanographic information
For 2008 and 2009, only data from the surface and the bottom are available, whereas data for 2010 cover the whole water column in Buor Khaya Bay. In the middle of the Bay and around Muostakh Island, temperatures ranged between 13 and 15◦C at the
5
surface and 3–4◦C at the bottom in 2008. The corresponding salinities were around 1 at the surface and around 21 at the bottom. Otherwise, temperatures ranged from 10 to 18◦C with salinities<1. In 2009, the Lena River was slightly colder, with an average temperature of 12◦C. Only one station was found to have brackish water (12 PSU and 2◦C). In 2010, the Olenekskaya Channel was relatively warm at 19◦C, compared with
10
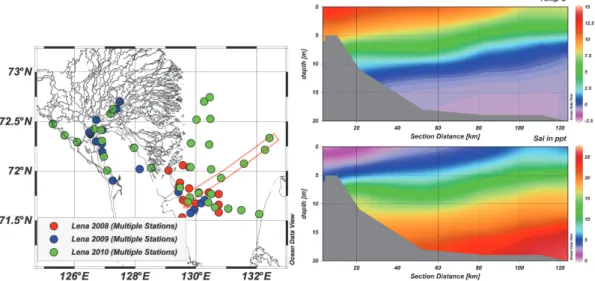
16◦C in other channels. No differences were observed between surface and bottom temperatures, whereas distinct stratification was observed in Buor Khaya Bay (Fig. 2, example shows Transect 1). Cold, saline water was observed below a water depth of 12 m, while at the surface the warmer Lena River water extended far to the northeast (Bussmann, 2011).
15
3.2 Methane concentrations
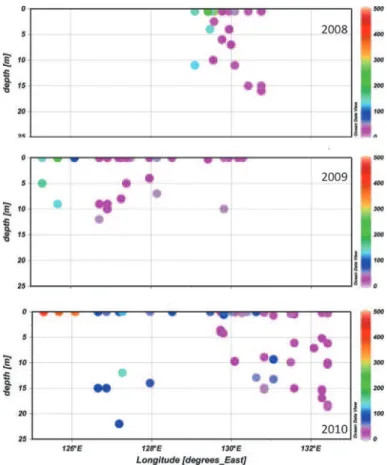
In a first overview (Fig. 3), the median methane concentrations in the area were com-parable between the three sampling years, even with a slight increase from a median of 28 nM in 2008 (n=43) to 35 nM in 2009 (n=35) and 41 nM (n=63) in 2010. How-ever, methane concentrations of permafrost meltwater were orders of magnitude higher
20
(median of 1505 nM,n=7, samples from 2009 and 2010).
In 2008, the outlet of the Bykovskaya Channel into Buor Khaya Bay, and the area around Muostakh Island were investigated (Fig. 4a). The highest methane concentra-tions were observed at the outlet of the Bykovskaya Channel (150–280 nM), while in Buor Khaya Bay the concentration decreased to background levels of around 20 nM.
25
BGD
9, 16213–16237, 2012
Distribution of methane in the Lena Delta and Buor Khaya
Bay, Russia
I. Bussmann
Title Page
Abstract Introduction
Conclusions References
Tables Figures
◭ ◮
◭ ◮
Back Close
Full Screen / Esc
Printer-friendly Version
Interactive Discussion
Discussion
P
a
per
|
Dis
cussion
P
a
per
|
Discussion
P
a
per
|
Discussio
n
P
a
per
|
area investigated in 2008 – also revealed only background levels of around 20 nM; how-ever, the same low concentrations were also observed in the Lena Channels (Fig. 4b). Higher concentrations (of around 100 nM) were only observed in the Olenekskaya Channel. In 2010, maximal methane concentrations of 418 nM were also observed in the Olenekskaya Channel. Water temperature in this channel was rather high (19◦C),
5
with oxygen content of 7.1 mg l−1. The other main channels of the Lena revealed in-termediate concentrations of around 100 nM, and concentrations decreased further to background levels in Buor Khaya Bay (Fig. 4c).
3.3 Isotopic signature of methane
The lightest carbon isotope signature of methane −42.3±1.7 (n=3, Fig. 5B) was 10
recorded in the river water of the Olenekskaya Channel together with methane con-centrations of 414±52 nM. This isotopic signature of the Olenekskaya Channel was
comparable to the signature of the meltwater (−39.4±1.9, n=3, Fig. 5A); however,
here, much higher methane concentrations of 1891±877 nM were measured.
Unfortu-nately, the isotopic samples from the other Lena channels were lost and no information
15
is available. Methane in the waters of Buor Khaya Bay was much heavier (−33.6±0.8, n=30, Fig. 5C). The corresponding methane concentrations covered a wide range, from approximately 10 to 100 nM. However, at two stations we detected a very heavy signature of −12.1±2.1 (n=4, Fig. 5D) together with low methane concentrations
(21±3 nM). These data points were excluded from further analysis and discussion, as 20
they are likely of other, non-biogenic origin.
3.4 Mixing experiments
In order to estimate the influence of the mixing of the Lena River with the marine Laptev Sea water, we separated and concentrated the original riverine bacteria from their wa-ter and mixed them with the marine Laptev Sea wawa-ter, and vice versa. Additionally,
25
BGD
9, 16213–16237, 2012
Distribution of methane in the Lena Delta and Buor Khaya
Bay, Russia
I. Bussmann
Title Page
Abstract Introduction
Conclusions References
Tables Figures
◭ ◮
◭ ◮
Back Close
Full Screen / Esc
Printer-friendly Version
Interactive Discussion
Discussion
P
a
per
|
Dis
cussion
P
a
per
|
Discussion
P
a
per
|
Discussio
n
P
a
per
|
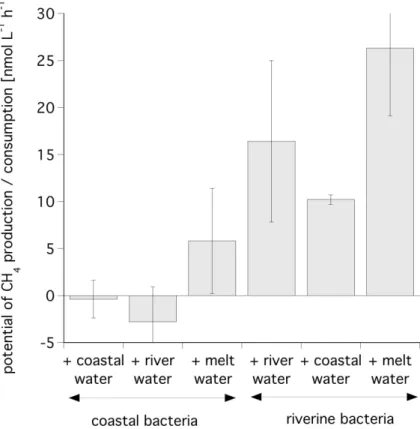
revealed a strong potential of methane production (Fig. 6). The mixing of the riverine bacteria with the coastal water resulted in a reduced activity, while the addition of melt-water increased the methane production potential. The potential activity of the coastal bacteria was much lower than that of the riverine bacteria (Fig. 6). Thus, the mixing with the riverine freshwater showed no clear effect. However, the addition of meltwater
5
switched the “neutral” methane production/consumption activity towards a clear signal of methane production. Additional simple incubations of natural river water with natural methane concentrations (ca. 400 nM, 24 h) revealed no potential of methane consump-tion.
4 Discussion
10
4.1 Processes within the river
Methane concentrations in the Lena River from a 3-yr period were around 100 nM, which is the same range of concentrations observed by Semiletov et al. (2011). These concentrations are within the lower range of 10 to 1400 nM reported for boreal rivers (Middelburg et al., 2002). Isotopic data of methane in meltwater and in the Olenekskaya
15
Channel (−42 and−39 ‰) are rather heavy when compared to other Arctic lakes, which
were reported to be within the range −59 to −79 ‰ (Walter et al., 2008), or −72 ‰
reported for permafrost sediment cores (Koch et al., 2009).
Methane concentrations within the channels of the Lena River can be altered by different processes. Higher methane concentrations can be due to input of meltwater
20
and other tributaries, or in situ production. On the other hand, reduction of the methane content can be due to microbial oxidation and diffusion into the atmosphere.
The Olenekskaya Channel is characterized by high methane concentration and an isotopic signal similar to the meltwater; thus, we assume a high meltwater input here. Additionally, the experiments show that – especially in the Olenekskaya Channel –
25
BGD
9, 16213–16237, 2012
Distribution of methane in the Lena Delta and Buor Khaya
Bay, Russia
I. Bussmann
Title Page
Abstract Introduction
Conclusions References
Tables Figures
◭ ◮
◭ ◮
Back Close
Full Screen / Esc
Printer-friendly Version
Interactive Discussion
Discussion
P
a
per
|
Dis
cussion
P
a
per
|
Discussion
P
a
per
|
Discussio
n
P
a
per
|
by the addition of meltwater-based organic matter. For the Trofimovskaya Channel, there seem to be further sources of methane along its flow, as seen by the increase of methane concentration with flow distance (Fig. 7). A similar increase in methane is also reported from boreal rivers (Angelis and Lilley, 1987). However, in the Bykovskaya Channel, methane concentrations did not change along the flow distances.
5
As discussed, declining methane concentrations within the river could be attributed to microbial oxidation or diffusion into the atmosphere. From simple incubation experi-ments and the mixing experiment, we found no indications of active methane oxidation (or it was below our detection threshold). Applying an isotopic model in the rivers ap-pears to be infeasible, because basic assumptions (no other sources of methane) are
10
not valid.
Gas exchange across an air-water interface can be described in general by the fol-lowing function (Angelis and Lilley, 1987):F =k·(cm−ce), whereF is the rate of gas
flux per unit area,cmis the methane concentration measured in surface water andce
is the atmospheric gas equilibrium concentration based on Wiesenburg and Guinasso
15
(1979). The gas exchange coefficient,k, is a function of water surface agitation. In most rivers, stream turbulence is more important for gas exchange than wind stress (Angelis and Lilley, 1987). Therefore, for river flux calculations, a simplified turbulence model was applied, where the gas exchange coefficient is defined as
k=1.46·(D·V/h)0.5, whereD is the molecular diffusion coefficient of methane at the
20
respective temperature and salinity (Unisense gas tables; modified from Broecker and Peng, 1974),V is stream velocity and hstream depth. Data on stream velocity at the respective date and position were kindly provided by I. Fedorova (2012).
For the Olenekskaya Channel, which has high methane concentrations, we also cal-culated high methane fluxes (x=852 µmol m−2d−1,n=4, or 14 mg C m−2d−1). In the
25
BGD
9, 16213–16237, 2012
Distribution of methane in the Lena Delta and Buor Khaya
Bay, Russia
I. Bussmann
Title Page
Abstract Introduction
Conclusions References
Tables Figures
◭ ◮
◭ ◮
Back Close
Full Screen / Esc
Printer-friendly Version
Interactive Discussion
Discussion
P
a
per
|
Dis
cussion
P
a
per
|
Discussion
P
a
per
|
Discussio
n
P
a
per
|
flux to 597 µmol m−2d−1 (10 mg C m−2d−1). At the nearby Samoylov research station, the “terrestric” methane flux ranged from 4 to 28 mg C m−2d−1 at the rim and the de-pression of polygon structures (Kutzbach et al., 2004). Eddy covariance indicated an average daily methane flux of 18.7 mg m−2d−1, mainly determined by wind velocity (Sachs et al., 2008). Thus, the methane flux from the Lena River and its various
chan-5
nels is slightly less than the terrestric emissions, but within the same range.
The warmest water temperatures in the Lena were previously recorded in July/August (ca. 15◦C) (Yang et al., 2002); as methanogenesis is strongly influenced by temperature (Eugster et al., 2011), we also propose highest methane production rates in July/August. Soil temperatures and therefore permafrost melting rates are also
10
highest during these months (Boike et al., 2012). Thus, we assume that our methane flux represents the maximal flux on a seasonal scale. The strength of the methane flux following the spring ice-melt remains uncertain.
Thus, we can only conclude that the observed methane concentrations of around 100 nM are the result of a strong meltwater input and a strong in situ production of
15
methane. As we had little evidence for methane oxidation activities, the decrease of riverine methane appears to be mainly governed by diffusion into the atmosphere. 4.2 Processes within Buor Khaya Bay
When the Lena River enters the coastal area of Buor Khaya Bay, methane concentra-tions decrease from 100 nM to around 20 nM, together with a slight shift of the isotopic
20
values towards a heavier signature (Fig. 5). Within the bay, we have no indications of any methane sources, and only processes to reduce methane concentrations seem to be relevant.
4.2.1 Dilution
To determine whether the decrease in methane concentrations observed within Buor
25
BGD
9, 16213–16237, 2012
Distribution of methane in the Lena Delta and Buor Khaya
Bay, Russia
I. Bussmann
Title Page
Abstract Introduction
Conclusions References
Tables Figures
◭ ◮
◭ ◮
Back Close
Full Screen / Esc
Printer-friendly Version
Interactive Discussion
Discussion
P
a
per
|
Dis
cussion
P
a
per
|
Discussion
P
a
per
|
Discussio
n
P
a
per
|
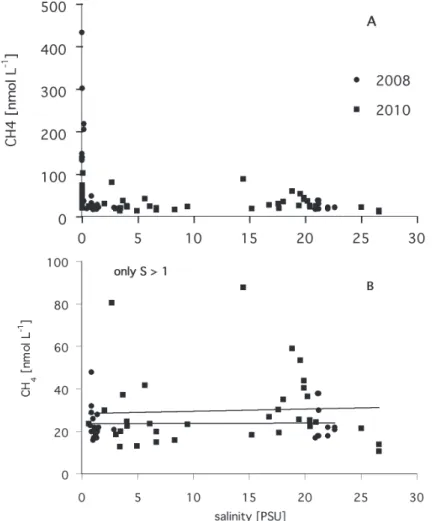
For the years 2008 and 2010, no correlation was observed between salinity and methane concentration. This was also true when only data with a salinity of>1 were used. Thus, methane loss is not the result of mixing methane-rich river water with methane-poor marine water, as described for other estuaries (Angelis and Lilley, 1987). This may be due to the very strong stratification of the water column (Fig. 2), as in other
5
river-dominated and stratified estuaries (Middelburg et al., 2002).
4.2.2 Production and oxidation (microbial processes)
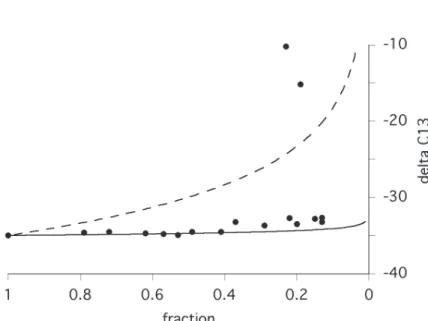
Methane concentration may also be reduced due to microbial oxidation, and can be inferred from isotopic data. In Fig. 5, data from Buor Khaya Bay are related to the data set with the maximal methane concentration (102 nM); Rayleigh curves are plotted to
10
show how the isotopic signal would change due to microbial oxidation with a fraction factor of 1.017, or due to diffusion from water into the atmosphere with fractionation factor of 1.0009 (see Material and Methods). As seen in Fig. 9, the observed decrease in methane concentration and the relatively minor shift towards heavier methane can-not be explained by methane oxidation; instead, diffusion seems to be the dominant
15
process here.
The lack of methane oxidation is in contrast to other estuaries, where, during sum-mer, oxidation removed a substantial proportion of methane from the freshwater and brackish areas of the estuary (Angelis and Scranton, 1993). This low methane oxida-tion potential is also supported by our experiments. However, it is not yet clear why the
20
methane oxidation is so low.
The functions developed by Wanninkhof (1992) calculate the flux of dissolved methane into the atmosphere. In addition to our data on water temperatures, salinities and methane concentrations at transects 1 and 3, we used wind speeds of 2–4 m s−1 (www.aari.ru, data for Tiksi). Consequently, the flux of dissolved methane from Buor
25
Khaya Bay into the atmosphere ranged from 21 to 49 µmol m−2d−1 along the coast (or 0.33–0.79 mg C m−2d−1). At the northernmost station, the methane flux decreased to 5 µmol m−2
d−1
(or 0.08 mg C m−2
d−1
BGD
9, 16213–16237, 2012
Distribution of methane in the Lena Delta and Buor Khaya
Bay, Russia
I. Bussmann
Title Page
Abstract Introduction
Conclusions References
Tables Figures
◭ ◮
◭ ◮
Back Close
Full Screen / Esc
Printer-friendly Version
Interactive Discussion
Discussion
P
a
per
|
Dis
cussion
P
a
per
|
Discussion
P
a
per
|
Discussio
n
P
a
per
|
of 130 µmol m−2d−1 previously estimated for European estuaries (Middelburg et al., 2002). Shakhova and Semiletov (2007) reported 3.02–4.86 g C cm−2h−1 (or 0.07– 0.12 mg C m−2
d−1
) methane flux from the East Siberian Sea and northern parts of Buor Khaya Bay in 2003 and 2004. These data correspond well with our northernmost station.
5
5 Conclusions
The concentration and isotopic signature of methane in the Lena River and Buor Khaya Bay reveal intermediate concentrations comparable to boreal estuaries. Within the river, especially at sites with meltwater input, experimental results suggest a strong in situ methane production, but a very low, non-detectable methane oxidation potential.
10
Thus, methane is released from the river and estuary water mainly by diffusion into the atmosphere. Riverine methane fluxes are within the same order of magnitude as the “surrounding” terrestrial methane fluxes. Within Buor Khaya Bay, the strong strat-ification of the water column permits the dilution of methane and, again, methane is released mainly via diffusion into the atmosphere.
15
Acknowledgements. Many thanks are given to the scientific party and the crew of the vessels “Puteyski 405” and “TB 0012”; to B. Heim and K. Carstens for sampling in 2008 and 2009; and E. Damm for assistance in the isotope measurements. I am also grateful for logistical support provided by the Alfred Wegener Institute, in particular by W. Schneider and G. Stoof.
References
20
Angelis, M. A. d. and Lilley, M. D.: Methane in surface waters of Oregon estuaries and rivers, Limnol. Oceanogr., 32, 716–722, 1987.
BGD
9, 16213–16237, 2012
Distribution of methane in the Lena Delta and Buor Khaya
Bay, Russia
I. Bussmann
Title Page
Abstract Introduction
Conclusions References
Tables Figures
◭ ◮
◭ ◮
Back Close
Full Screen / Esc
Printer-friendly Version
Interactive Discussion
Discussion
P
a
per
|
Dis
cussion
P
a
per
|
Discussion
P
a
per
|
Discussio
n
P
a
per
|
Bastviken, D., Ejlertsson, J., Sundh, I., and Tranvik, L.: Measurement of methane oxidation in lakes: a comparison of methods, Environ. Sci. Technol., 36, 3354–3361, 2002.
Broecker, W. S. and Peng, T.-H.: Gas exchange rates between air and sea, Tellus, 26, 19–35, 1974.
Bussmann, I.: Physical oceanography measured in the Lena Estuary, Sibiria, Russia, in 2010,
5
Alfred Wegener Institute for Polar and Marine Research – Biological Institute Helgoland, Unpublished dataset #770761, available at: www.pangaea.de, 2011.
Coleman, D. D., Risatti, J. B., and Schoell, M.: Fractionation of carbon and hydrogen isotopes by methane-oxidizing bacteria, Geochim. Cosmochim. Ac., 45, 1033–1037, 1981.
Craig, H.: Isotopic standards for carbon and oxygen and correction factors for
mass-10
spectrometric analysis of carbon dioxide, Geochim. Cosmochim. Ac., 12, 133–149, 1957. Damm, E., Schauer, U., Rudels, B., and Haas, C.: Excess of bottom-released
methane in an Arctic shelf sea polynya in winter, Cont. Shelf Res., 27, 1692–1701, doi:10.1016/j.csr.2007.02.003, 2007.
Denman, K. L., Brasseur, G., Chidthaisong, A., Ciais, P., Cox, P. M., Dickinson, R. E.,
Hauglus-15
taine, D., Heinze, C., Holland, E., Jacob, D., Lohmann, U., Ramachandran, S., da Silva Dias, P. L., Wofsy, S. C., and Zhang, X.: Couplings between changes in the climate system and biogeochemistry, in: Climate Change 2007: The Physical Science Basis, Contribution of Working Group I to the Fourth Assessment, Report of the Intergovernmental Panel on Climate Change, edited by: Solomon, S., Qin, D., Manning, M., Chen, Z., Marquis, M.,
Av-20
eryt, K. B., Tignor, M., and Miller, H. L., Cambridge University Press, Cambridge, UK and New York, NY, USA, 2007.
Dittmar, T. and Kattner, G.: The biogeochemistry of the river and shelf ecosystem of the Arctic Ocean: a review, Mar. Chem., 83, 103–120, 2003.
Eugster, W., DelSontro, T., and Sobek, S.: Eddy covariance flux measurements confirm extreme
25
CH4 emissions from a Swiss hydropower reservoir and resolve their short-term variability, Biogeosciences, 8, 2815–2831, doi:10.5194/bg-8-2815-2011, 2011.
Frey, K. E. and McClelland, J. W.: Impacts of permafrost degradation on arctic river biogeo-chemistry, Hydrol. Process., 23, 169–182, doi:10.1002/hyp.7196, 2009.
Happell, J. D., Chanton, J. P., and Showers, W. J.: Methane transfer across the water-air
in-30
BGD
9, 16213–16237, 2012
Distribution of methane in the Lena Delta and Buor Khaya
Bay, Russia
I. Bussmann
Title Page
Abstract Introduction
Conclusions References
Tables Figures
◭ ◮
◭ ◮
Back Close
Full Screen / Esc
Printer-friendly Version
Interactive Discussion
Discussion
P
a
per
|
Dis
cussion
P
a
per
|
Discussion
P
a
per
|
Discussio
n
P
a
per
|
Holmes, R. M., McClelland, J. W., Peterson, B. J., Tank, S. E., Bulygina, E., Eglinton, T. I., Gordeev, V. V., Gurtovaya, T. Y., Raymond, P. A., and Repeta, D. J.: Seasonal and annual fluxes of nutrients and organic matter from large rivers to the Arctic Ocean and surrounding seas, Estuar. Coast., 35, 369–382, 2012.
Koch, K., Knoblauch, C., and Wagner, D.: Methanogenic community composition and anaerobic
5
carbon turnover in submarine permafrost sediments of the Siberian Laptev Sea, Environ. Microbiol., 11, 657–668, 2009.
Lammers, R. B., Shiklomanov, A. I., V ¨or ¨osmarty, C. J., Fekete, B. M., and Peterson, B. J.: Assessment of contemporary Arctic river runoffbased on observational discharge records, J. Geophys. Res., 106, 3321–3334, 2001.
10
Lantuit, H., Atkinson, D., Overduin, P. P., Grigoriev, M., Rachold, V., Grosse, G., and Hubberten, H.-W.: Coastal erosion dynamics on the permafrost-dominated Bykovsky Peninsula, north Siberia, 30, 1951–2006, 7341, doi:10.3402/polar.v30i0.7341, 2011.
McGuire, A. D., Anderson, L. G., Christensen, T. R., Dallimore, S., Guo, L., Hayes, D. Y., Heimann, M., Lorenson, T. D., MacDonald, R. W., and Roulet, N.: Sensitivity of the carbon
15
cycle in the Arctic to climate change, Ecol. Monogr., 79, 523–533, 2009.
Middelburg, J. J., Nieuwenhuize, J., Iversen, N., Hogh, N., deWilde, H., Helder, W., Seifert, R., and Christof, O.: Methane distribution in European tidal estuaries, Biogeochemistry, 59, 95– 119, 2002.
Peterson, B. J., Holmes, R. M., McClelland, J. W., V ¨or ¨osmarty, C. J., Lammers, R. B.,
Shiklo-20
manov, A. I., Shiklomanov, I. A., and Rahmstorf, S.: Increasing river discharge to the Arctic Ocean, Science, 298, 2171–2173, doi:10.1126/science.1077445, 2002.
Semiletov, I. P., Pipko, I. I., Shakhova, N. E., Dudarev, O. V., Pugach, S. P., Charkin, A. N., McRoy, C. P., Kosmach, D., and Gustafsson, ¨O.: Carbon transport by the Lena River from its headwaters to the Arctic Ocean, with emphasis on fluvial input of terrestrial particulate
25
organic carbon vs. carbon transport by coastal erosion, Biogeosciences, 8, 2407–2426, doi:10.5194/bg-8-2407-2011, 2011.
Shakhova, N., Semiletov, I., and Panteleev, G.: The distribution of methane on the Siberian Arctic shelves: Implications for the marine methane cycle, Geophys. Res. Lett., 32, L09601, doi:10.1029/2005gl022751, 2005.
30
BGD
9, 16213–16237, 2012
Distribution of methane in the Lena Delta and Buor Khaya
Bay, Russia
I. Bussmann
Title Page
Abstract Introduction
Conclusions References
Tables Figures
◭ ◮
◭ ◮
Back Close
Full Screen / Esc
Printer-friendly Version
Interactive Discussion
Discussion
P
a
per
|
Dis
cussion
P
a
per
|
Discussion
P
a
per
|
Discussio
n
P
a
per
|
Shakhova, N., Semiletov, I., Salyu, A., Yusupov, V., Kosmach, D., and Gustafsson, ¨O.: Exten-sive methane venting to the atmosphere from sediments of the East Siberian Arctic Shelf, Science, 327, 1246, doi:10.1126/science.1182221, 2010.
Symon, C., Arris, L., Heal, B., and Symon, C.: Arctic Climate Impact Assessment – Scientific Report, Cambridge University Press, Cambrigde, 1046 pp., 2005.
5
Walter, K. M., Chanton, J. P., Chapin III, F. S. C., Schuur, E. A. G., and Zimov, S. A.: Methane production and bubble emissions from arctic lakes: Isotopic implications for source pathways and ages, J. Geophys. Res., 113, G00A08, doi:10.1029/2007JG000569, 2008.
Wanninkhof, R.: Relationship between wind speed and gas exchange over the ocean, J. Geo-phys. Res., 97, 7373–7382, 1992.
10
Wiesenburg, D. A. and Guinasso, N. L.: Equilibrium solubilities of methane, carbon monoxide and hydrogen in water and sea water, J. Chem. Eng. Data, 24, 356–360, 1979.
Yang, D., Kane, D. L., Hinzman, L. D., Zhang, X., Zhang, T., and Ye, H.: Siberian Lena River hydrologic regime and recent change, J. Geophys. Res., 107, 4694, doi:10.1029/2002jd002542, 2002.
BGD
9, 16213–16237, 2012
Distribution of methane in the Lena Delta and Buor Khaya
Bay, Russia
I. Bussmann
Title Page
Abstract Introduction
Conclusions References
Tables Figures
◭ ◮
◭ ◮
Back Close
Full Screen / Esc
Printer-friendly Version
Interactive Discussion
Discussion
P
a
per
|
Dis
cussion
P
a
per
|
Discussion
P
a
per
|
Discussio
n
P
a
per
|
Fig. 4.Distribution of methane concentrations (in nmol L−1
BGD
9, 16213–16237, 2012
Distribution of methane in the Lena Delta and Buor Khaya
Bay, Russia
I. Bussmann
Title Page
Abstract Introduction
Conclusions References
Tables Figures
◭ ◮
◭ ◮
Back Close
Full Screen / Esc
Printer-friendly Version
Interactive Discussion
Discussion
P
a
per
|
Dis
cussion
P
a
per
|
Discussion
P
a
per
|
Discussio
n
P
a
per
|
Fig. 9.Fraction of methane oxidised in waters of Buor Khaya Bay in 2010. The end member of the Rayleigh curve is based on the data set with the highest methane concentration (102 nM) and the corresponding isotope signature of−34.96 ‰ VPDB. The curves show the prospective