Journal of Physics and Chemistry of Solids 69 (2008) 1897–1904
Synthesis of titania/carbon nanocomposites
by polymeric precursor method
Neftali L.V. Carren˜o
a,, Irene T.S. Garcia
a, Leidne S.S.M. Carren˜o
a, Michael R. Nunes
a,
Edson R. Leite
b, Humberto V. Fajardo
c, Luiz F.D. Probst
caInstituto de Quı´mica e Geocieˆncia, DQAI, Universidade Federal de Pelotas, CP-354, CEP-96010–900, Capa˜o do Lea˜o, RS, Brazil bLIEC/CMDMC–Departamento de Quı´mica, Universidade Federal de Sa˜o Carlos, Via Washington Luiz, Km 235, CP-676,
CEP-13565–905, Sa˜o Carlos, SP, Brazil
cDepartamento de Quı´mica, Universidade Federal de Santa Catarina, CEP 88040–900 Floriano´polis-SC, Brazil Received 22 November 2006; received in revised form 9 July 2007; accepted 26 January 2008
Abstract
Here we describe a single chemical route to obtain highly dispersed nanometric Ni particles embedded in titania/carbon matrixes (amorphous and crystalline). The synthesis of these nanocomposites is based on a polymeric precursor method. The metallic Ni nanoparticles (1–15 nm) were obtained in a single process. We also present the results of photocatalytic experiments involving a series of nanocrystalline composites based on TiO2/carbon with embedded Ni nanoparticles as nanocatalysts for rhodamine 6G degradation in
aqueous solution and investigate the effects of the structure and properties of the nanocomposites on their photocatalytic applications. The effect of the different annealing treatments on the formation of TiO2nanophases (anatase and/or rutile), the size of Ni particles and
the role of the residual carbon phase on the final solid are also described.
r2008 Elsevier Ltd. All rights reserved.
1. Introduction
Several methods for the synthesis of the Ni/TiO2 catalysts have been recently reported in the literature
[1–3]. These experimental procedures offer techniques that
can lead to a significant enhancement of properties that are relevant to technological applications. The crystalline forms of TiO2 (anatase, brookite and rutile) have been functionalized with Ni metal particles. The different interfacial interactions of this transition metal on titania supports can be directly affected by the chemical route and precursor material used in the preparation of Ni/TiO2 catalysts [4]. The properties of materials based on a modified titania matrix have been extensively studied, the main interest being in their unique electrochemical, optical, catalytic, semi-conducting and redox properties [2–4].
Additionally, due to their low toxicity, appropriate energy band configurations for charge transfer at the interface, and absorption in the near UV range, titania-based catalysts are widely used in photocatalysis [4]. These catalysts, which offer great potential in environmental decontamination, particularly in the degradation of volatile organic compounds (VOC) [3,4], are often synthesized by sol–gel processes [5–7]. The size distribution, shape, and structure of supported metal nanoparticles influence the catalytic properties in ways that are still incompletely understood [2,3,8,9]. For example, Visinescu et al. [10] found that the photocatalytic activity of thin titania films was strongly influenced by the amount and the deposition conditions of the nickel. Li et al. [1]observed evidence for preferential nucleation and growth of Ni particles on titania supports (anatase and/or rutile) and demonstrated the importance of a precise control of the size and morphology of the nanoparticles in order the optimize the catalytic properties[1].
In this paper we report the modification of the method developed by Leite et al.[11]to synthesize nanocomposites
www.elsevier.com/locate/jpcs
0022-3697/$ - see front matterr2008 Elsevier Ltd. All rights reserved. doi:10.1016/j.jpcs.2008.01.014
Corresponding author.
based on a TiO2matrix with embedded Ni nanoparticles. This new, in situ, bottom-up chemical process was recently used in the synthesis of nanometric Ni particles embedded in a mesoporous silica/carbon matrix [11–12]. This direct process for obtaining several nanocomposites consists of the formation of hybrid polymers composed of C, H, O and metal cations arrested within the macromolecule chain, followed by a controlled pyrolysis step. The CO/CO2 atmosphere formed during this step promoted the reduc-tion of the metal salt. The study of the catalytic [12] and magnetic [13] performance of this material has revealed interesting properties strongly dependent on the metal–metal and matrix–metal interactions, and on the nanoparticle size. However, the relationships between the processing conditions, structure and properties are not well understood. This information would allow the prediction and tailoring of the nanocomposite properties of new systems, such as titania/carbon doped with transition metal nanoparticles. In this regard, the present study aimed to obtain photocatalytic nanocomposites with different compositions as catalysts for the photochemical degrada-tion of rhodamine 6G. Rhodamine 6G is used as a test pollutant molecule, since it is known to create serious problems in the environment [14]. The role of transition metal nanoparticles embedded in the titania/carbon matrix in the thermal stability and morphology of the catalysts as well as on the process of the photocatalytic degradation of dyes is shown. The effect of the different annealing treatments on the formation of anatase and/or rutile nanophases, the particle size of Ni and the TiO2 derivatives, and the role of the residual carbon phase (carbonaceous material) is described.
2. Experimental procedure
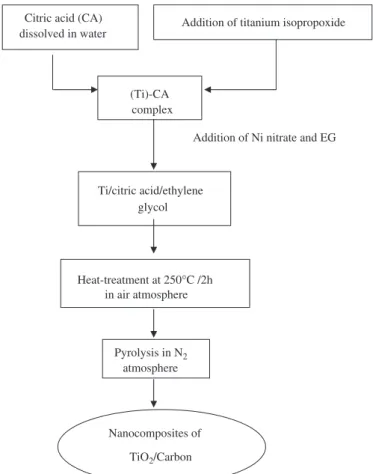
The chemical process used for the preparation of the samples consists of the formation of a Ti–citrate complex (containing the Ni-salt), followed by a polymerization step with ethylene glycol (EG), as can be seen in the flowchart
of Fig. 1. The preparation and characterization of the
intermediate titanium citrate has been described by Zampieri et al. [7]and Kakihana et al.[15]. The reported results show the role of the synthesis method on the ceramic materials obtained.
In this study, we prepared the nanocomposites by dissolving citric acid (Aldrich) in a mixture of water and titanium isopropoxide (Aldrich). Nickel nitrate (Ni (NO3)26H2O; Aldrich) was then added and the mixture was homogenized for 15 min at room temperature.
A citric acid/metal ratio of 3:1 (in mol) was used. The metal concentration is the sum of Ti and Ni, thus, Ti:Ni ratios of 5:1 and 5:2 (mol) were prepared. The polymeriza-tion was initiated by adding EG to the metal/citrate solution, at a mass ratio of 40:60 in relation to the citric acid [1]. The Ni content of the final composites was determined by atomic absorption spectroscopy using a Hitachi-Z8230 instrument.
The nanocomposites were obtained by a two-step pyrolysis of the polymeric intermediate. The first step (2 h at 2501C, in air) promoted the breakage of the organic part of the polymeric intermediate. After this step, the material was milled in a ball mill, yielding a fine powder. This fine powder was submitted to a second heat treatment, performed in a N2atmosphere, at temperatures higher than 4001C, during which the nanocomposites were formed. The temperatures used were selected on the basis of previous thermogravimetric (TG) analysis. A conventional TiO2sample catalyst was also prepared for a comparative photocatalytic study with the nanocomposite samples. A single process of titanium isopropoxide (Adrich) pyrolysis at 4001C, for 6 h in an O2atmosphere, was used to obtain the conventional TiO2 sample catalyst. The quantitative analysis of the carbon content in the conventional TiO2 sample was monitored by elemental analysis, using a FISONS EA 1108 CHN analyzer, and carbon contamina-tion was not observed.
The pyrolysis step was followed by TG analysis (model 409 Netzsch, Selb, Germany), using a 51C/min heating rate under a N2flow of 20 cm
3
/min and 10 mg of sample. The nanocomposite powders were characterized by elemental analysis to determine the total coke content after the catalytic test. The crystal structure of the nanocomposites was characterized by XRD (Model D-5000, Siemens,
Citric acid (CA) dissolved in water
Addition of titanium isopropoxide
(Ti)-CA complex
Addition of Ni nitrate and EG
Heat-treatment at 250°C /2h in air atmosphere
Pyrolysis in N2 atmosphere
Nanocomposites of
TiO2/Carbon Ti/citric acid/ethylene
glycol
Karlsruhe, Germany), using CuKa radiation with a graphite monochromator.
X-ray photoelectron spectroscopy (XPS) analysis was performed using a commercial VG ESCA 3000 system operating at a pressure of 10–10 mbar. The spectra were collected using MgKaradiation with an overall resolution of approximately 0.8 eV. The concentrations of the surface elements were calculated using the system database after subtracting the background counts. The C 1s peak was used as the standard for the calibration of the binding energies.
The microstructure of the composites was investigated by scanning electron microscopy (SEM) using a SEM, DSM 940A microscope (Zeiss, Germany) and by transmis-sion electron microscopy (TEM) using a Philips CM200 microscope operated at an acceleration voltage of 200 kV. For the TEM analysis, a drop of the suspended composite was deposited on a carbon-covered copper grid.
Specific surface area and pore volume of the nanocom-posites were determined by N2 adsorption/desorption isotherms, at liquid nitrogen temperature, using an Autosorb-1C analyzer (Quantachrome Instruments). The metallic Ni surface on the titania support was also investigated through chemisorption analysis. The prior H2activation of the individual samples was necessary for this specific chemisorption test. A powder sample (40–50 mg, reduced at 4001C in H2 flow) was outgassed at 3001C for 2 h before the metal area measurements. Despite that XRD analysis for the Ni/TiO2 nanocompo-sites was carried out immediately after the pyrolysis step of the polymeric a peak corresponding to the Ni metal phase is present. However, it is possible that there is an ultra-thin oxide layer present on the Ni metal particles, inhibiting the clear identification of externally exposed active sites on surface of TiO2/carbon matrix. Thus, the H2chemisorption of the catalysts was performed at 271C after the reduction of the sample (0.5 g) in a flow of H2(30 cm3/min) at 4001C (101C/min) for 1 h and evacuation for 1 h at the same temperature monitored using Quantachrome instruments.
For some of the photocatalytic experiments a UV lamp (based on mercury) was used as a light source to degrade the rhodamine G (1105M; Aldrich) in the presence of the synthesized nanocomposites as catalysts and the degradation of the rhodamine was monitored with a Varian (5G) UV-spectrometer. We used similar procedures to determine the photocatalytic activity of conventional, crystalline TiO2 (with both anatase and rutile phases). In order to check the reproducibility of the photocatalytic behavior each sample was tested in several runs.
3. Results and discussion
3.1. Nanocomposite formation
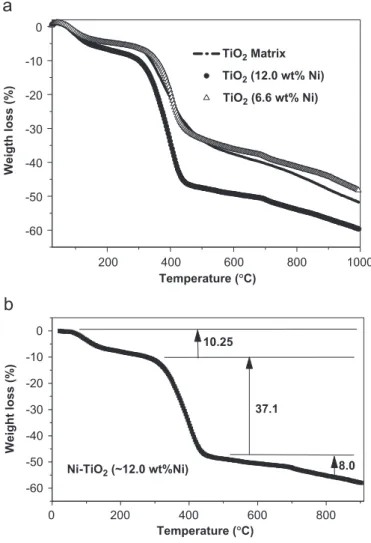
Fig. 2 shows the TG analysis of the intermediate
polymers with different Ni contents (0, 6.6 and 12.0 wt%). For all samples a well-defined weight loss at
around 2001C was observed, which is associated with the breakage of the organic part of the hybrid polymeric intermediate. Additional weight losses were observed above 350 and above 5001C for TiO2and Ni–TiO2/carbon samples as illustrated in Fig. 2b for the Ni–TiO2 (12.0 wt% Ni) sample. This sample showed a weight loss of 37.1% between 350 and 4001C and a weight loss of 8.0% between 500 and 9001C. The weight loss between 350 and 4001C was attributed to the formation of a carbon-aceous material phase.
As mentioned above, based on these thermogravimetric results the pyrolysis of the polymeric intermediate was carried out in two steps; one at 2501C in air to break the organic part of the polymer and a second at temperatures higher than 4001C in nitrogen atmosphere for the formation of a nanocomposite (TiO2/carbon) phase. This two-step pyrolysis results in the formation of a carbonac-eous material, as corroborated by elemental analysis (CHN analysis), which revealed that after the second heat-treatment step the carbon content varied between 29–38 wt% as a function of the annealing treatment and the Ni metal content. The presence of a significant amount
200 -60
-50 -40 -30 -20 -10 0
Weigth loss (%)
Temperature (°C) TiO2 Matrix
TiO2 (12.0 wt% Ni)
TiO2 (6.6 wt% Ni)
0 -60 -50 -40 -30 -20 -10 0
Ni-TiO2 (~12.0 wt%Ni)
10.25
Weight loss (%)
Temperature (°C)
8.0 37.1
1000 800
600 400
800 600
400 200
of carbon residues during the annealing contributes to changes in the surface of Ni–TiO2/carbon systems.
During the pyrolysis the breaking of the organic macromolecule generates a CO/CO2-rich atmosphere which promotes the reduction of the Ni salt and the formation of metal nanoparticles in a polymorph matrix (crystalline and amorphous) formed basically of TiO2and residual amorphous carbon. These Ni particles are preferentially embedded within the crystalline matrix and are not deposited on the matrix surface[9,11,12].
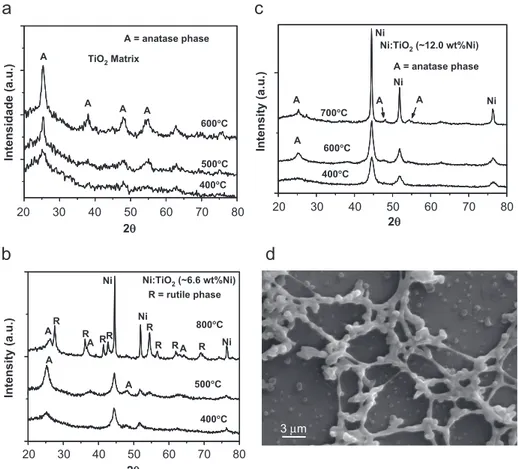
The crystal structure of the nanocomposites and the respective patterns are presented inFig. 3a–c. The patterns of the Ni-containing composites (Fig. 3b and c) indicate the presence of metallic nickel, thus confirming the reduction of the Ni salts by the CO/CO2 atmosphere generated during the pyrolysis of the polymeric precursor material. The X-ray diffraction pattern of the TiO2/carbon nano-composite, as a function of the annealing temperature, is shown inFig. 3a. In this pattern the peaks can be ascribed to the tetragonal anatase phase of crystalline TiO2. The tetragonal rutile phase was not formed during the annealing of the TiO2/carbon and Ni–TiO2/carbon (12.0 wt% Ni) matrixes at temperatures up to 600 and 7001C. However, for the Ni–TiO2(6.6 wt% Ni) sample, the formation of rutile was observed at an annealing temperature of 8001C (Fig. 3b), and was also observed for
pure titania, where the anatase to rutile transformation takes place at around 7801C[16]. The XRD patterns of all composites (Fig. 3a–c) also show that the amount of amorphous phase decreases with an increase of the annealing temperature.
Fig. 3d shows the scanning electron micrograph of the
Ni–TiO2/carbon (6.6 wt% Ni) sample annealed at 5001C, which shows the typical ribbon-shaped morphology of the nanocomposite particles, which was also observed for the Ni–TiO2(12.0 wt% Ni) sample (not shown).
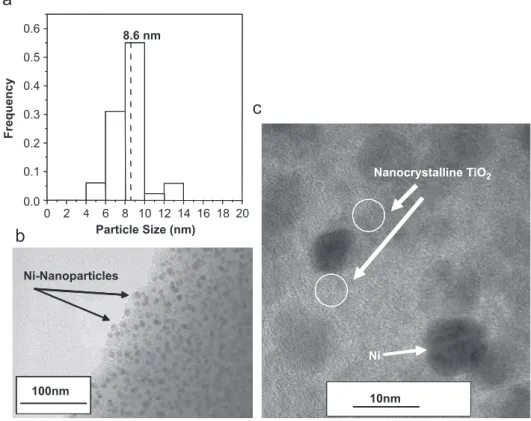
Fig. 4a demonstrates the particle size distribution of the
Ni–TiO2(6.6 wt% Ni) sample determined from its bright field-TEM image shown inFig. 4b. In this micrograph the Ni nanoparticles are observed as dark spots well dispersed within the TiO2/carbon matrix, with a mean particle size of 8.6 nm (Fig. 4a). The regular arrangement of the Ni nanoparticles embedded within the TiO2/carbon matrix suggests a high dispersion, as confirmed by the highest values determined for the metallic dispersion on the surface of the Ni–TiO2 (6.6 wt% Ni) sample, given in Table 1. These observations are in agreement with the results of previous studies reported by Rouiller and Assaf [17] and Navarro et al. [18]. Fig. 4c shows the high resolution transmission electron micrograph of the Ni:TiO2/carbon (6.6 wt% Ni) nanocomposite, which confirms the pre-sence of TiO2 (anatase) nanocrystals with particle sizes
20 A
Intensidade (a.u.)
20
R = rutile phase
Intensity (a.u.)
20
Intensity (a.u.)
A
A A
A R
R
A R R R
A
Ni Ni
Ni
R R
A
A R
A
A A A
Ni
Ni A = anatase phase Ni
3 μm
2θ
80 70 60 50 40 30
2θ
80 70 60 50 40 30
2θ
80 70 60 50 40 30
A = anatase phase
TiO2 Matrix
600°C
500°C
400°C
700°C
600°C
400°C
Ni:TiO2 (~12.0 wt%Ni)
800°C
500°C
400°C Ni:TiO2 (~6.6 wt%Ni)
Fig. 3. XRD patterns of powders: (a) TiO2/carbon matrix; (b) Ni–TiO2/carbon (6.6 wt% Ni), (c) Ni–TiO2/carbon (12.0 wt% Ni) annealed at different temperatures in a N2atmosphere; and (d) scanning electron microscopy image for sample Ni–TiO2/carbon (6.6 wt% Ni) annealed at 5001C, for 1 h, in a
below 2.0 nm in the circled area, as previously observed by XRD analysis, and allows the observation of the Ni particles (diameter around 8.6 nm). Additional information on the textural properties of the nanocomposites (surface area, crystallite size, average pore diameter, particle size and metal dispersion) is summarized in Table 1. The crystallite size of the metal component of the nanocompo-sites in the titania matrix studied was determined using the Scherrer equation, using the (1 1 1) diffraction peak[19]. In this study, the diffraction peak profile was fitted using a pseudo-Voigt function to calculate the full-width at half-maximum (FWHM). The mean particle size was also estimated by TEM, examining different regions of the samples. The mean particle size values thus obtained are in good agreement with the crystallite sizes determined by
XRD (see Table 1). Furthermore, the result obtained for the Ni–TiO2 (12.0 wt% Ni) sample may be associated with lower distributions and agglomeration of the Ni metallic sites on the surface of TiO2/carbon matrix. Thus, the increase in Ni concentrations also promoted a slight increased in Ni particle size in this nanocomposite system.
Fig. 5 shows the (a) HRTEM and (b) bright field-TEM
image of Ni:TiO2/carbon (12.0 wt% Ni), annealed at 5001C for 1 h, in a N2 atmosphere, and the particle size diameter is significantly greater than that observed for the Ni:TiO2/carbon (6.6 wt% Ni) sample. The Ni:TiO2/ carbon (12.0 wt% Ni) powder also shows the presence of agglomerates constituted of Ni nano-sized particles.
To investigate the nanocomposite surface and the effect of the residual carbon on it, X-ray photoemission 0
0.0 0.1 0.2 0.3 0.4 0.5 0.6
8.6 nm
Particle Size (nm)
10nm
Ni-Nanoparticles
Nanocrystalline TiO2
Ni
Frequency
10nm 10nm 20
18 16 14 12 10 8 6 4 2
100nm
10nm
Fig. 4. The Ni:TiO2/carbon (6.6 wt% Ni), annealed at 4001C for 1 h, in a N2 atmosphere: (a) mean particle size and frequency; (b) bright field-transmission electron Microscopy image; and (c) high-resolution field-transmission electron microscopy (HRTEM) image.
Table 1
Crystallite size (average diameter-X-ray), particle size (TEM), BET specific surface area, average pore diameter and metallic dispersion of the Ni nanoparticles, for nanocomposites at different pyrolysis temperatures
X%—Sample Pyrolysis temperature (1C)
BET surface area (m2g)
PD(A˚) Db(nm) DTEM(nm) Metallic dispersion
(%)
6.6%—Ni:TiO2 400 10 148 7.7 8.6 47
12%—Ni:TiO2 400 2 139 7.8 9.0 17
12%—Ni:TiO2 500 3 117 8.4 10.2 –
X%¼atomic percentage of Ni, determined by atomic absorption.
PD¼average pore diameter.
Db¼crystallite size determined from line-broadening measurements of the (1 1 1) Ni peak, using the Scherrer Eq. (19).
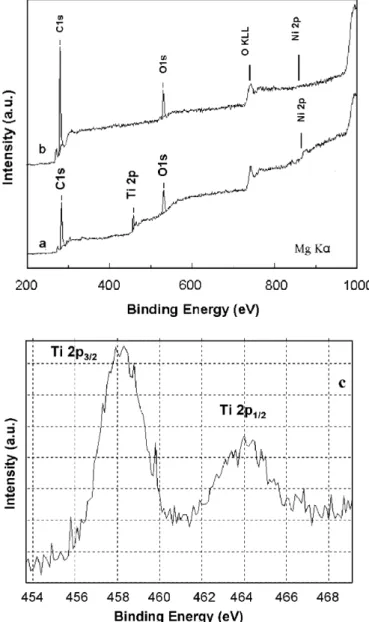
experiments were carried out with the Ni–TiO2/carbon (12.0 wt% Ni) sample, (Fig. 6). The weak, slightly broad, peak assigned to nickel Ni 2p3/2binding energies of Ni2+ and Nio, at around between 854 and 852 eV, can be observed inFig. 6a[20]. The value for the Ni concentration (%) on the surface of the samples (basically formed by carbonaceous material and TiO2) determined by XPS is much lower than that determined by metallic dispersion analysis (in Table 1). This suggests that the Ni nanopar-ticles are embedded in the TiO2/carbon denser matrix. In addition, the XPS result for the Ni–TiO2/carbon (12.0 wt% Ni) sample (Fig. 6a) can be compared to the nanocomposite formed of only Ni metal nanoparticles and a carbonaceous matrix (27.0 wt% Ni in carbon,Fig. 6b). This sample was prepared by a similar chemical method, without the presence of the titanium citrate complex. Its XRD pattern (not shown) confirms the formation of a carbon-based material with an amorphous phase and Ni metal as the only crystalline phase. However, the XPS spectrum (Fig. 6b) does not show Ni at the surface of the
carbon matrix, i.e., the Ni 2p3/2peak is absent, indicating that practically all of the Ni is embedded in the carbon matrix. Analysis of the textural properties of the crystalline Ni nanoparticles embedded in the carbon matrix revealed the formation of a typical microporous material with a large specific surface area and high porosity[9], where the residual carbon works as a textural promoter, protecting the metal particles inside the porous matrix. This has been observed in a previous study on ceria derived catalysts for CO2reforming of CH4[9]. In contrast, the Ni particles of Ni–TiO2/carbon nanocomposites present were slightly exposed at the external surface of the matrix, as is indicated by the Ni 2p3/2 peak in Fig. 6a. These Ni particles are in a denser matrix with low specific surface area, however, the presence of significantly smaller average pore diameters may be associated with textural changes due to the presence of residual carbonaceous material.
Nanocrystalline TiO2
Ni-Nanoparticles
a
b
Fig. 5. The Ni:TiO2/carbon (12.0 wt% Ni), annealed at 5001C for 1 h, in
a N2 atmosphere: (a) high-resolution transmission electron microscopy (HRTEM) image; (b) bright field-transmission electron microscopy image.
Fig. 6. XPS survey spectrum for (a) Ni–TiO2/carbon (12.0 wt% Ni);
(b) carbon matrix (27.0 wt% Ni); (c) Ni–TiO2/carbon (12.0 wt% Ni)
Nagaoka et al.[21]described the synthesis of precursors based on cellulose and TiO2 particles to obtain carbon/ TiO2 microspheres with different surface textures and chemical properties, which they assigned to the presence of carbon. According to these observations and our results, the low nickel concentration detected at the surface of Ni–TiO2/carbon composites, particularly in the case of the Ni–carbon composite, is attributed to the chemical process, which allows us to obtain a homogenous Ni distribution in the polymeric intermediate. This intermediate is subse-quently transformed into Ni nanoparticles embedded in the ceramic matrix, along with residual carbon, through the annealing treatment.
Figs. 6a and c show the binding energies of the Ti 2p
photoelectron peaks at 458.5 and 464.4 eV which corre-spond to the Ti 2p3/2and 2p1/2peaks, respectively[23]. The Ti 2p3/2 binding energy indicates that Ti exists in a 4+ oxidation state, as is expected for TiO2 (anatase), the presence of which was observed by XRD and HRTEM.
3.2. Photocatalytic study of nanocomposites
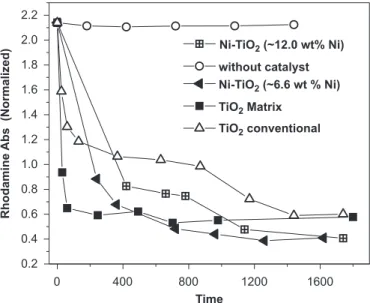
In order to investigate the effect of Nio nanoparticles embedded in the nanocrystalline matrix, their photocata-lytic properties in the photodegradation of rhodamine 6G were investigated. Fig. 7 shows the results of this photocatalytic degradation, which was carried out in aqueous solution to evaluate the efficiency of the photo-decomposition of organic pollutants by different Ni–TiO2/ carbon catalyst system, annealed at 4001C. The results indicate that the efficiency of the photodecomposition increased strongly when the nanocrystalline TiO2 matrix (prepared by polymeric precursor method) was used instead of a conventional TiO2 catalyst. Also, the Ni
embedded in the nanocomposites prepared by synthesis based on a polymeric precursor, demonstrates a very significant improvement of their activity. However, the observed initial degradation rate and efficiency of the TiO2 polymorph matrix (nanocrystalline anatase) was higher than that observed for Ni–TiO2 nanocomposites. There-fore, the presence of Ni leads to a decrease in the photocatalytic activity of the TiO2nanocomposites. How-ever, the Ni–TiO2/carbon nanocomposites, show a more significant effect on the degradation rate than conventional TiO2. This higher photocatalytic efficiency of TiO2/carbon matrixes synthesized by a chemical process, which contain residual carbon, support our results regarding the role of residual carbon at the surface of the nanocomposites in concentrating the target molecules of the photocatalytic process, at the TiO2surface [23,24]. Thus, the degradation of organic molecules, like Rhodamine 6G, seems to be due to their surface diffusion to the active centers on the surface of the TiO2 photocatalyst, which is mainly influenced by the residual porous carbon at the surface. In addition, the nickel nanoparticles (transition metal) may improve the trapping of electrons, inhibiting electron-hole recombina-tion during the photocatalytic process [2,10,21], through the rapid transfer of the photogenerated electrons from TiO2 to the metal nanoparticles, resulting in a modified separation of the electrons and holes [14,22]. Visinescu et al. [10]found that in the photocatalytic decomposition of acetone by Ni-doped thin film titania catalysts, the presence of Ni has a strong influence on the photocatalytic properties, and that there is a limited Ni concentration range for the enhancement of the activity of titania catalysts. Several authors suggest that the role of the doping ions and transition metal in the modification of the titania photocatalytic properties is not completely under-stood and recommend further investigations [2,10,25]. Additional carbonaceous deposits on alumina, when used as supports for platinum, resulted in very selective catalysts [26]. The modification of semiconductors involving transi-tion metals and ions has become an attractive approach to finding other properties such as catalytic selectivity and gas sensing.
4. Conclusions
The results here presented demonstrate the possibility to obtain Ni metal nanoparticles embedded within TiO2/ carbon nanocomposites, using a sol–gel synthesis route. This microstructural feature, Ni nanoparticles embedded within a crystalline, amorphous or polymorphic matrix powder, also constituted of nano-size crystallite TiO2, obtained by a single annealing treatment, can result in new materials with interesting catalytic applications. Additionally, the presence of residual amorphous carbon influences the nature of the matrix support and surface properties. Thus, there is considerable interest in preparing nanocomposite materials with completely controlled architectures that can be tailored for specific technical 0
0.2 0.4 0.6 0.8 1.0 1.2 1.4 1.6 1.8 2.0 2.2
Rhodamine Abs
(Normalized)
Ni-TiO2 (~12.0 wt% Ni)
without catalyst Ni-TiO2 (~6.6 wt % Ni)
TiO2 Matrix
TiO2 conventional
1600 1200
800
Time
400
applications, such as photocatalysis, and host other metallic particles.
Acknowledgments
The authors acknowledge the following Brazilian fund-ing support agencies: CNPq, FINEP/CT-PETRO and FAPERGS/PROADE.
References
[1] P. Li, J. Liu, N. Nag, P.A. Crozier, Surf. Sci. 600 (2006) 693–702. [2] C.C. Cheng, X.Z. Li, W.H. Ma, J.C. Zhao, H. Hidaka, N. Serpone,
J. Phys. Chem. B 106 (2002) 318–324.
[3] M. Asilturk, F. Sayılkan, S. Erdemoglu, M. Akarsu, H. Sayılkan, M. Erdemoglu, E. Arpac, J. Hazardous Mater. B 129 (2006) 164–170. [4] S.W. Ho, C.Y. Chu, S.G. Chen, J. Catal. 178 (1998) 34.
[5] E.R. Leite, N.L.V. Carren˜o, L.P.S. Santos, J.H. Rangel, L.E.B. Soledade, E. Longo, C.E.M. Campos, F. Lanciotti, P.S. Pizani, J.A. Varela, Appl. Phys. A 73 (2001) 567–569.
[6] T. Sreethawong, Y. Suzuki, S. Yoshikawa, Int. J. Hydrogen Energy 30 (2005) 1053–1062.
[7] M. Zampieri, S.R. Lazaro, C.A. Paskocimas, A.G. Ferreira, E. Longo, J.A. Varela, J. Sol–Gel Sci. Tech. 37 (2006) 9–17. [8] N.L.V. Carren˜o, E.R. Leite, E. Longo, P.N. Lisboa-Filho,
A. Valentini, L.F.D. Probst, W.H. Schreiner, J. Nanosci. Nanotech. 2 (2002) 491–494.
[9] A. Valentini, N.L.V. Carren˜o, L.F.D. Probst, A. Barison, A.G. Ferreira, E.R. Leite, E. Longo, Appl. Catal. A. Gen. 310 (2006) 174–182.
[10] C.M. Visinescu, R. Sanjines, F. Levy, V.I. Parvulescu, Appl. Catal. B: Environ. 60 (2005) 155–162.
[11] E.R. Leite, N.L.V. Carren˜o, E. Longo, F.M. Pontes, A. Barison, A.G. Ferreira, Y. Maniette, J.A. Varela, Chem. Mater. 14 (2002) 3722–3729.
[12] N.L.V. Carren˜o, E.R. Leite, E. Longo, P.N. Lisboa-Filho, A. Valentini, L.F.D. Probst, W.H. Schreiner, J. Nanosci. Nanotech. 2 (2002) 491–494.
[13] F.C. Fonseca, G.F. Goya, R.F. Jardim, R. Mucillo, N.L.V. Carren˜o, E. Longo, E.R. Leite, Phys. Rev. B 66 (2002) 104406–104411. [14] Y. Miyajima, S. Mizoguchi, A. Nakamura, Y. Kuroiwa, Y.Y. Kato,
T. Watanabe, Chem. Lett. 35 (2006) 1034–1035.
[15] M. Kakihana, M. Arima, Y. Nakamura, M. Yashima, M. Yoshimura, Chem. Mater. 11 (1999) 438–450.
[16] J. Yang, Y.X. Huang, J.M.F. Ferreira, J. Mater. Sci. Lett. 16 (1997) 1935–1937.
[17] C.O. Rouiller, J.M. Assaf, Chem. Eng. Sci. 51 (1996) 2921–2925. [18] R.M. Navarro, M.C. Alvarez-Galvan, F. Rosa, J.L.G. Fierro, Appl.
Catal. A. Gen. 297 (2006) 60–72.
[19] N.L.V. Carreno, E.R. Leite, L.PS. Santos, P.N. Lisboa, E. Longo, G.C.L. Araujo, A. Barison, A.G. Ferreira, A. Valentini, L.F.D. Probst, QUIMICA NOVA 25 (2002) 935–942.
[20] K. Takanabe, K. Nagaoka, K. Nariai, K. Aika, J. Catal. 232 (2005) 268–275.
[21] S. Nagaoka, Y. Hamasaki, S. Ishihara, M. Nagata, K. Iio, C. Nagasawa, H. Ihara, J. Mol. Catal. A Chem. 177 (2002) 255–263.
[22] C. Minero, F. Catozzo, E. Pelizzetti, Langmuir 8 (1992) 481–486. [23] B.M. Reddy, K.N. Rao, G.K. Reddy, P. Bharah, J. Mol. Catal. 253
(2006) 44–51.
[24] K. Hirano, H. Asayama, A. Hiroshino, H. Wakatsuki, J. Photochem. Photobiol. A 110 (1997) 307.
[25] C. Minero, G. Marirlla, V. Maurino, E. Pelizzetti, Langmuir 16 (2000) 2632–2641.