Screening of Antioxidant Properties of the Apple Juice Using
the Front-Face Synchronous Fluorescence and Chemometrics
Katarzyna Włodarska1&Katarzyna Pawlak-Lemańska1
&Igor Khmelinskii2&
Ewa Sikorska1
Received: 21 May 2016 / Accepted: 7 November 2016 / Published online: 16 November 2016 # The Author(s) 2016. This article is published with open access at Springerlink.com
Abstract Fluorescence spectroscopy is gaining increas-ing attention in food analysis due to its higher sensitivity and selectivity as compared to other spectroscopic tech-niques. Synchronous scanning fluorescence technique is particularly useful in studies of multi-fluorophoric food samples, providing a further improvement of selectivity by reduction in the spectral overlapping and suppressing light-scattering interferences. Presently, we study the fea-sibility of the prediction of the total phenolics, flavo-noids, and antioxidant capacity using front-face synchro-nous fluorescence spectra of apple juices. Commercial apple juices from different product ranges were studied. Principal component analysis (PCA) applied to the un-folded synchronous fluorescence spectra was used to compare the fluorescence of the entire sample set. The regression analysis was performed using partial least squares (PLS1 and PLS2) methods on the unfolded total synchronous and on the single-offset synchronous fluo-rescence spectra. The best calibration models for all of the studied parameters were obtained using the PLS1 method for the single-offset synchronous spectra. The models for the prediction of the total flavonoid content had the best performance; the optimal model was obtain-ed for the analysis of the synchronous fluorescence spec-tra at Δλ = 110 nm (R2 = 0.870, residual predictive devi-ation (RPD) = 2.7). The optimal calibrdevi-ation models for the
prediction of the total phenolic content (Δλ = 80 nm, R2= 0.766, RPD = 2.0) and the total antioxidant capacity (Δλ = 70 nm, R2
= 0.787, RPD = 2.1) had only an approxi-mate predictive ability. These results demonstrate that syn-chronous fluorescence could be a useful tool in fast semi-quantitative screening for the antioxidant properties of the apple juices.
Keywords Apple juice . Total phenolics . Total flavonoids . Synchronous fluorescence . Partial least squares regression
Introduction
Phenolic compounds account for the metabolic activity and antioxidant properties of plant-based foods and for the puta-tive health benefits to humans (Scalbert et al. 2005). Moreover, polyphenols affect organoleptic properties of foods: their color, flavor, astringency, and hardness (Robbins
2003). The assessment of polyphenolic compounds and their antioxidant activity is one of important aspects of quality stud-ies of many foods.
The HPLC method is mainly used for the assessment of individual phenolics, coupled with absorbance, mass spectro-metric, or fluorimetric detection (Corradini et al.2011; Ignat et al.2011; Pyrzynska and Sentkowska2014).
Spectrophotometric methods based on specific reactions are commonly used for the analysis of the overall antioxidant contents, or of specific classes of antioxidants. In particular, the Folin–Ciocalteu assay is widely used for determining the total phenolics. The total flavonoid contents may be deter-mined using a colorimetric method based on the complexation with Al(III) (Ignat et al.2011).
The spectrophotometric assays of the total antioxidant ca-pacity of foods are usually based on comparing the sample
* Ewa Sikorska
1
Faculty of Commodity Science, Poznań University of Economics and Business, al. Niepodległości 10, 61-875 Poznań, Poland
2 Universidade do Algarve, FCT, DQF and CIQA, Campus de
ability to scavenge free radicals or reduce other chemicals to that of a reference compound (Craft et al.2012).
Spectroscopic methods coupled with chemometrics pro-vide an alternative to the conventional measurements, partic-ularly in the screening or/and routine analysis. They are wide-ly used in the assessment of food quality. The spectra serve as the product fingerprints in such applications. The relationship between the spectra and the qualitative or quantitative product properties is established using either multivariate classifica-tion or regression methods. The multivariate models, once developed, may be used to predict the properties of new sam-ples by their spectra. The measurements are simple and fast and may be performed on samples directly without pre-treatment or using chemical reagents. This feature enhances the labor-, time-, and cost-effectiveness of the analysis. The procedure is environmentally friendly and complies with the requirements for the green analytical chemistry (Armenta et al.2008).
Quantification of the bioactive compounds and functional properties by use of spectroscopy is one of the important ap-plication areas for these methods. The apap-plication of infrared spectroscopy combined with chemometrics for determination of the antioxidant contents and antioxidant capacity has been recently reviewed (Cozzolino2015; Lu and Rasco2011).
The vibrational spectra in the near- (NIR) and mid-infrared (MIR) ranges provide structural information about the organic components and thus are used for quantifying both major and minor food constituents (Cozzolino2015; Nicolaï et al.2007). Depending on the complexity of the food matrix, chemical character, and concentration of the analyte, the sensitivity of these techniques to minor constituents may be quite low. This problem is especially frequent in plant-based foods having water as the main constituent, which dominates the NIR and MIR absorption spectra. Raman spectroscopy based on inelas-tic light scattering provides spectral information complemen-tary to MIR spectroscopy and eliminates water interferences; however, it is limited by the low signal intensity and interfer-ences from sample fluorescence (Lohumi et al.2015).
Recent studies indicate that fluorescence may be an alter-native to the vibrational spectroscopic techniques in studying the antioxidant abundance and antioxidant capacity in food matrices (Monago-Maraña et al. 2016; Orzel and Daszykowski2014; Orzel et al.2015;Žiak et al.2014). The main advantages of fluorescence as compared to other spec-troscopic techniques are its high sensitivity and selectivity. Due to these features, fluorescence may be especially useful in studies of minor components in complex food matrices and in the presence of interferences (Christensen et al. 2006). Moreover, fluorescence spectra should be easier to interpret. However, this technique is restricted to fluorescent compo-nents. Various emission properties of the food antioxidants may also pose additional limitations. For example, ascorbic acid is not fluorescent and tocopherols are highly fluorescent,
while phenolic compounds have very diverse fluorescence properties (Christensen et al. 2006, Mazina et al. 2015; Wolfbeis et al.1984).
The overall emission of complex, multi-constituent sam-ples is usually characterized by the total fluorescence spectra, called also the excitation–emission matrices (EEMs) (Christensen et al.2006). They are obtained by recording the emission spectra for a series of excitation wavelengths, thus providing comprehensive characteristics of the absorption and fluorescence properties of all the emitting components in the samples studied.
Synchronous fluorescence spectroscopy is another tech-nique used for the complex food samples. Here, fluorescence intensity is measured as a function of the simultaneously scanned emission and excitation wavelengths, usually with a constant offset between them (Δλ = λem− λex). The main advantages of the synchronous fluorescence spectra (SyF) as compared to the EEMs are their improved selectivity and sen-sitivity, significant reduction in the spectral complexity, and suppressed light-scattering interferences (Andrade-Eiroa et al.
2010). With an appropriately selectedΔλ, the SyF spectrum may contain bands of all the fluorescent components of the sample, making the analysis much faster as compared to using the EEM. The main characteristics of the SyF spectra are determined by theΔλ value. The SyF spectra recorded over the range ofΔλ values are known as the total synchronous fluorescence (TSyF) spectra (Patra and Mishra2002).
Both the excitation–emission spectra and the synchronous fluorescence spectra were used in the studies of the antioxi-dant contents and antioxiantioxi-dant capacity of the food samples. EEM fluorescence spectroscopy coupled with multivariate re-gression was used for screening the antioxidant content and antioxidant capacity of coffee, peppermint extracts, and toma-to pastes (Orzel and Daszykowski2014; Orzel et al.2015) and for quantifying quercetin and kaempferol in the paprika sam-ples, with good results obtained for quercetin (Monago-Maraña et al.2016). SyF spectra were used for determination of the phenolic acids and scopoletin in brandies (Žiak et al.
2014).
Apples and apple juices are important dietary sources of phenolics (Biedrzycka and Amarowicz 2008; Candrawinata et al. 2013). The consumption of apples and apple products might be linked to a reduced risk of several forms of cancer, cardiovascular disease, and asthma (Hyson2011). Apple phe-nolics include hydroxybenzoic and hydroxycinnamic acids and their derivatives, flavonols, dihydrochalcones, anthocya-nins, and monomeric and oligomeric flavanols (procyanidins) (Kalinowska et al.2014). Flavonoids are especially important antioxidants, acting as reducing agents, hydrogen donors, sin-glet oxygen quenchers, and metal chelating agents (Ignat et al.
2011).
NIR spectroscopy combined with multivariate regression was used to predict the antioxidant capacity and the
polyphenolic content of apples (Giovanelli et al.2014; Pissard et al.2013; Schmutzler and Huck2014; Schmutzler and Huck
2016).
The contribution of the polyphenolic compounds to the autofluorescence of apple juices was reported in studies of different aspects of the apple juice quality (Poryvkina et al.
2014; Seiden et al.1996).
Recently, we reported a quantitative relationship between the EEMs of the apple juices and their phenolic contents and antioxidant capacity (Włodarska et al.2016).
The aim of the present study is to investigate the feasibility of synchronous fluorescence coupled with chemometrics for screening the total phenolic content (TPC), total flavonoid content (TFC), and total antioxidant capacity (TAC) in com-mercial apple juices.
Materials and Methods
Apple Juices
Thirty commercial apple juices were evaluated in this study. The samples were available from a previous study and were labeled in the same way as in our previous publication (Włodarska et al.2016). The capital letter denotes the sample group, the number denotes the producer, and the lowercase letters distinguish the different production batches. The stud-ied samples include the juices reconstituted from concentrate, clear (group A—11 samples: A1a, A1b, A2, A3a, A3b, A4a, A4b, A5a, A5b, A6a, A6b) and cloudy (group B—2 samples: B1 and B2), and not from concentrate, including pasteurized naturally cloudy juices (group C—13 samples: C1a, C1b, C2a, C2b, C3a, C3b, C4a, C4b, C5a, C5b, C6a, C6b, and C7) and freshly squeezed juices (group D—4 samples: D1a, D1b, D2a, and D2b).
Determination of Chemical Parameters
The data on the TPC and the TAC of the studied juices were available from the previous study (Włodarska et al. 2016). Briefly, the TPC was determined according to Singleton and Rossi (1965) with modification for using 48-well microplates and expressed in milligrams of gallic acid equivalents per liter of juice (mg GAE/L).
The TAC of juices was determined by the Trolox equiva-lent antioxidant capacity (TEAC) assay according to Re et al. (1999), as described in detail in Gliszczyńska-Świgło et al. (2006). The TEAC value was expressed in millimoles of Trolox per liter of juice (mM).
Total flavonoid content (TFC). The amount of flavonoids in the juices was determined according to Karadeniz et al. (2005) with modification for using 48-well microplates. First, 0.10 mL of the juice sample was mixed with 0.50 mL of
deionized water and 0.03 mL of 5% sodium nitrite (Sigma-Aldrich, Steinheim, Germany). After 5 min at room tempera-ture, 0.06 mL of 10% aluminum chloride (Sigma-Aldrich, Steinheim, Germany) was added, and after 5 min, 0.20 mL of 1 M sodium hydroxide (Sigma-Aldrich, Steinheim, Germany) was also added. Deionized water was used to adjust the total volume to 1 mL. The absorbance of the samples was measured at 510 nm using an Epoch™ microplate spectropho-tometer (BioTek). The TFC was reported as milligrams of catechin (Sigma-Aldrich, Steinheim, Germany) equivalents per liter of juice (mg CE/L). These analyses were all made in triplicate.
Fluorescence Measurements
The fluorescence spectra were measured using a Fluorolog-3-11 spectrofluorometer (SPEX-Jobin Yvon, France). TSyF was obtained by measuring the SyF spectra in the 240–700 nm excitation range with the emission–excitation offsets (Δλ) in the 10–160 nm range, with a 10 nm step. The individual SyF spectra were plotted as a function of the excitation wavelength.
The excitation and emission slit widths were 3 nm. The acquisition interval and the integration time were maintained at 1 nm and 0.1 s, respectively. A reference photodiode detec-tor at the excitation monochromadetec-tor stage compensated for the source intensity fluctuations. The individual spectra were corrected for the wavelength-dependent response of the system.
Front-face geometry was used for the undiluted samples in a 10-mm fused-silica cuvette. The samples of clear juices were measured directly, without any preparation; the samples of cloudy juices were measured after centrifugation (15,000 rpm for 5 min).
Data Analysis
Pearson correlation coefficients were calculated to test for the correlations between the individual analytical parameters (Bower2009).
Principal component analysis (PCA) was performed on the X matrix that contains TSyF spectral data held in an unfolded array (Wold et al.1987).
Regression analysis. Partial least squares (PLS) regression was used to establish the calibration models between the fluo-rescence data (X matrix) and the chemical parameters (Y).
The PLS method models both the X- and Y-matrices simul-taneously, to find such latent variables in X that will best predict the latent variables in Y (Wold et al.2001). Two PLS versions were used, PLS1 and PLS2. A PLS1 model enables to predict one Y variable at a time, while a PLS2 model allows prediction of a number of Y variables simultaneously (Wold et al.2001).
PLS was used to model the relation between the chemical data and two types of spectral data: unfolded array of the entire TSyF spectra and individual SyF spectra recorded at particular Δλ offsets.
The X data containing the entire TSyF were arranged for the analysis of the unfolded array into the matrix of 30 × 7376 elements (number of samples × number ofΔλ offsets × num-ber of excitation wavelengths). The X matrix for the analysis of the individual SyF spectra consisted of 30 × 461 elements (number of samples × number of excitation wavelengths). Thus, 16 individual models were developed for each of the chemical parameters using SyF spectra recorded at particular Δλ offsets in the range from 10 to 160 nm, with 10 nm increments.
PLS1 and PLS2 methods were used for the analysis of each of the spectral data arrangements. Individual models for each of the analytical parameters were evaluated using the PLS1 method; the Y matrix consisted of 30 × 1 elements (number of samples × analytical parameter). The PLS2 method modeled all of the three analytical parameters simultaneously; the Y matrix consisted of 30 × 3 elements (number of samples × analytical parameters). The data pre-treatment included mean centering.
Full leave-one-out cross-validation was applied to all of the regression models. The regression models were evaluated using the R2determination coefficient and the root mean square error of cross-validation (RMSECV). The optimal number of components was chosen as the minimum of the plot of the RMSECV in function of the number of compo-nents. The residual predictive deviation (RPD) was calculated as the ratio of the standard deviation of the response variables to the RMSECV (Nicolaï et al.2007).
The data analysis was carried out using the Solo v. 5.0.1 software (Eigenvector Research Inc., USA).
Results and Discussion
Synchronous Fluorescence Spectra of the Apple Juices
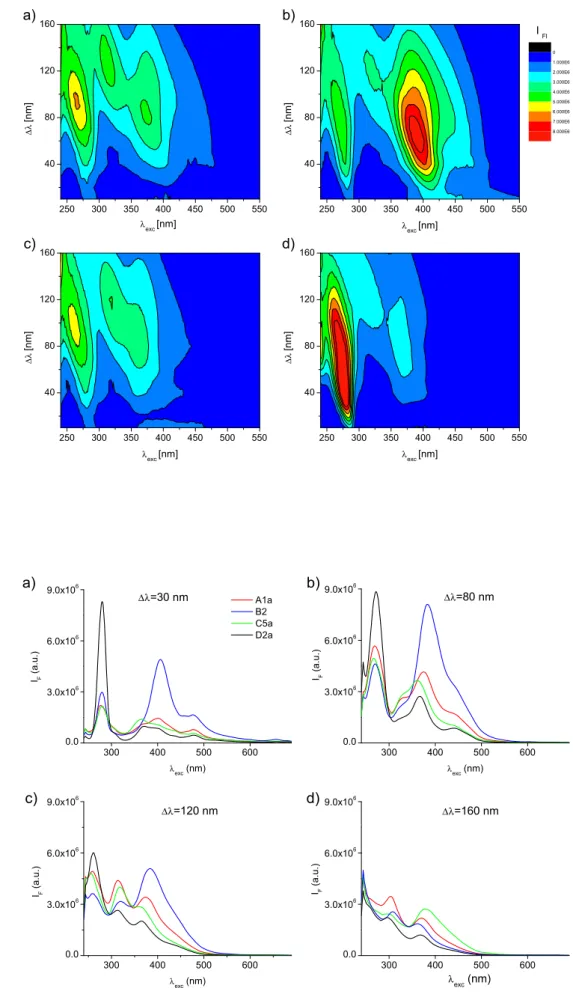
Thirty apple juices studied were selected to cover the various ranges of juices available on the market: clear reconstituted from concentrate (group A), cloudy produced from concen-trate with added apple pulp (group B), pasteurized naturally cloudy produced not from concentrate (group C), and freshly squeezed juices (group D). Figure1shows the TSyF of four apple juices that represent each of the categories studied.
Figure1 illustrates the overall characteristics of the syn-chronous fluorescence spectra over the 10- to 160-nm range of the emission–excitation wavelength offsets (Δλ). The de-pendence of the SyF spectra onΔλ is quite clear. Three dis-tinct emission zones were observed, with varied exact posi-tions of the maxima and intensities in the spectra of different
juices. The spectral maxima of these three zones appeared within the following Δλ/excitation wavelength ranges: 40– 100/260–280, 110–140/305–320, and 60–100/360–420 nm. This result corresponds to the presence of three groups of fluorophores with similar emission properties, observed in the excitation–emission matrices of the apple juices in our previous study (Włodarska et al.2016).
One of the most important advantages of the synchronous fluorescence is an enhanced separation of the overlapping bands as compared to the conventional emission spectra (Andrade-Eiroa et al. 2010; Patra and Mishra 2002). This feature is expected for the spectra recorded at lower Δλ values. In such conditions, the overlap zone of the absorption and emission is narrower, and the resulting spectra of the individual fluorophores are also narrower as compared to the conventionally recorded emission spectra (Patra and Mishra
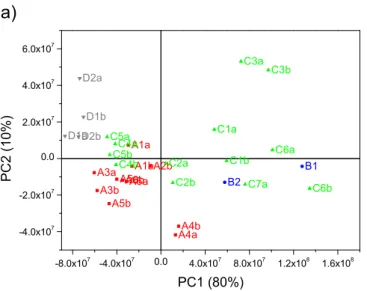
2002). Therefore, the synchronous fluorescence spectra mea-sured at selectedΔλ values are shown in Fig.2for a detailed analysis.
Several bands appeared in the spectra recorded at Δλ = 30 nm, with different intensity, and the respective maxima at about 275–280 nm, 300–310 nm (low intensi-ty), 365–370 nm, 440–460 nm (low intensiintensi-ty), 475– 485 nm, and 655–660 nm (low intensity). This observation shows that the emission of the apple juices is in fact quite complex, with more than the initially identified three groups of fluorophores present in the samples studied. Both the intensity and the spectral width increased with increasingΔλ, with the maxima shifting to shorter wave-lengths. These changes lead to an increase in the spectral overlapping observed at higher Δλ. The intensity of the individual emission bands first reached maximum at a par-ticularΔλ value, decreasing again with the further increase of the offset value. It should be noted that the different fluorophores achieve their maximum intensity at different Δλ values; therefore, the relative intensities of the partic-ular bands in the SyF spectra also varied withΔλ.
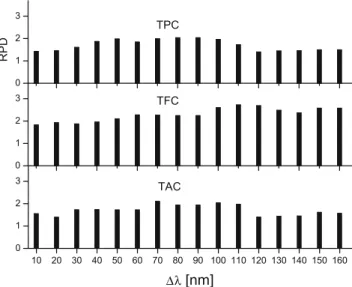
PCA analysis was performed on the unfolded TSyF spectra of all of the studied juices for a comparison of the fluorescence patterns of the entire sample set (Fig.3).
The juices from the different groups were to some extent discriminated by their PC1 and PC2 components, explaining respectively 80 and 10% of the spectral variation. PC1, which represents the main direction of the spectral variability, is neg-atively correlated with the emission below 300 nm and posi-tively with the emission in the 350–450-nm range. The juices of the C group showed the most diverse fluorescence, spread-ing widely along both PC1 and PC2 axes.
The native apple juice fluorescence may originate from several chemical components. The phenolics present in the apple juices include chlorogenic acid, caffeic acid, p-coumaric acid, ferulic acid, catechin, epicatechin, procyanidines (B1, B2, C1 trimer), rutin, phloridzin,
250 300 350 400 450 500 550 40 80 120 160 a) λexc [nm] Δλ [nm ] 250 300 350 400 450 500 550 40 80 120 160 I Fl b) λexc [nm] Δλ [nm ] 0 1.000E6 2.000E6 3.000E6 4.000E6 5.000E6 6.000E6 7.000E6 8.000E6 250 300 350 400 450 500 550 40 80 120 160 c) λexc [nm] Δλ [nm] 250 300 350 400 450 500 550 40 80 120 160 d) λexc [nm] Δλ [nm]
Fig. 1. Total synchronous fluorescence (TSyF) spectra of the apple juices: a clear from concentrate (sample A1a; TPC = 198.4 mg GAE/L, TFC = 52.7 mg CE/L,
TAC = 1.06 mM), b cloudy from concentrate (sample B2; TPC = 386.5 mg GAE/L, TFC = 153.4 mg CE/L, TAC = 4.43 mM), c cloudy not from concentrate (sample C5a; TPC = 174.2 mg GAE/L, TFC = 54.7 mg CE/L, TAC = 1.36 mM), and d freshly squeezed (sample D2a; TPC = 391.2 mg GAE/L, TFC = 42.2 mg CE/L, TAC = 3.05 mM) 300 400 500 600 0.0 3.0x10⁶ 6.0x10⁶ 9.0x10⁶ IF (a .u .) λexc (nm) A1a B2 C5a D2a Δλ=30 nm a) 300 400 500 600 0.0 3.0x10⁶ 6.0x10⁶ 9.0x10⁶ b) Δλ=80 nm IF ( a .u .) λexc (nm) 300 400 500 600 0.0 3.0x10⁶ 6.0x10⁶ 9.0x10⁶ c) Δλ=120 nm IF (a. u .) λexc (nm) 300 400 500 600 0.0 3.0x10⁶ 6.0x10⁶ 9.0x10⁶ d) Δλ=160 nm IF (a. u .) λexc (nm) Fig. 2. Synchronous
fluorescence (SyF) spectra of the apple juices recorded at different Δλ offsets: a 30 nm, b 80 nm, c 120 nm, and d 160 nm. Samples: clear from concentrate (sample A1a), cloudy from concentrate (sample B2), cloudy not from concentrate (sample C5a), and freshly squeezed (sample D2a)
quercetin, isoquercitrin, and hyperin (Gliszczyńska-Świgło and Tyrakowska2003; Kahle et al.2005).
Chlorogenic acid, the main phenolic component of the ap-ple juices, has a single maximum at approximately 337 nm in SyF recorded atΔλ = 110 nm in methanolic solution (Morales et al.2005). The emission was observed in the following ranges ofΔλ/excitation wavelength values in the TSyF spec-tra of the phenolic standards recorded in methanol: 90–110/ 355–365 nm for chlorogenic acid, 80–95/365–375 nm for caffeic acid, 60–95/355–365 nm for ferulic acid, and 50–95/ 410–435 nm for kaempferol (Sergiel et al.2014). The SyF spectra of catechin and epicatechin, to our best knowledge, have not been reported previously. Based on excitation and emission properties of these compounds, they should rather contribute to the short-wavelength emission in the SyF spectra (Airado-Rodríguez et al.2011).
Other compounds beside phenolics may also contribute to the apple juice fluorescence. The fluorescence of prod-ucts of the non-enzymatic browning of the apple juice is well documented in literature (Cohen et al. 1998; Zhu et al.2009). The presence of other fluorescent compounds including aromatic amino acids (tyrosine and phenylala-nine) and water-soluble vitamins B2 and B6 was also re-ported in apples (Christensen et al.2006; Feliciano et al.
2010; Wu et al. 2007). Based on the published data, the emission of vitamins B2and B6and of the products of the non-enzymatic browning should be expected rather in the intermediate range, while the aromatic amino acids should emit in the short-wavelength range (Airado-Rodríguez et al. 2011; Christensen et al. 2006). The longer-wavelength band with a very low intensity with the max-imum at 655 nm corresponds to chlorophyll (Christensen et al.2006).
It should be noted that the fluorescence is sensitive to the micro-environment, solvent polarity, and pH values; therefore, the spectra of the standard solutions may differ from the emis-sion of the same component recorded in the food matrix (Christensen et al.2006).
Multivariate Calibration Models
Chemical Characteristics of the Calibration Set All of the samples (n = 30) were used in the analysis, with the chemical characteristics of the calibration set shown in Table 1. The mean values and standard deviations of the TPC, TFC, and TAC of the studied samples are also listed in Table1.
The present results confirmed variability of the antioxidant properties of apple juices studied (Włodarska et al.2016). The TFC determined by the spectrophotometric method was in the range of 42.23–298.7 mg CE/L, with the mean value and standard deviation of 134 ± 69. It is well known that the contents and profiles of the phenolic compounds in apple juices vary depending on the raw material and processing conditions (Candrawinata et al. 2013; Kalinowska et al.
2014; Markowski et al.2015; Oszmiański et al.2009). Significant positive correlations were observed between the three studied analytical parameters: TPC and TAC (r = 0.944) (Włodarska et al. 2016), TFC and TAC (r = 0.679), and TPC and TFC (r = 0.741). These results confirm that the antioxidant properties of the apple juices are determined by their phenolic contents, in agreement with the published data (Gardner et al.2000; Gliszczyńska-Świgło and Tyrakowska 2003). In some of the apple juices studied, the producers declared added vitamin C, which may also contrib-ute to the antioxidant properties (Włodarska et al.2016).
-8.0x10⁷ -4.0x10⁷ 0.0 4.0x10⁷ 8.0x10⁷ 1.2x10⁸ 1.6x10⁸ -4.0x10⁷ -2.0x10⁷ 0.0 2.0x10⁷ 4.0x10⁷ 6.0x10⁷ A1a A1bA2b A3a A3b A4aA4b A5a A5b A6a A6b B1 B2 C1a C1b C2a C2b C3a C3b C4a C4b C5a C5b C6a C6b C7a D1a D1b D2a D2b
a)
PC 2 ( 10% ) PC1 (80%) 0.0060 0.0060 -1.0E-3 0.013 0.020 0.013 0.027 0.034 0.041 -0.0080 0.048 250 300 350 400 450 500 550 40 80 120 160b)
Δλ [n m] λexc [nm]Fig. 3. The principal component analysis of the unfolded total synchronous fluorescence (TSyF) spectra of all the apple juices studied: a score plot, b loading plot for PC1. Four groups of samples: A (red)—
clear from concentrate, B (blue)—cloudy from concentrate, C (green)— cloudy not from concentrate, D (gray)—freshly squeezed. (Color figure online)
Regression Analysis Multivariate regression was used in or-der to model the relationship between the fluorescence and the analytical characteristics (TPC, TFC, and TAC). The regres-sion using PLS was performed for the analysis of the unfolded TSyF and single-offset SyF spectra. Two versions of the re-gression method were used: PLS1 that models each of the analytical parameters individually and PLS2 that analyzes all of the parameters simultaneously. The pre-processing methods tested (smoothing and first derivative) provided no pronounced improvement in the regression results. Mean-centered spectra were used in the regression analysis.
Table1presents the results of the multivariate calibrations. All of the calibration models confirm the quantitative relation-ship between the SyF spectra and the analytical parameters studied. The best models were obtained for the prediction of TFC using almost all of the regression methods. The models for TPC and TAC had generally higher prediction errors and lower R2and RPD values, as compared to the models for TFC. Some improvements in the model performance were ob-served for the analysis of the single-offset SyF as compared to the unfolded TSyF. The characteristics of the PLS1 models were in most cases similar to those of the respective PLS2 models.
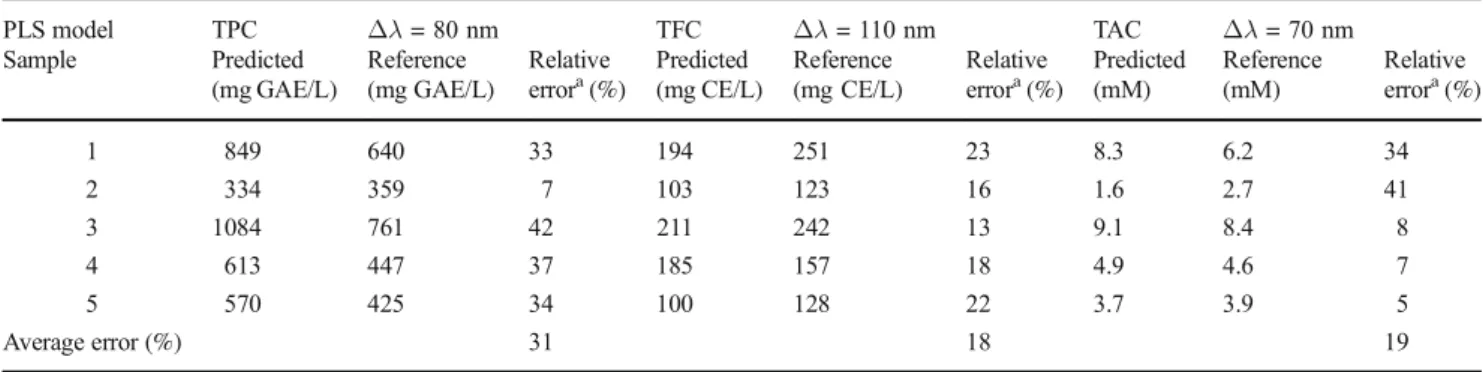
When the regression analysis was applied to the single-offset SyF spectra, the model performance varied in function of theΔλ value at which the particular spectra were recorded (Fig.4).
The best models for the TPC were obtained using the SyF spectra recorded atΔλ = 50 and 70–100 nm. The optimal regression model for the TPC was obtained using the SyF
spectrum recorded at Δλ = 80 nm, characterized by RPD = 2.0 that corresponds to an approximate prediction abil-ity (Nicolaï et al.2007).
The regression models for the TFC had generally better performance as compared to those for the other two parame-ters, TPC and TAC. The spectral analysis at Δλ = 100– 160 nm, with the exception of 140 nm, gave models with better parameters (RPD = 2.5–2.6). The model with the best predictive ability for the TFC (RPD = 2.7) was obtained for the SyF spectrum atΔλ = 110 nm.
Table 1 Characteristics of the regression models for the prediction of the total phenolic (TPC) and flavonoid (TFC) contents and the antioxidant activity (TAC) of the apple juices (n = 30 samples) using
synchronous fluorescence spectra
PLS model PLS calibration PLS cross-validation
LV R2 RMSEC R2 RMSECV RPD TPC; (552 ± 403) mg GAE/L TSyF unfolded PLS 1 9 0.970 68.9 0.740 208.7 1.9 TSyF unfolded PLS 2 9 0.969 69.2 0.744 207.2 1.9 SyF PLS 1Δλ = 80 nm 11 0.968 70.7 0.766 198.0 2.0 SyF PLS 2Δλ = 80 nm 11 0.968 70.8 0.766 198.0 2.0 TFC; (134 ± 69) mg CE/L TSyF unfolded PLS 1 3 0.901 21.4 0.846 27.6 2.5 TSyF unfolded PLS 2 9 0.921 19.1 0.824 29.5 2.3 SyF PLS 1Δλ = 110 nm 2 0.888 22.8 0.870 25.3 2.7 SyF PLS 2Δλ = 110 nm 2 0.873 24.2 0.857 26.6 2.6 TAC; (4.6 ± 3.8) mM TSyF unfolded PLS 1 9 0.962 0.73 0.708 2.11 1.8 TSyF unfolded PLS 2 9 0.929 1.01 0.765 1.89 2.0 SyF PLS 1Δλ = 70 nm 11 0.976 0.59 0.787 1.80 2.1 SyF PLS 2Δλ = 70 nm 10 0.926 1.03 0.709 2.11 1.8 LV number of latent variables used for PLS, R2determination coefficient, RMSECV root mean square errors of calibration and cross-validation in original units (mg GAE/L for TPC, mg CE/L for TFC, mM for TAC), RPD residual predictive deviation
0 1 2 3 0 1 2 3 10 20 30 40 50 60 70 80 90 100 110 120 130 140 150 160 0 1 2 3 TFC TPC RP D TAC Δλ [nm]
Fig. 4. Dependence of the relative predictive deviation (RPD) on theΔλ offset for the PLS1 calibration models for the prediction of the total flavonoid content (TFC), the total phenolic content (TPC), and the total antioxidant capacity (TAC)
The regression models for TAC using the SyF spectra at Δλ = 70–110 nm had better performance. The best model was obtained for the spectra atΔλ = 70 nm (RPD = 2.1).
The regression models for the TPC and TAC include higher numbers of latent variables as compared to the models for TFC, in line with the better performance of the latter. It seems that the better performance of the TFC calibration models confirms the meaningful contribution of the flavonoids to the apple juice fluorescence.
The presently reported models based on the SyF spectra have only slightly lower performance as compared to those based on EEM. The respective parameters of the models ob-tained using EEM were R2CV= 0.802, RPD = 2.3 for the TPC, and R2CV= 0.808, RPD = 2.3 for the TAC (Włodarska et al. 2016).
The predictive ability of the models based both on the SyF and EEM, as judged by the RPD criterion, corresponds to the approximate quantitative prediction accuracy (Nicolaï et al.
2007). However, the important advantages of the SyF spectra over the EEM are the much faster measurements and the sim-pler data analysis. Therefore, it could be more favorable to use synchronous fluorescence in the screening analysis.
Prediction of the New Samples To test the model perfor-mance for prediction of the unknown samples, five new apple juices were used from the same producers but different pro-duction batches (Table2).
The optimal calibration model for each of the parameters was used to predict TPC, TFC, and TAC. The best results were obtained for the prediction of TFC, with the average relative error of 18%. The relative error was equal to 19% for TAC; in contrast, TPC was predicted with a considerably higher aver-age error of 31%. However, the relative errors for TPC and TAC prediction based on individual samples showed relative-ly wide ranges (Table 2), indicating lower stability and confirming the generally lower performance of the models for the prediction of these two parameters.
Taking into account both the results of the cross-validation and prediction of the new samples, we conclude that the models are quite appropriate only for the semi-quantitative and screening analysis. The model for the prediction of TFC had good predictive ability, while those for TPC and TAC have approximate predictive ability.
To the best of our knowledge, there are no reports on the prediction of antioxidant properties in apple juices using other spectroscopic techniques. Very variable RPD values were re-ported for the determination of TPC in the analysis of intact apples using NIR spectroscopy: 5.1 (Pissard et al. 2013), 1.25–1.87 (Schmutzler and Huck2014), and 3.6 (Giovanelli et al.2014). The RPD values of 2.8 (Schmutzler and Huck
2016) and 3.0 (Giovanelli et al.2014) were reported for the prediction of TAC using the same method.
The observed inferior performance of the models based on fluorescence for precise quantitative analysis may have sever-al explanations, as we discussed recently (Włodarska et sever-al.
2016). Firstly, different compounds, both fluorescent and non-fluorescent, may contribute to the antioxidant activity of juices. Although the main phenolic compound present in ap-ple juices is the fluorescent chlorogenic acid, a wide range of other phenolic compounds (Gliszczyńska-Świgło and Tyrakowska2003; Kahle et al.2005) with very diverse fluo-rescence properties (Mazina et al.2015; Wolfbeis et al.1984) was reported in these products. The overall fluorescence of a juice depends not only on the concentrations of the individual fluorescent components but also on their fluorescence quan-tum yields (Christensen et al.2006). Moreover, the fluores-cence may be affected by the sample matrix properties.
The Folin–Ciocalteu assay used for the determination of TPC has a limited specificity; thus, non-phenolic compounds may also contribute to the result (Craft et al.2012). In partic-ular, the presence of vitamin C may affect the TPC assay. The addition of vitamin C to some of the juices studied was de-clared by the respective producers (Włodarska et al.2016). Similarly, the method used for TAC determination is sensitive for a range of fluorescent and non-fluorescent compounds
Table 2 Prediction results of the total phenolic content (TPC), total flavonoid content (TFC), and total antioxidant capacity (TAC) in unknown samples, using the optimal regression models for each of the parameters
PLS model TPC Δλ = 80 nm TFC Δλ = 110 nm TAC Δλ = 70 nm Sample Predicted (mg GAE/L) Reference (mg GAE/L) Relative errora(%) Predicted (mg CE/L) Reference (mg CE/L) Relative errora(%) Predicted (mM) Reference (mM) Relative errora(%) 1 849 640 33 194 251 23 8.3 6.2 34 2 334 359 7 103 123 16 1.6 2.7 41 3 1084 761 42 211 242 13 9.1 8.4 8 4 613 447 37 185 157 18 4.9 4.6 7 5 570 425 34 100 128 22 3.7 3.9 5 Average error (%) 31 18 19 a
with antioxidant properties. Interestingly, better results were obtained for modeling TFC as compared to TPC and TAC. This may indicate that fluorescence may be better suited for the analysis of a selected group of compounds or even of individual fluorescent antioxidants instead of the TPC or TAC determination; however, this hypothesis needs further testing.
Conclusions
The apple juices showed some characteristic fluorescence pat-terns common to all of the studied samples, although the spec-tra of the individual juices had very diverse characteristics. Synchronous fluorescence spectroscopy revealed several ad-ditional bands originating from different fluorophores, as compared to EEM, due to the reduced spectral overlapping in SyF.
The antioxidant properties of the apple juices could be modeled using their SyF spectra. The regression models based on single-offset SyF spectra showed better performance than those based on the entire TSyF spectra. The dependence of the SyF on theΔλ offset should be considered in order to opti-mize the analytic parameters. The spectra recorded at lower Δλ provide better resolution for the qualitative analysis. However, the optimal regression models were obtained at higherΔλ values (Δλ = 70–110 nm).
We have to underline that the models obtained were only appropriate for the semi-quantitative analysis. The model for TFC had the best performance. The predictive ability of the PLS models based on SyF and EEM was similar. Therefore, the single-offset SyF is preferable for the screening analysis, instead of the entire EEM. This may significantly shorten the recording time and simplify the analysis, due to the reduced amount of spectral data.
In summary, we conclude that modeling of antioxidant properties based on fluorescence is quite a complex task; therefore, further studies are needed to evaluate the feasibility of this method for precise quantitative analysis.
Acknowledgments We thank Prof. Anna Gliszczyńska-Świgło for the protocols for determining the analytical parameters according to the ref-erence methods.
Compliance with Ethical Standards
Conflict of Interest Katarzyna Włodarska declares that she has no conflict of interest. Katarzyna Pawlak-Lemańska declares that she has no conflict of interest. Igor Khmelinskii declares that he has no conflict of interest. Ewa Sikorska declares that she has no conflicts of interest.
Ethical Approval This article does not contain any studies with human participants or animals performed by any of the authors.
Informed Consent Not applicable.
Open Access This article is distributed under the terms of the Creative C o m m o n s A t t r i b u t i o n 4 . 0 I n t e r n a t i o n a l L i c e n s e ( h t t p : / / creativecommons.org/licenses/by/4.0/), which permits unrestricted use, distribution, and reproduction in any medium, provided you give appro-priate credit to the original author(s) and the source, provide a link to the Creative Commons license, and indicate if changes were made.
References
Airado-Rodríguez D, Durán-Merás I, Galeano-Díaz T, Wold JP (2011) Front-face fluorescence spectroscopy: a new tool for control in the wine industry. J Food Compos Anal 24:257–264
Andrade-Eiroa Á, de-Armas G, Estela J-M, Cerdà V (2010) Critical ap-proach to synchronous spectrofluorimetry. I. TrAC Trends Anal Chem 29:885–901
Armenta S, Garrigues S, de la Guardia M (2008) Green analytical chem-istry. TrAC-Trend Anal Chem 27:497–511
Biedrzycka E, Amarowicz R (2008) Diet and health: apple polyphenols as antioxidants. Food Rev Int 24:235–251
Bower JA (2009) Association, correlation and regression. In statistical methods for food science. Wiley, Chichester, pp. 137–149 Candrawinata VI, Golding JB, Roach PD, Stathopoulos CE (2013) From
apple to juice—the fate of polyphenolic compounds. Food Rev Int 29:276–293
Christensen J, Nørgaard L, Bro R, Engelsen SB (2006) Multivariate au-tofluorescence of intact food systems. Chem Rev 106:1979–1994 Cohen E, Birk Y, Mannheim CH, Saguy IS (1998) A rapid method to
monitor quality of apple juice during thermal processing. LWT-Food Sci Technol 31:612–616
Corradini E, Foglia P, Giansanti P, Gubbiotti R, Samperi R, Laganà A (2011) Flavonoids: chemical properties and analytical methodolo-gies of identification and quantitation in foods and plants. Nat Prod Res 25:469–495
Cozzolino D (2015) Infrared spectroscopy as a versatile analytical tool for the quantitative determination of antioxidants in agricultural prod-ucts, foods and plants. Antioxidants 4:482
Craft BD, Kerrihard AL, Amarowicz R, Pegg RB (2012) Phenol-based antioxidants and the in vitro methods used for their assessment. Compr Rev Food Sci F 11:148–173
Feliciano RP, Antunes C, Ramos A, Serra A. T, Figueira ME, Duarte CMM., de Carvalho A, Bronze MR (2010) Characterization of tra-ditional and exotic apple varieties from Portugal. Part 1 —nutrition-al, phytochemical and sensory evaluation. J Funct Foods 2:35–45 Gardner PT, White TAC, McPhail DB, Duthie GG (2000) The relative
contributions of vitamin C, carotenoids and phenolics to the antiox-idant potential of fruit juices. Food Chem 68:471–474
Giovanelli G, Sinelli N, Beghi R, Guidetti R, Casiraghi E (2014) NIR spectroscopy for the optimization of postharvest apple management. Postharvest Biol Tec 87:13–20
Gliszczyńska-Świgło A, Tyrakowska B (2003) Quality of commercial apple juices evaluated on the basis of the polyphenol content and the TEAC antioxidant activity. J Food Sci 68:1844–1849 Gliszczyńska-Świgło A, Ciska E, Pawlak-Lemańska K, Chmielewski J,
Borkowski T, Tyrakowska B (2006) Changes in the content of health-promoting compounds and antioxidant activity of broccoli after domestic processing. Food Addit Contam 23:1088–1098 Hyson DA (2011) A comprehensive review of apples and apple
compo-nents and their relationship to human health. Adv Nutr 2:408–420 Ignat I, Volf I, Popa VI (2011) A critical review of methods for
charac-terisation of polyphenolic compounds in fruits and vegetables. Food Chem 126:1821–1835
Kahle K, Kraus M, Richling E (2005) Polyphenol profiles of apple juices. Mol Nut Food Res 49:797–806
Kalinowska M, Bielawska A, Lewandowska-Siwkiewicz H, Priebe W, Lewandowski W (2014) Apples: content of phenolic compounds vs.
variety, part of apple and cultivation model, extraction of phenolic compounds, biological properties. Plant Physiol Bioch 84:169–188 Karadeniz F, Burdurlu HS, Koca N, Soyer Y (2005) Antioxidant activity of selected fruits and vegetables grown in Turkey. Turk J Agric For 29:297–303
Lohumi S, Lee S, Lee H, Cho B-K (2015) A review of vibrational spec-troscopic techniques for the detection of food authenticity and adul-teration. Trends Food Sci Tech 46:85–98
Lu X, Rasco BA (2011) Determination of antioxidant content and anti-oxidant activity in foods using infrared spectroscopy and chemometrics: a review. Crit Rev Food Sci 52:853–875
Markowski J, Baron A, Le Quere J-M, Płocharski W (2015) Composition of clear and cloudy juices from French and Polish apples in relation to processing technology. LWT-Food Sci Technol 62:813–820 Mazina J, Vaher M, Kuhtinskaja M, Poryvkina L, Kaljurand M (2015)
Fluorescence, electrophoretic and chromatographic fingerprints of herbal medicines and their comparative chemometric analysis. Talanta 139:233–246
Monago-Maraña O, Durán-Merás I, Galeano-Díaz T, Peña AM (2016) Fluorescence properties of flavonoid compounds. Quantification in paprika samples using spectrofluorimetry coupled to second order chemometric tools. Food Chem 196:1058–1065
Morales F, Cartelat A, Álvarez-Fernández A, Moya I, Cerovic ZG (2005) Time-resolved spectral studies of blue-green fluorescence of arti-choke (Cynara cardunculus L. Var. Scolymus) leaves: identification of chlorogenic acid as one of the major fluorophores and age-mediated changes. J Agr Food Chem 53:9668–9678
Nicolaï BM, Beullens K, Bobelyn E, Peirs A, Saeys W, Theron KI, Lammertyn J (2007) Nondestructive measurement of fruit and veg-etable quality by means of NIR spectroscopy: a review. Postharvest Biol Tec 46:99–118
Orzel J, Daszykowski M (2014) A rapid validation of the antioxidant capacity of food commodities based on their fluorescence excitation emission spectra as applicable to coffee and peppermint extracts. Chemometr Intell Lab 137:74–81
Orzel J, Stanimirova I, Czarnik-Matusewicz B, Daszykowski M (2015) Prediction of the hydrophilic antioxidant capacity of tomato pastes from the IR and fluorescence excitation–emission spectra of extracts and intact samples. Talanta 138:64–70
Oszmiański J, Wojdylo A, Kolniak J (2009) Effect of enzymatic mash treatment and storage on phenolic composition, antioxidant activity, and turbidity of cloudy apple juice. J Agr Food Chem 57:7078–7085 Patra D, Mishra AK (2002) Recent developments in multi-component synchronous fluorescence scan analysis. TrAC-Trend Anal Chem 21:787–798
Pissard A, Fernández Pierna JA, Baeten V, Sinnaeve G, Lognay G, Mouteau A, Dupont P, Rondia A, Lateur M (2013) Non-destructive measurement of vitamin C, total polyphenol and sugar content in apples using near-infrared spectroscopy. J Sci Food Agr 93:238–244
Poryvkina L, Tsvetkova N, Sobolev I (2014) Evaluation of apple juice quality using spectral fluorescence signatures. Food Chem 152:573– 577
Pyrzynska K, Sentkowska A (2014) Recent developments in the HPLC separation of phenolic food compounds. Crit Rev Anal Chem 45: 41–51
Re R, Pellegrini N, Proteggente A, Pannala A, Yang M, Rice-Evans C (1999) Antioxidant activity applying an improved ABTS radical cation decolorization assay. Free Radical Bio Med 26:1231–1237 Robbins RJ (2003) Phenolic acids in foods: an overview of analytical
methodology. J Agr Food Chem 51:2866–2887
Scalbert A, Manach C, Morand C, Rémésy C, Jiménez L (2005) Dietary polyphenols and the prevention of diseases. Crit Rev Food Sci 45: 287–306
Schmutzler M, Huck CW (2014) Automatic sample rotation for simulta-neous determination of geographical origin and quality characteris-tics of apples based on near infrared spectroscopy (NIRS). Vib Spectrosc 72:97–104
Schmutzler M, Huck CW (2016) Simultaneous detection of total antiox-idant capacity and total soluble solids content by Fourier transform near-infrared (FT-NIR) spectroscopy: a quick and sensitive method for on-site analyses of apples. Food Control 66:27–37
Seiden P, Bro R, Poll L, Munck L (1996) Exploring fluorescence spectra of apple juice and their connection to quality parameters by chemometrics. J Agr Food Chem 44:3202–3205
Sergiel I, Pohl P, Biesaga M, Mironczyk A (2014) Suitability of three-dimensional synchronous fluorescence spectroscopy for fingerprint analysis of honey samples with reference to their phenolic profiles. Food Chem 145:319–326
Singleton VL, Rossi JA (1965) Colorimetry of total phenolics with phosphomolybdic-phosphotungstic acid reagents. Am J Enol Viticult 16:144–158
Włodarska K, Pawlak-Lemańska K, Khmelinskii I, Sikorska E (2016) Explorative study of apple juice fluorescence in relation to antioxi-dant properties. Food Chem 210:593–599
Wold S, Esbensen K, Geladi P (1987) Principal component analysis. Chemometr Intell Lab 2:37–52
Wold S, Sjöström M, Eriksson L (2001) PLS-regression: a basic tool of chemometrics. Chemometr Intell Lab 58:109–130
Wolfbeis OS, Begum M, Geiger H (1984) Fluorescence properties of hydroxy- and methoxyflavones and the effect of shift reagents. Z Naturforsch 39b:231–237
Wu J, Gao H, Zhao L, Liao X, Chen F, Wang Z, Hu X (2007) Chemical compositional characterization of some apple cultivars. Food Chem 103:88–93
Zhu D, Ji B, Eum HL, Zude M (2009) Evaluation of the non-enzymatic browning in thermally processed apple juice by front-face fluores-cence spectroscopy. Food Chem 113:272–279
Žiak Ľ, Sádecká J, Májek P, Hroboňová K (2014) Simultaneous determi-nation of phenolic acids and scopoletin in brandies using synchro-nous fluorescence spectrometry coupled with partial least squares. Food Anal Method 7:563–570