102
CHARACTERIZATION AND GENETIC DIVERSITY BETWEEN GUARANA PROGENIES
Juan Daniel Villacis Fajardo1, André Luiz Atroch2, Carlos Enrique Daniel Lopez Pinto1, Firmino José do Nascimento Filho2
1Federal University of Amazonas. PhD in Tropical Agronomy. E-mail: [email protected];
2Embrapa Amazônia Ocidental. Guarana Genetic Enhancement Researcher. E-mail: [email protected];
ABSTRACT
Guarana [Paullinia cupana var. sorbilis (Mart.) Ducke] is a native plant used by the Amazon inhabitants, especially by the Sateré-maué indigenous tribe in the northern Amazon region. The aim of this study was to estimate the genetic diversity, components of variance for morpho-agronomic traits, and the yield of guarana progenies. Thirty-six half-siblings progenies were evaluated in a randomized block design with two replicates and six plants per plot for the agronomic traits and fruit yield arranged in two rows of three plants, spaced 5 m x 5 m. The mean yield of the best individual was 28,355 g.plant-1.year-1, ten times higher than the Amazon state average yield. The progenies present enough genetic diversity for the selection between and within progenies that with controlled crosses or intercrosses could generate a base population with high yield and sufficient genetic diversity increasing the probability of retrieval of superior genotypes. Progenies 22 and 16 could be intercrossed for producing the base population for breeding purposes.
Keywords: Breeding, genetic divergence, genetic similarity, genetic resources
CARACTERIZAÇÃO E DIVERSIDADE GENÉTICA ENTRE PROGÊNIES DO GUARANÁ
RESUMO
O guaranazeiro [Paullinia cupana var. sorbilis (Mart.) Ducke] é uma planta nativa valorizada pelos povos Amazônicos, especialmente pela tribo Sateré-Maué no norte da região Amazônica. O objetivo do estudo foi estimar a diversidade genética, estimar componentes de variância para caracteres morfoagronômicos, e da produção de progênies de guaranazeiro.
103 Foram avaliadas 36 progênies de meios irmãos em delineamento experimental de blocos ao acaso com duas repetições e seis plantas por parcela para os caracteres agronômicos e produção de frutos dispostas em duas fileiras de três plantas, no espaçamento de 5 m x 5 m. A média da produção do melhor indivíduo foi 28.355 g.planta-1.ano-1, dez vezes maior do que a produtividade média do Estado do Amazonas. As progênies apresentam diversidade genética suficiente para a seleção entre e dentro de progênies que com cruzamentos controlados ou intercruzamentos poderiam gerar uma população base com alta produtividade e diversidade genética suficiente aumentando a probabilidade de obtenção de genótipos superiores. Os indivíduos das progênies 22 e 16 podem ser intercruzados para formar uma população base visando o melhoramento genético.
Palavras-chave: Melhoramento genético, divergência genética, similaridade genética, recursos
genéticos
INTRODUCTION
Guarana [Paullinia cupana var. sorbibilis (Mart.) Ducke] is a native plant valued by the Amazon inhabitants, especially by the Sateré-Maué indigenous tribe from the northern Amazon region between the Madeira and Tapajós Rivers, on the border of the states of Amazonas and Pará, Brazil (ALVAREZ, 2004). Research shows that guarana has stimulating and therapeutic properties, which make it an important input for soft drinks, pharmaceutical, chemical, and cosmetic industries (EMBRAPA, 2011).
In Amazonas, the largest producers of guarana in 2017 were the municipalities of Maués and Urucará, with harvested areas of 2800 and 461 hectares respectively. The state production consisted of 854 tons with a productivity of 197 kg per ha of dry seeds, which is considered low compared with the state of Bahia, the largest Brazilian producer, with a yield of 263 kg per ha (IBGE, 2017).
The main destination of the national production of guarana is the soft drink industry, about 45%. The per capita national consumption of soft drinks is 70 liters per inhabitant per year, and the production is 15 billion liters. The guarana-flavored soft drinks corresponding to 20% of consumption, about 3 billion liters (ABIR, 2016).
Guarana seeds contain more caffeine than any other plant in the world with levels ranging from 2 to 7.5% (BECK, 2005). Guarana contains about four times as much caffeine as coffee. Guarana seeds also contain traces of theobromine and theophylline, other alkaloids in the xanthine group (PIZZA et al., 1999). The evolutionary ‘purpose’ of the xanthines is unclear,
104
but they may help protect the plants from attack by insect pests, herbivores and pathogens. In humans, xanthines stimulate the central nervous system, increase secretion of gastric acid and serve as a bronchodilator and a diuretic. Guarana has long been esteemed for its energetic and curative properties. It is also known for its aphrodisiac properties. Today guarana has become a global energy drink and its importance has grown in the last decade due to its many medicinal and energetic properties (SMITH & ATROCH, 2007).
In guarana, the breeding cycle includes the stages of selection of matrices, progeny tests, competition experiments of clones, and later release of materials for planting on a commercial scale. Due to the long cycle of the culture, from the initial phase to the release of the genetic materials, it can take from 20 to 30 years. Thus, it is of great importance to know the genetic variability of the traits of interest to the breeder, to choose the most appropriate methods in the selection of plants in the young and adult phases (ATROCH et al., 2010).
Descriptors are being used in guarana progenies in this experiment for the first time as means to identify the most divergent materials for future controlled crossing programs.
In this aspect, the use of agro-morphological characterization should consider botanical descriptors of high heritability, easy measurement and little genotype x environment interaction (BENTO et al., 2007). Several multivariate techniques can be used to evaluate the genetic divergence between accessions of germplasm; however, most of these methodologies are indicated for quantitative variables or for binary traits. However, the characterization of guarana germplasm uses multicategoric traits, that is, qualitative descriptors that present several classes, such as the color of the fruit peel and the color of the young leaves. The objective of the study was to evaluate genetic values, estimate variance components for morpho-agronomic traits and yield, and to estimate the genetic diversity among 36 guarana progenies for use in a program of controlled crosses and development of clonal and open pollinated cultivars.
MATERIAL AND METHODS Area of study
The evaluated experiment of the guarana progenies was implemented in March of 2003 in the municipality of Maués located 312 km from the city of Manaus, Amazonas State, Brazil. The EMBRAPA Experimental Station in Maués is situated 85 km south-east of Itacoatiara. It is stablished at 20 meters’ altitude, with the geographical coordinates Latitude: 3° 22' 54'' South, Longitude: 57° 42' 55'' West, comprising the territorial area of the municipality.
The climate of the area is of type Afi, Rainy tropical climate, according to the climatological classification of Köppen. The average temperature for the coldest month is never
105 lower than 18°C, the average annual rainfall is 2700mm. The annual average relative humidity is 83% (INMET, 2018). The monthly rainfall distribution forms two distinct seasons in the year: the dry season, which occurs between June and October, with August as the month with the lowest rainfall; and the rainy season, which occurs between November and May, with March as the month with the highest rainfall index (ARAÚJO et al., 2013; CPTEC, 2014).
Agro-morphological characterization
Twenty agro-morphological descriptors were evaluated, with 19 qualitative and one quantitative descriptors (Table 1).
Genetic-statistical analyses
Thirty-six guarana half-siblings progenies were evaluated in a randomized block design with two blocks and six plants per plot, arranged in two rows of three plants, spaced 5 m x 5 m. The variance analysis was performed following the statistical model:
Yij = m + ti + bj + eij
Where, Yij: is the observed value for the study variable for treatment i in block j; m: is
the mean of all experimental units for the study variable; ti: is the random effect of progeny i
on the observed value Yij; bj: is the fixed effect of block j on the observed value Yij; eij: is the
error associated with observation Yij.
The variable yield of each progeny in g.plant-1.year-1 was based on the mean yield in six years, 2005 to 2010.
Analysis of genetic parameters and variance components
Variance components, genetic parameters and genetic values were estimated using the REML/BLUP procedure through the Computerized Genetic Selection program – SELEGEN-REML/BLUP (RESENDE, 2007a) for the variable yield in g.plant-1.year-1.
106
Table 1. Agro-morphological descriptors of guarana [Paullinia cupana var. sorbilis (Mart.)
Ducke] Manaus, 2016.
Descriptors Identification Code
1 Plant length branches PLCR
short 3
medium 5
long 7
erect 3
2 Plant architecture PLAR semi erect 5
decumbent 7
oval 1
3 Leaf shape FOFM elliptical 2
oblong 3
light green 1
dark green 2
4 Young leaf color FOCJ purplish-green 3
brown 4
purple 5
5 Leaf anthocyanin pigmentation FOPA Absent 1
Present 2
6 Green leaf color FOVF
light 1
medium 2
dark 3
yellowish 4
low 3
7 Intensity of anthocyanin pigmentation FOIP medium 5
high 7
Corrugation of the upper side of the leaf blade surface
low 3
8 FOBL medium 5
high 7
low 3
9 Brightness of leaf blade upper surface FOBS medium 5
high 7
10
Leaf rudiments on rachis FORF
absent 1
present 2
Leaf rudiments on rachis shape
winged 1
11 FOFR margined 2
smooth 3
low 1
12 Fruit density on raceme RADF medium 2
high 3
short 3
13 Raceme length RACO medium 5
long 7
107
Table 1. (cont.) Agro-morphological descriptors of guarana [Paullinia cupana var. sorbilis
(Mart.) Ducke] Manaus, 2016.
Descriptors Identification Code
elliptic 1
14 Fruit shape FRFO obovate 2
globular 3
yellow 1
orange 2
reddish yellow 3
15 Fruit color FRCO yellowish red 4
orange red 5
red 6
reddish yellow 7
16 Fruit pericarp surface FRSP smooth 1
rough 2
small 3
17 Fruit size FRTM medium 5
large 7
low 3
18 Fruit pericarp brightness intensity FRIN medium 5
high 7
early 3
19 Fruit ripening season EPMF medium 5
late 7
20 Yield PROD Data harvest
(g.plant-1.year-1)
Source: Published on D.O.U., section 1, nº251, 31.12.2010.
Genetic distance analysis
Data from the qualitative descriptors used to calculate the coefficient of similarity were obtained by means of the mode of each descriptor, considering 12 plants per progeny, with the total of 432 evaluated plants. The analysis of the quantitative descriptor yield (g.plant-1.year-1) was based on the production in six years (2005 to 2010). The analysis of genetic distance was performed by the Euclidean distance, due to the data structure, calculated by means of the expression:
108
Where:
dii' = Euclidian distance between progeny i and i’; xij = is the value obtained in progeny i or i’.
For the qualitative variables, the coefficient of similarity was calculated by the expression:
dii’ = CP/(CP+D), where, CP: Agreement of values; D: Disagreement of values.
Analysis of the grouping for the variable yield
The progenies were grouped following the criteria of dissimilarity through the hierarchical method of the arithmetic means of the measures of dissimilarities (UPGMA). The UPGMA method groups the progenies in pairs using arithmetic means of the dissimilarity measures, which avoids characterizing the dissimilarity by extreme values (maximum or minimum) among the genotypes considered. In this method, the dendrogram was established by the genotypes with the highest similarity (CRUZ, 2008).
d
(ij)k = mean (d
ik ;d
jk =d
ik+ d
jk / 2)in which:
d(ij)k = average distance between the group ij and the access k; dik = distance between accesses i and k; and
djk = distance between accesses j and k.
The cut point was based on Mojena (1977), according on formula below: Pc = m + kdp, where:
Pc: cut point;
m: average of genetic distance values on fusion levels corresponding to the stages; k: 1,25 (MILLIGAN & COOPER, 1985)
109
RESULTS AND DISCUSSION
Genetic parameters and the variance components among progenies for the variable yield were registered (Table 2). The low individual heritability between plants (h2a) was equal to 0.33 and is within the expected for the trait in question, corroborating the results obtained by Atroch et al. (2010, 2011). The coefficient of determination of the effects of plots (c2parc) on productivity was of low magnitude, indicating a low environmental variation among plots within the block.
According to Ferrão (2008), the estimation of the coefficient of genetic variance is of extreme importance for the genetic structure of populations, since it expresses the amount of variance between the genetic materials. The value of coefficient of genotypic variation (CVgi%) of 54.92% and the value of coefficient of genetic variation within progenies (CVgp%) of 27.46% indicates that the genetic variation was more high among progenies than that within progenies, then the strategy is perform the selection between progenies. The value of the coefficient of residual variance (CVe%) obtained (40.55%) can be considered low, according to Atroch (2005). This value indicates good experimental precision, which translates into reliability in the presented results. The estimate of the progeny selection accuracy was 0.69 indicating good reliability of the estimates obtained in this study. The coefficient of relative variance (CVr) was 0.68, indicating a situation that is favorable to the selection for production. These values are considered high according Resende (2007b).
The heritability is a parameter of great utility for the breeders, since it allows the breeder to predict the possibility of success of the selection (ANDRADE et al., 2008). The individual heritabilities in the adjusted narrow sense (h2aj) of 0.34 and in the narrow sense (h2a) of 0.33 are considered of medium magnitude for the trait. The heritability estimate at the progeny level (h2mp) of 0.48 was higher than that obtained by Atroch (2013), showing that the strategy of selecting among progenies will be more effective than the selection of individuals within progenies as indicated by additive heritability within progenies (h2ad) of 0.28.
Table 3 shows the results of the variance analysis for the trait production; and the estimates did not detect significant differences among the progenies.
However, the analysis of variance only indicates that there was not enough evidence to prove that the null hypothesis is false (RUMSEY, 2009). Therefore, methods that optimize selection efficiency are used in plant breeding, such as mixed models of restricted maximum likelihood / best linear unbiased prediction (REML / BLUP) (ATROCH et al., 2010).
110
Table 2. Genetic parameters and components of variance for the variable yield obtained in 36
guarana progenies. Manaus, 2016.
Genetic parameters Values
Additive genetic variance (Va) 17,611.494.4
3
Environmental variance between plots (Vparc) 1,623.439.15
Residual variance (Ve) 34,655.060.3
3
Individual phenotypic variance (Vf) 53,889.993.9
1 Individual heritability in the narrow sense (h2a)
0.33 Individual heritability in the narrow sense, adjusted for the effects of plot
(h2aj) 0.34
Coefficient of determination of plot effects (c2parc) 0.03
Heritability of mean progenies (h2mp)
0.48
Accuracy of progeny selection (Acprog) 0.69
Additive heritability within progenies (h2ad) 0.28
Coefficient of genotypic variation (CVgi%) 54.92
Coefficient of genetic variation within progenies (CVgp%) 27.46
Coefficient of residual variance (CVe%) 40.55
Coefficient of relative variation (CVr) 0.68
Grand Mean 7,641.46
Table 3. Summary of the analysis of variance for the variable yield. Manaus, 2016.
F.V. GL F Value
Blocks 1 0.02ns
Progenies 35 1.92ns
Residue 35 –
ns= Non-significant.
Thus, individuals were classified for selection by the predicted additive genetic effect “a” (Table 4). The highest yield was obtained by individual 1-22-1 (28.355 g.plant-1.year-1), with a predicted additive genetic effect of 8.520 g.plant-1.year-1. With the selection of only this individual the average progeny yield would increase from 7,641.46 g.plant-1.year-1 (Table 2) to 16,162.3 g.plant-1.year-1 (Table 4). In addition, with the selection of the best 20 individuals, the mean progeny yield, would increase from 7,641.46 g.plant-1.year-1 (Table 2), to 13,464.60 g.plant-1.year-1 (Table 4). These yields are ten times higher than the state mean yield (1,200
111 g.plant-1.year-1) and they are the same as the best guarana clones recommended by Embrapa Western Amazon.
The selection of the 20 best individuals belonging to 36 progenies to compose the breeding population provided a gain of 58% (from 7,641.46 to 12,133.7 g.plant-1.year-1) above the experiment average. These genetic gains, in relation to the population mean, are very high. Atroch and Nascimento Filho (2001) evaluated the genetic gain obtained in the clonal selection program of guarana and estimated a gain of 0.96%, so the authors recommended the recurrent selection strategy with evaluation of progenies of half siblings, as a way to increase the gains with the selection. These results confirm to a greater gain of the recurrent selection than clonal selection.
Analysis of genetic similarity among progenies pairs, considering 19 qualitative descriptors, is shown in Table 5. Progenies 25 and 31 (0.895) and the pairs of progenies 3;29 and 8;9 (0.842) were the most genetically similar. It is not interesting to use them to generate segregant populations from controlled crosses or by random intercrosses, as due to their genetic similarity for many traits the success of obtaining greater genetic diversity is small.
On the other hand, progenies 6 and 20 (0.211) and 5 and 12 (0.263) would generate the greatest possible genetic diversity as to qualitative traits if they were controlled or randomly crossed. Multivariate techniques are widely used to measure the genetic diversity among genetic materials, as well as to explore the traits that most influence this divergence (OLIVEIRA et al., 2012). Thus, cluster analysis aims at uniting, by a criterion of classification, the parents into several groups, so that there is homogeneity within the group and heterogeneity between groups (CRUZ, 2008).
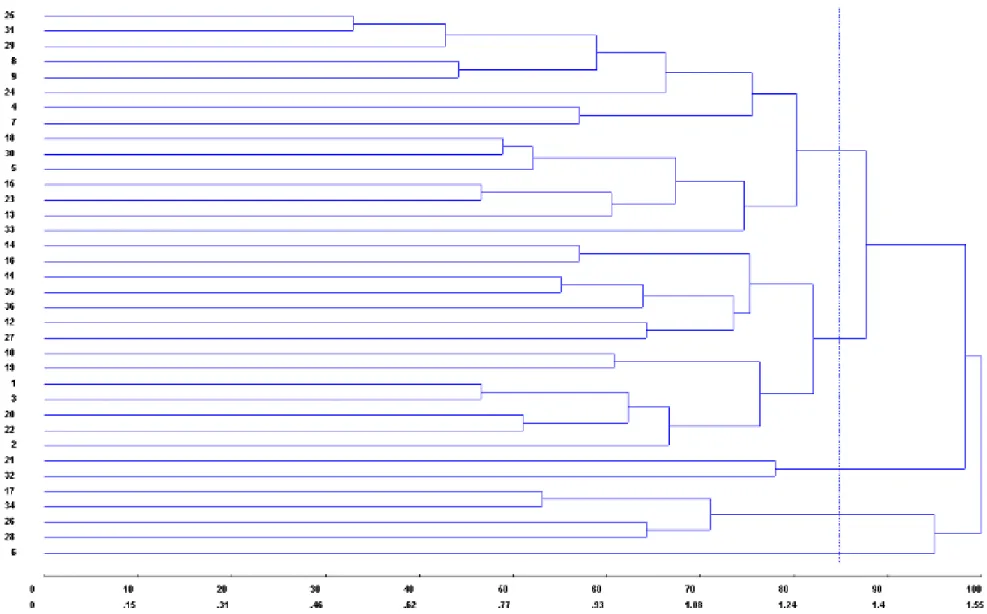
The UPGMA (Unweighted Pair Group Using an Arithmetic Average) grouping method, based on Euclidean distance, for the variable yield (grass/plant) produced the dendrogram shown in Figure 1. The analysis of this type of diagram is usually subjective and can create some difficulties in determining the number of groups formed, as there is no statistical criterion to determine them, a cut-off point (HAHSLER & KARPIENKO, 2016), which it is often difficult to stipulate. On the other hand, easy interpretation and simplicity are important in data analysis (MARDIA et al., 1997).
The cut point estimated was 1.32 (Figure 1). It is observed that it is difficult to directly evaluate the behavior of the coefficients of similarity in the progenies or using statistics as the mean, which in itself already justifies the use of grouping techniques, mainly to verify which progenies are more similar to each other. In the dendrogram of the progenies (Figure 1), the
112
formation of five diversity groups was verified, based on the changes of levels observed in the diagram at the cut-off point.
Table 4. Selection of the 20 best individuals within the 36 progenies of guarana regarding yield
(g.plant-1.year-1). Manaus, 2016.
Order Block Progenies Plants f a u+a Gain Mean Ne D g
1 1 22 1 28355 8520.8 16162.3 8520.8 16162.3 1.00 2958.7 11479.5 2 2 22 1 26955 8021.8 15663.3 8271.3 15912.8 1.60 2626.0 10647.8 3 2 22 2 23225 6992.5 14633.9 7845.0 15486.5 2.00 1939.8 8932.3 4 2 2 6 28170 6876.4 14517.9 7602.9 15244.3 2.67 3274.4 10150.8 5 2 16 5 28755 6698.8 14340.3 7422.1 15063.5 3.66 3434.6 10133.4 6 1 2 4 24565 6104.3 13745.7 7202.4 14843.9 4.36 2759.6 8863.9 7 1 32 4 29680 6038.1 13679.5 7036.1 14677.6 5.31 3952.5 9990.5 8 2 16 4 25565 5818.5 13460.0 6883.9 14525.4 6.00 2847.7 8666.2 9 2 2 5 23525 5594.6 13236.1 6740.6 14382.1 6.36 2419.8 8014.4 10 2 30 4 23690 5569.2 13210.7 6623.5 14265.0 7.27 2754.5 8323.7 11 1 17 5 26511 5494.6 13136.1 6520.9 14162.3 8.21 3338.2 8832.8 12 2 20 3 22845 5367.5 13009.0 6424.8 14066.2 9.16 2505.4 7872.9 13 2 22 6 17320 5362.9 13004.4 6343.1 13984.5 9.20 853.4 6216.3 14 2 19 1 27960 5246.1 12887.5 6264.7 13906.2 10.13 3755.2 9001.3 15 2 21 3 27155 5183.8 12825.3 6192.7 13834.1 11.08 3525.3 8709.1 16 1 3 2 23045 5070.3 12711.8 6122.5 13764.0 12.03 2570.9 7641.3 17 2 16 1 22040 4845.7 12487.2 6047.4 13688.9 12.38 2199.2 7044.9 18 1 30 5 21435 4601.3 12242.7 5967.1 13608.5 13.05 2109.3 6710.5 19 2 3 2 21225 4563.4 12204.8 5893.2 13534.6 13.72 2232.9 6796.3 20 2 22 4 14165 4492.2 12133.7 5823.1 13464.6 13.58 273.0 4765.2
f: individual phenotypic value or field measurement; a: predicted additive genetic effect; u + a: predicted additive genetic value; Ne: effective population size; d: genetic effect of predicted dominance (assuming a certain mean degree of dominance in the case of half-sibling progenies); g = a + d: predicted genotypic effect.
The estimated genetic diversity of 148 guarana clones was acessed using cluster analysis, via Euclidean distance and the Tocher clustering method, and the authors concluded that genetic divergence was low (NASCIMENTO FILHO at al., 2001).
In other study, Nascimento Filho et al. (1992) evalueted 26 characters related to the aerial part and root system of guarana plants, and found high variability for all traits between the clones studied. They obtained genotypic determination coefficients of over 70% for the most of the variables studied, showing that simple breeding methods could be applied to give good selective gains.
113
Table 5. Genetic similarity between progenies pairs considering 19 qualitative variables.
Manaus, 2016. Progenies CP D Value (25;31) 17 2 0.895 (3;29), (8;9) 16 3 0.842 (1;3), (4;13), (7;23), (8;22), (8;24), (9;18), (11;14), (11;27), (17;34), (25;29), (28;34), (29;31) 15 4 0.789 (1;35), (2;11), (2;14), (2;27), (3;8), (3;11), (3;19), (3;21), (3;35), (6;36), (8;18), (8;25), (8;29), (9;24), (9;25), (9;29), (10;14), (10;19), (11;26), (11;35), (12;36), (13;23), (14;35), (17;28), (17;30), (18;24), (18;30), (19;21) 14 5 0.737 (1;10), (1;33), (3;6), (3;32), (5;10), (5;21), (5;28), (5;32), (5;34), (5;36), (8;32), (10;17), (11;15), (12;15), (12;20), (15;19), (16;32), (17;23), (19;32), (19;33), (22;36), (23;27), (27;33), (30;32), 32;34) 7 12 0.368 (1;6), (1;16), (1;24), (2;28), (5;16), (10;15), (10;25), (15;16), (15;21), (15;26), (15;27), (17;32), (20;24), (20;36), (28;32), (29;32) 6 13 0.316 (5;12) 5 14 0.263 (6;20) 4 15 0.211 Mean 0.553
CP: agreement of values; D: disagreement of values.
From the results, it was observed that the progenies present sufficient genetic diversity for the selection of progenies and superior individuals that, with controlled crosses or intercrosses, could generate a base population with high yield and sufficient genetic diversit y to face future biotic or abiotic problems. In addition, it is possible to verify that the crosses between the individuals of progenies 22 and 16 would produce a greater genetic diversity; and they are productive materials that could form a base population for the purpose of genetic improvement with greater probability of retrieval of superior genotypes.
114
Figure 1. Dendrogram of 36 guarana progenies using the Euclidean genetic distance and the UPGMA grouping method for the variable yield.
115
CONCLUSIONS
The progenies present sufficient genetic diversity for the selection and could generate a base population with high productivity and sufficient genetic diversity, increasing the probability of retrieval of superior genotypes from controlled crossings.
REFERENCES
ALVAREZ, G.O. 2004. Política Sateré-Mawé (índios maués): do movimento social à política local. Revista de Estudos e Pesquisas, FUNAI, Brasília, v.1, n.2, p.9-44.
ANDRADE, J.A.C.; MIRANDA FILHO, J.B. 2008. Quantitative variation in the tropical mayze population ESALQ-PB1. Scientia Agrícola, Piracicaba, v. 65, n. 2, p.174- 182.
ARAÚJO, R.G.; ANDREOLI R.V.; CANDIDO L.A.; KAYANO M.T.; SOUZA R.A.F. 2013. A influência do evento El Niño: oscilação sul e atlântico equatorial na precipitação sobre as regiões norte e nordeste da América do Sul. Acta Amazonica, Manaus, v.43, n.4, p.469-480. ARRIEL, E.F.; PAULA, R.C.; BAKKE, O.A.; SANTOS, D.R.; ARRIEL, N.H.C. 2005.
Divergência genética entre matrizes de faveleira usando caracteres biométricos de frutos e sementes. Caatinga, Mossoró, v. 18, n. 4, p. 219-225.
ATROCH, A.L.; NASCIMENTO FILHO, F.J. 2001. Avaliação do programa de melhoramento genético do guaranazeiro via seleção clonal. In: CONGRESSO BRASILEIRO DE MELHORAMENTO DE PLANTAS, 1., Goiânia, GO, 03 a 06 de abril, 2001. Anais. Goiânia: Embrapa Arroz e Feijão. (Embrapa Arroz e Feijão. Documentos, 113).
ATROCH, A.L.; NASCIMENTO FILHO, F.J. 2005. Classificação do coeficiente de variação na cultura do guaranazeiro. Revista de Ciências Agrárias, Belém, n.43, p.43-48.
ATROCH, A.L.; NASCIMENTO FILHO, F.J.; ATROCH, E.M.A.C. 2010. Diagnose precoce sobre produtividade do guaranazeiro (Paullinia cupana var. sorbilis) por meio de caracteres de crescimento. Boletim de pesquisa e desenvolvimento. Manaus, Embrapa Amazônia Ocidental, Manaus, AM.
ATROCH, A.L.; NASCIMENTO FILHO, F.J.; RESENDE, M.D.V.; LOPES, R.; CLEMENT, C.R. 2010. Avaliação e seleção de progênies de meios-irmãos de guaranazeiro. Revista de
Ciências Agrárias, Belém, v. 53, n. 2, p. 123-130.
ATROCH, A.L.; NASCIMENTO FILHO, F.J.; RESENDE, M.D.V.; LOPES, R.; CLEMENT, C.R. 2011. Predição de valores genéticos na fase juvenil de progênies de meios irmãos de guaranazeiro. Revista de Ciências Agrárias, Belém, v. 54, n. 1, p. 73-79.
ATROCH, A.L.; NASCIMENTO FILHO, F.J.; RESENDE, M.D.V. 2013. Seleção genética simultânea de progênies de guaranazeiro para produção, adaptabilidade e estabilidade temporal. Revista Ciência Agrárias, Belém, v. 56, n. 4, p. 347-352.
BECK, H.T. 2005. Caffeine, alcohol, and sweeteners. In: Prance GT (ed). The Cultural History
of Plants. New York: Routledge, p. 173–90.
BENTO, C.S.; SUDRE, C.P.; RODRIGUES, R.; RIVA, E.M.; PEREIRA, M.G. 2007. Descritores qualitativos e multicategóricos na estimativa da variabilidade fenotípica entre acessos de pimentas. Scientia Agrária, Campos dos Goytacazes, v.8, n.2, p.149-156.
CPTEC – Centro de Previsão de Tempo e Estudos Climáticos. 2014. Available at: http://enos.cptec.inpe.br/ El Niño e La Niña [online]. Access in June 21, 2014.
116
CRUZ, C.D.; CARNEIRO, P.C.S. 2006. Modelos biométricos aplicados ao melhoramento
genético. 2. ed., Editora UFV, Viçosa, 585p., v. 2.
EMBRAPA. 2011. Centro de Pesquisa Agroflorestal da Amazônia Ocidental. Guia das novas
cultivares de guaranazeiro para o Estado do Amazonas. Transferência de Tecnologia.
Manaus, 16p.
FERRÃO, R.G. 2008. Parâmetros genéticos em café conilon. Pesquisa Agropecuária Brasileira, Brasília, v.43, p.61-69.
IBGE. 2017. Instituto Brasileiro de Geografia e Estatística. Produção Agrícola Municipal, Rio de Janeiro: IBGE.
INMET. 2018. Instituto Nacional de Meteorologia. Banco de dados meteorológicos para ensino
e pesquisa [online]. Available at:
http://www.inmet.gov.br/portal/index.php?r=bdmep/bdmep. Access in April 19, 2018. HAHSLER, M.; KARPIENKO, R. 2016. Visualizing association rules in hierarchical groups.
Journal of Business Economics, Hagen, p.1-19, DOI 10.1007/s11573-016-0822-8.
IPNI. 2008. The International Plant Names Index. Available at:
www.ipni.org/ipni/query_ipni.html. Query: family = Sapindaceae; genus = Paullinia. Access in June 22, 2008.
MARDIA, A. K. V.; KENT, J. T.; BIBBY, J. M. 1997. Multivariate analysis, London, Academic Press, 518.
MILIGAN, G.W.; COOPER, M. C. 1985. An examination of procedures for determining the number of clusters in a data set. Psychometrika, Colorado Springs, v.50, p.159-179.
MOJENA, R. 1977. Hierarquical grouping methods and stopping rules: an evaluation. The
Computer Journal, London, v.20, n.4, p.359-363.
NASCIMENTO FILHO, F. J.; CRUZ, C. D.; GARCIA, T. B. 1992. Divergência genética em plantas jovens de guaranazeiro e possibilidades de melhoramento. Pesquisa Agropecuária
Brasileira, Brasília, v.27, p.1571- 1577.
NASCIMENTO FILHO, F.J.; ATROCH, A.L.; SOUZA, N.R.; GARCIA, T.B.; CRAVO, M.S.; COUTINHO, E.F. 2001. Divergência genética entre clones de guaranazeiro. Pesquisa
Agropecuária Brasileira, Brasília, v.36, p.501-506.
OLIVEIRA, E.J.; DIAS, N.L.P.; DANTAS, J.L.L. 2012. Selection of morpho-agronomic descriptors for characterization of papaya cultivars. Euphytica, Wageningen, v.185, n.2, p.253–265.
PIZZA, C; RASTRELLI, L; TOTARO, K; DE SIMONE, F. 1999. Paullinia cupana (guaraná) determinazione degli alcaloidi xantinici per la valutazione della qualita´ di prodotti base di guarana´ . In: Il Guarana´ degli Indios Satere´-Maue´. Istituto Italo-Latinoamericana, Rome: Serie Scienza 13, p. 13–22.
RESENDE, M.D.V. 2007a. O Software SELEGEN-REML/BLUP. Campo Grande: Embrapa Pantanal (Embrapa, Documentos), 305p.
RESENDE, M.D.V. 2007b. Selegen–Reml/Blup: Sistema Estatístico e Seleção Genética
Computadorizada via Modelos Lineares Mistos. Colombo: EMBRAPA Florestas. 361p.
RUMSEY, D. 2009. Estatística para leigos. Rio de janeiro: Atlas Books. 368p.
SMITH, N.; ATROCH, A. L. 2007. Guaraná’s journey from regional tonic to aphrodisiac and global energy drink. Evidence-based Complementary and Alternative Medicine, Oxford, v. 7, n. 3, p. 279–282.
Received in: January 24, 2017 Accepted in: May 17, 2019
![Table 1. Agro-morphological descriptors of guarana [Paullinia cupana var. sorbilis (Mart.) Ducke] Manaus, 2016](https://thumb-eu.123doks.com/thumbv2/123dok_br/18419602.895103/5.892.106.812.166.1128/table-morphological-descriptors-guarana-paullinia-cupana-sorbilis-manaus.webp)