Christophe Campos Peixoto Quality Model for Spreadsheets
Design and Implementation
Tese de Mestrado
Mestrado em Informática
Trabalho efectuado sob a orientação de Prof. Dr. João Saraiva e Dr. Jácome Cunha
Acknowledgment
First of all, i would like to thanks my family and close friends, for their constant support during all my college life, giving me advices when I faced difficult choices and been there for me in the good and bad times.
It is a pleasure to thank the two persons that help me the most on this thesis, my advi-sor Prof. João Saraiva and my co-adviadvi-sor Dr. Jácome Cunha. I would like to show my gratitude to Prof. Saraiva, for all his support, encouragement and availability, indispens-able for the concretization of this thesis. And also for the cordiality with which he always answered my questions, and for valuable suggestions on the writing of the thesis.
I would like to also show my gratitude to Dr. Jácome Cunha, always available to give me (very good) advices on my work and pointing me on the good direction, answering innumerous emails and providing my the needed papers or information, whenever i was stuck. It is an honor for me to have been supervised by such great and well-experienced persons like them.
Now is time to thank all the friends and colleagues, not only from the informatics MSc, who shared with me advices, ideas and encouragement words, towards all this months while we were working on our thesis. And I want to thank specially the ones that took the time to read my thesis, helping me find the little’s grammatical mistakes that I was unable to find by myself.
Finally, I am deeply thankful to my parents and sisters, for all their love and support, believing in me even when I didn’t. And also a great thank you for Dorottya, for all her support and encouragement, and sheering me up on the bad days.
Resumo
Há um grande número de Folhas de Calculo desenvolvidas por programadores end-user, e este número está aumentando continuamente. Uma vez que os programadores end-user muitas vezes têm pouco ou nenhum treinamento em programação de todo, há um grande número de Folhas de Calculo, cerca de 90%, que contém erros e tem uma má qualidade. A falta de uma norma internacional para a avaliação da qualidade da Folhas de Calculo, os developers não sabem os objectivos a atingir para criar uma Folha de Calculo de qualidade, e os utilizadores não sabem se a Folha de Calculo que eles estão a usar têm qualidade. Por essas razões, com base na ISO\IEC9126, trabalhamos e definimos o nosso próprio modelo de qualidade para Folhas de Calculo.
Usando as métricas desenvolvidas pelos nossos parceiros SSaaPP, SIG e HugoRibeiro, analisamos o amplamente utilizado EUSES Spreadsheet corpus, obtendo os valores nor-mais esperados numa Folha de Calculo. Com esses valores, nós fomos capazes de quan-tificar cada Característica e Sub-Características do nosso modelo de qualidade, e de definir uma classificação para os diferentes intervalos de valores. E com o crescente número de aplicações móveis e web, e também de Web-based office suite como o Google Docs, onde os documentos podem ser acedidos em qualquer lugar com conexão à internet, abrindo-se novas perspectivas, optamos por criar uma aplicação Android no Android SDK, e um aplicativo Web com o Google Web Toolkit (GWT),em que qualquer pessoa com uma conta Google Docs pode testar a qualidade de sua Folha de Calculo com base no nosso modelo de qualidade para Folhas de Calculo.
Abstract
There is a huge number of Spreadsheets developed by end-user programmers, and this number is continually increasing. Since those End-user programmers often have little or no training at programming at all, there is a huge number of spreadsheets, around 90% , which contains errors and have a poor quality. Lacking of an international standard for the evaluation of Spreadsheet quality, developers doesn’t know what objectives to aim to achieve a quality Spreadsheet, and users doesn’t know if the Spreadsheet they are using have quality. For this reason, based on the ISO\IEC9126, we worked on and define our own Quality Model for Spreadsheets.
Using the metrics developed by both SSaaPP partners, SIG and Hugo Ribeiro, we ana-lyzed the widely-used EUSES Spreadsheet corpus, obtaining the normal values expected on a Spreadsheet. With those values, we were able to quantify each Characteristic and Sub-Characteristics of our Quality Model, and to define a rating for the different range of values.
And with the growing number of both mobile and web applications, and also of Web-based office suite like Google Docs, where documents can be acceded anywhere with an internet connection, opening new perspectives, we choose to create one Android Applica-tion an Android SDK, and a Web ApplicaApplica-tion with Google Web Toolkit (GWT), in which any person with a Google Docs account could test the quality of his spreadsheet based on our Quality Model for Spreadsheet.
Contents
Acknowledgment i
Resumo iii
Abstract v
Contents . . . ix
List of Figures . . . xii
List of Tables . . . xiv
1 Introduction 1 1.1 Motivation . . . 1
1.2 Overview of Approach . . . 3
1.3 Tools . . . 3
2 SpreadSheet Quality Model 7 2.1 Software Quality Analysis . . . 7
2.2 Quality Model . . . 9 2.2.1 Functionality . . . 10 2.2.2 Reliability . . . 11 2.2.3 Usability . . . 12 2.2.4 Efficiency . . . 13 2.2.5 Maintainability . . . 14 vii
viii CONTENTS 2.2.6 Portability . . . 15 2.3 Quantification Algorithms . . . 17 2.3.1 Functionality . . . 19 2.3.2 Reliability . . . 21 2.3.3 Usability . . . 23 2.3.4 Efficiency . . . 25 2.3.5 Maintainability . . . 26 2.3.6 Portability . . . 28 3 Evaluation 31 3.1 Database . . . 31 3.2 Modeling . . . 33 3.3 Grades . . . 34 3.4 Financial . . . 35 3.5 Homework . . . 37 3.6 Inventory . . . 38 4 Web Application 41 4.1 Connection with Google Docs . . . 42
4.2 Ochiai Algorithm . . . 45
4.3 Spreadsheet Quality Model . . . 47
5 Android Application 51 5.1 Connection with Google Docs . . . 52
5.2 Creating POI Object . . . 53
5.3 Analyzing the Quality . . . 54
6 Conclusion 57 6.1 Results . . . 57
CONTENTS ix
List of Figures
1.1 SpreadSheet Example . . . 2
1.2 Arquitecture . . . 5
2.1 The Software Quality Model ISO\IEC 9126 . . . 9
2.2 SpreadSheet Quality Model . . . 16
2.3 Euses Categories . . . 17
2.4 Graphics of the Analysis of the TotalCells metric . . . 18
2.5 Spreadsheet Example 2 - 02rise . . . 19
2.6 Rating Result on the Web Application . . . 29
3.1 Results of Metrics for the Database Categorie . . . 32
3.2 Results of the Quality Model for the Database Categorie . . . 32
3.3 Results of Metrics for the Modeling Categorie . . . 33
3.4 Results of the Quality Model for the Modeling Categorie . . . 33
3.5 Results of Metrics for the Grades Categorie . . . 34
3.6 Results of the Quality Model for the Grades Categorie . . . 35
3.7 Results of Metrics for the Financial Categorie . . . 36
3.8 Results of the Quality Model for the Financial Categorie . . . 36
3.9 Results of Metrics for the Homework Categorie . . . 37
3.10 Results of the Quality Model for the Homework Categorie . . . 37
3.11 Results of Metrics for the Inventory Categorie . . . 38
3.12 Results of the Quality Model for the Inventory Categorie . . . 39 xi
xii LIST OF FIGURES
4.1 Login Interface from the Web Application . . . 43
4.2 List of Spreadsheets from the Web Application . . . 44
4.3 List of Worksheets from the Web Application . . . 45
4.4 Result of the Ochiai Algorithm . . . 47
4.5 Result of the Spreadsheet Quality Model . . . 49
4.6 Result Complete of the Spreadsheet Quality Model . . . 49
5.1 Login Layout of the Android Application . . . 52
5.2 Layout with the SpreadSheets List . . . 53
5.3 Layout with the Worksheets List . . . 54
5.4 Layout with the Model Quality . . . 55
List of Tables
2.1 Suitability 1 . . . 19 2.2 Suitability 2 . . . 20 2.3 Accuracy 1 . . . 20 2.4 Accuracy 2 . . . 20 2.5 Interoperability 1 . . . 21 2.6 Interoperability 2 . . . 21 2.7 Maturity 1 . . . 22 2.8 Maturity 2 . . . 22 2.9 Fault Tolerance 1 . . . 22 2.10 Fault Tolerance 2 . . . 22 2.11 Understanbility 1 . . . 23 2.12 Learnability 1 . . . 23 2.13 Learnability 2 . . . 23 2.14 Learnability 3 . . . 24 2.15 Operability 1 . . . 24 2.16 Attractiveness 1 . . . 24 2.17 Attractiveness 2 . . . 24 2.18 Time Behavior 1 . . . 252.19 Time Ressources Utilization 1 . . . 25
2.20 Time Ressources Utilization 2 . . . 25
2.21 Analyzability 1 . . . 26 xiii
xiv LIST OF TABLES 2.22 Analyzability 2 . . . 26 2.23 Analyzability 3 . . . 26 2.24 Changeability 1 . . . 27 2.25 Changeability 2 . . . 27 2.26 Stability 1 . . . 27 2.27 Stability 2 . . . 27 2.28 Testability 1 . . . 28
Chapter 1
Introduction
Summary
In this Chapter, we present the content of this thesis. First we present our moti-vation about the creation of a Quality Model for Spreadsheets, followed by the overview of our approach to solve this problem. Finally we talk about the tools created to apply our Spreadsheet Quality Model on Web-based Spreadsheets.
1.1
Motivation
Spreadsheets are a popular End-user development tool, In fact, spreadsheets are probably the most widely used end-user programming system [7] . What is an End-user program-mer? An End-user is, by definition, a human agent that will use a product. In this partic-ularly case, is anyone that is not a trained programmer. These End-user programmers are people who often have little or no training at programming at all but still do some amount of programming. And not only End-user programmers outnumbers professional program-mers, but this difference is projected to increase in a fast rate, with an estimation of 55 million End-users just in the U.S in 2012 [10]. For this reasons, there is a huge number of spreadsheets, around 90% [2], which contains errors and have a poor quality.
A spreadsheet is the computer equivalent of a paper ledger sheet, that is used for stor-ing, organizing and manipulating data. It consists of a grid made from columns and rows. In a spreadsheet application, each value sits in a cell. You can define what type of data is in each cell and how different cells depend on one another. The relationships between cells
2 CHAPTER 1. INTRODUCTION are called formulas, and the names of the cells are called labels.
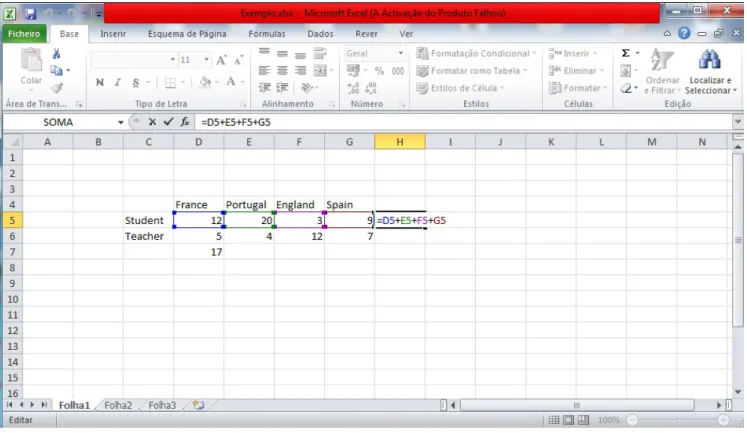
Figure 1.1: SpreadSheet Example
A single cell is usually referenced by its column and row, with a capital letter for the column and a number for the row. In the Spreadsheet example presented on the figure, we have the Cell C5 which is a label with the value on alphanumeric “Student”, while the Cell D5 contains the numeric value 12. Both Cells D7 and H5 are formula since they starts with the= sign, even if on the figure we only show the =sign from H5 formula, which adds all the numeric value from that row, making references to the cells by their column letter and row number. From the label on that row, “students”, we can conclude that the formula is the sum of all the students.
The poorly designed spreadsheet files can be an issue for the companies or users using them. Under these circumstances, if many spreadsheets contain errors, the consequences could be dire. Unfortunately, errors in bottom-line values are very likely because spread-sheet modeling is incredibly unforgiving of errors, and most large spreadspread-sheets are likely to contain errors. Even if the spreadsheet modeling is done carefully, they would still contains
1.2. OVERVIEW OF APPROACH 3 errors since humans have limitations on cognitive tasks, and develop a large Spreadsheet is a pretty complex cognitive task. Since eliminate errors would be impossible, there is a need to find some ways to reduce those errors. A good way to reduce those errors would to be able to measure the quality of the Spreadsheets, finding where their weaknesses are, so they can be more easily fixed. But if in software development we have the ISO\IEC9126 [12] as an international standard for the evaluation of Software Quality where software quality is structured in a set of characteristics and sub-characteristics, there isn’t any kind of Quality Model for Spreadsheet allowing us to measure the Quality of a Spreadsheet.
1.2
Overview of Approach
Based on the ISO\IEC9126 model, we worked on our Model of Quality for Spreadsheet, defining all the features that are important on a spreadsheet and how the quality of that feature can be quantify. Even if our quality model is based on the ISO\IEC 9126 model, they are quite different since developing a Spreadsheet is very different of developing Soft-ware, and the user’s needs are very different too. Our model has the characteristics and sub-characteristics appropriate for Spreadsheet, with how those characteristics can be mea-sured. The model would allow those companies to check the quality of their spreadsheets, being able to see which features needs to some changes, improving the results and accu-rateness of the spreadsheets.
For measuring the characteristics defined on the Quality Model we used the metrics from both SSaaPP project partner SIG and MSc student Hugo Ribeiro. In order to access the quality of a Spreadsheet we needed to analyze a large set of such Software artifacts. Based on the results inferred by analyzing a large repository, we have a more clear and accu-rate idea of what the quality of Spreadsheet is. Thus we use on this thesis the well-know and widely used EUSES consortium data Spreadsheet corpus [4], which consists of 5607 Spreadsheets.
1.3
Tools
With the growing number of both mobile and web applications, and also of Web-based office suite like Google Docs, where documents can be acceded anywhere with an
inter-4 CHAPTER 1. INTRODUCTION net connection, opening new perspectives, we choose to create one Android Application on Android SDK, and a Web Application with Google Web Toolkit (GWT), in which any person with a Google Docs account could test the quality of his spreadsheet based on our Quality Model for Spreadsheet. The objectives of both applications weren’t only to allow users with Google Docs to test the quality of their Spreadsheets, but also to be a platform to other tools for Spreadsheets. The mobility of Google Docs join with the possibility to access our application in any computer, would make very easy to users to use our Quality Model through the Web Application.
For the developing of the Web Application we chosen Google Web Toolkit (GWT), that is an open source set of tools that allows web developers to create and maintain complex JavaScript front-end applications in Java. The programming of the Views, page that the user access, is done in a similar way that in Java Swing, but the result are Web Pages instead of a Desktop Application. Also, and since one of our objectives was to create an Android Application , also from Google, we think that it would make the compatibility between the two frameworks easier. To connect to Google Docs we used the Google Data Client Library with the Google Spreadsheet API. The application present a set of interfaces where the user can log on on his Google Docs account, choose the Spreadsheets and Worksheets he wants to use, check their quality, apply the Ochiai algorithm.
Android is a software stack for mobile devices that includes an operating system, mid-dleware and key applications, that belong to Google but was developed by Open Handset Alliance. Is based on the Linux Kernel. And at this point, the Android operating system is the world’s best-selling Smartphone platform [8]. Using the Android SDK we developed an Android application, that would allow any user with an Android mobile device to check the quality of his spreadsheet using only his mobile phone and an internet connection. The objectives for the Android application where the same as for the Web application, allow the user to log on on his Google Docs Account, see a list of all his spreadsheets and work-sheets where he can use the one he want to use, and check their quality applying our Quality Model. One of our objectives were to release the application into the Android Market, after being fully developed. Android Market is the online app store run by Google, though apps can also be downloaded from third-party sites.
1.3. TOOLS 5 and allows users to browse and download apps published by third-party developers, hosted on Android Market. Only devices that comply with Google’s compatibility requirements are allowed to preinstall Google’s closed-source Android Market app and access the Mar-ket.The Market filters the list of applications presented by the Market app to those that are compatible with the user’s device, and developers may restrict their applications to partic-ular carriers or countries for business reasons. Users can also install apps directly using APK files, or from alternative app markets.
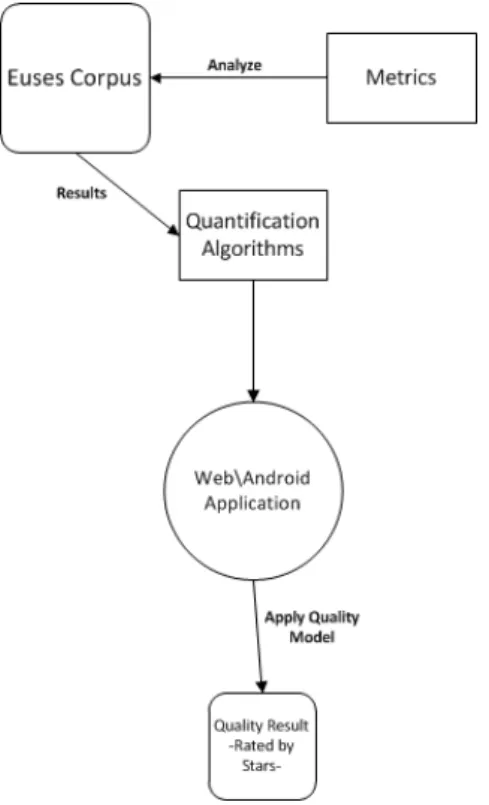
Figure 1.2: Arquitecture
Outline: The remainder of this article is organized as follows. Section 2 gives a view about Software Quality, followed by the defining and justification of our Spreadsheet Qual-ity Model and how we quantify the qualities Characteristics and Sub-Characteristics ex-pected on a Spreadsheet. On Chapter 3 we analyze 5 files for each categories from the Euses, presenting and explaining the results of each category . Along chapters 4 and 5, we explain how we developed two applications, a Web one and an Android, allowing us to login on Google Docs account, and then analyze our Spreadsheets there with our Spread-sheet Quality Model, having a feedback in form of grades for each Characteristics and Sub-Characteristics. Finally, Section 6 provides the conclusion and future work.
Chapter 2
SpreadSheet Quality Model
Summary
In this chapter we talk about Software Quality, and about the evaluation model ISO\IEC 9126. This will lead us to the presentation of our Quality Model, de-scribing all the qualities expected from a Software artifact such as a Spreadsheet and explaining why all this qualities are important, or can affect the Spread-sheet general quality. We will also explain how we quantify each Characteristic and Sub-Characteristic defined our Spreadsheet Quality Model, followed by the presentation of examples and results obtained using the EUSES Corpus.
2.1
Software Quality Analysis
“In the context of software engineering, software quality measures how well software is designed (quality of design), and how well the software conforms to that design (quality of conformance), although there are several different definitions, including conformance to customer expectations. It is often described as the ’fitness for purpose’ of a piece of software.”[13]
As described "Software Quality Analysis" (SQA or QA), is an engineering and monitoring process where the objective is assure the software quality by the definition of some de-velopment process, and is measured as the degree to which the software fulfills a desired combination of quality attributes.
8 CHAPTER 2. SPREADSHEET QUALITY MODEL In software development, we can also say that the quality of the final product is directly linked to the quality of the development process, since the Quality Analysis involves the process throughout the life cycle of the project – starting from the requirement analysis phase through the delivery stage. For that the development team must follows the correct process and thus prevent problems during later stages of the project.
The QA process involves lot of time throughout the various stages of the project. It re-quires documentation, approval and follow specific rules for development process. Even if this make the development process slower, a well-managed QA process will help in long term benefits for complex projects and prevent problems during.
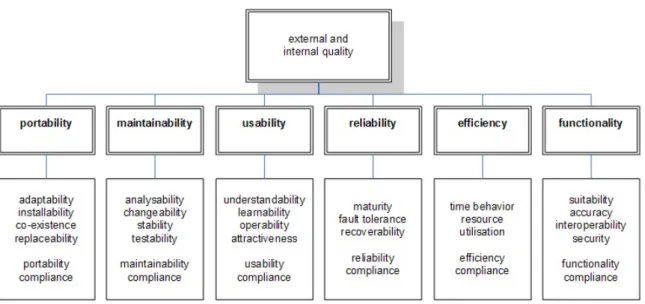
But one problem about software quality is that quality is inherently subjective. Different persons will have a very differently notion of quality using a same software. The ISO\IEC 9126 is an international standard for the evaluation of software quality, and in this standard was presented an quality model that classified software quality in a structured set of char-acteristics and sub-charchar-acteristics.
The characteristics are:
• Functionality: the software capacity to satisfy the user needs, either implied or stated. (With the sub-characteristics: suitability, accuracy, interoperability, security and functionality compliance )
• Reliability: the software capacity to maintain its level of performance under stated conditions for a stated period of time. (With the sub-characteristics: maturity, fault tolerance, recoverability and reliability compliance)
• Usability: the software capacity to be understood, learning how it works, be used and intuitive to the user. (With the sub-characteristics: understandability, learnability, operability, attractiveness and usability compliance)
• Efficiency: The amounts of resources used are compatible with the performance level of the software. (With the sub-characteristics: time behavior, resource utilization and efficiency compliance)
• Maintainability: the software capacity to be modified, either to expand functional-ities or to correct errors. (With the sub-characteristics: analyzability, changeability,
2.2. QUALITY MODEL 9 stability, testability and maintainability compliance)
• Portability: the software capacity to be transferred from one environment to another. (With the sub-characteristics: adaptability, instability, co-existence, replaceability and portability compliance)
Figure 2.1: The Software Quality Model ISO\IEC 9126
2.2
Quality Model
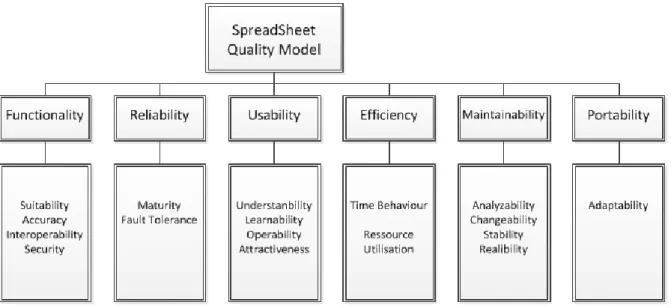
Even being such a popular End-user development tool, Spreadsheets lack of a Quality Model defining which quality characteristics are expected on a well-developed Spread-sheet. As told before the notion of quality is subjective and it can change from person to person, that’s why having a defined model of what a Spreadsheets needs to have quality can help the people that works with Spreadsheets to know what kind of requirements they need to aim at, to develop a quality Spreadsheet. Since there is already the ISO\IEC9126 as an international standard for the evaluation of Software Quality, we worked on a Spreadsheet Quality Model based on the ISO\IEC 9126.
Since the purpose of a Spreadsheet is of course different from a software, the developing process and the qualities expected from both are also different. Some concepts as Recov-erability are not applicable on Spreadsheets but others like Suitability or Learnability are
10 CHAPTER 2. SPREADSHEET QUALITY MODEL on both Spreadsheets and Software. Having that in mind, and also the user’s needs and the purpose of Spreadsheets, we choose the qualities expected for each Characteristics and Sub-Characteristics applicable on Spreadsheet, defining our Spreadsheet Quality Model.
2.2.1
Functionality
The capacity of the Spreadsheet to satisfy the user needs, either implied or stated.
• Suitability:Is the quality of having the properties that are right for a specific purpose. 1. Number of incongruences
2. Number of references to Blank Cells in Formulas
If a Spreadsheet has many incongruences and references to Blank Formulas in For-mulas then it doesn’t have the right properties for his specific purpose, since there are some errors on his formula
• Accuracy: Is the faithful measurement or representation of the true, correctness 1. Number of Output Cells with Errors\Bad Content
2. Number of incongruences
3. Number of Blank Cells referenced in Formulas
A great number of both incongruences and Blank Cells referenced in Formulas would drop the accuracy of the Spreadsheet. Beside that if the Spreadsheet have also many Output Cells with Errors, then it isn’t very accurate.
• Interoperability: Is the ability of two or more Sheets or components to exchange information and to use the information that has been exchanged
1. Data been exchanged between Sheets 2. Quantity of rightful formulas
3. Total of Cells with references 4. Total of references
2.2. QUALITY MODEL 11 We can say that a Spreadsheet have a good Interoperability if most of his formulas are correct since that means that the components are changing information without any problem. Also if the Spreadsheet have many references, Cells with references and Data been exchanged between his Sheets then it has a good interoperability. • Security:
1. Protected Formulas, for End user with little knowledge of SpreadSheets 2. Protected Cell for Data only for reading
3. Use Password to lock Workbook\Worksheets
Since Spreadsheets are mostly used by End-Users with little knowledge of program-ming, a Spreadsheet is safe if some of his cells like the Formulas or Data are pro-tected, preventing the user to change them by mistake. Besides that, the Spreadsheet security can be increase with a Password locking the Workbook or the Worksheets, preventing anyone unauthorized to access or change it.
2.2.2
Reliability
The capacity to maintain its level of performance under stated conditions for a stated period of time.
• Maturity: The state of quality of being fully developed 1. Number of Labeled Rows\Columns that are empties 2. Number of Blank Cells in a matrix
3. Number of Blank Cells
4. Difference between the Sheets that the Spreadsheet have, and the ones been used
If the Spreadsheet has many Sheets but doesn’t use them all, then is not completely developed. Also if there is a great number of Labeled Rows or Columns that are emp-ties, or Blank Cells, or even matrixes with many Blank Cells then the Spreadsheet is not completely developed
• Fault Tolerance: Is the property to continue operating properly in the event of one or more faults within some of its components.
12 CHAPTER 2. SPREADSHEET QUALITY MODEL 1. Number of Cells been referenced (Directly or indirectly) by many other Cells. 2. Number of Complex Formulas
If a cell is referenced by many other cells (Directly or indirectly), lesser is the fault tolerance since modifying that cell can diffuse mistake on all the cells that reference it (Directly or Indirectly).Also if a Spreadsheet has many Complex Formulas, is less fault tolerant because those Formulas reference many Cells, so changing just one of those can lead to an Error on the Formula result
• Recoverability: Capacity to restore oneself to a normal state Doesn’t Apply.
Since a Spreadsheet simply can’t restore herself in any way, Recoverability is not one of the Characteristics expected on a Spreasheet
2.2.3
Usability
The capacity of the Spreadsheet to be understood learning how it works, be used and intu-itive to the user
• Understanbility: Is capacity of being understood 1. Different colors for different types of Data 2. Separate Input, Computation and Output 3. Number of Cells
There is many ways to make a Spreadsheet more understandable, being the more im-portant one separate the Input, the Computation and Output parts of the Spreadsheet. Also giving different background colors for the different types of Data Cells can turn the Spreadsheet easier to understand. Finally having a big number of Cells makes the Spreadsheet harder to understand
• Learnability: Is the capacity to enable the user to use it 1. Number of Cells
2. Different colors for different types of Data 3. Separate Input, Computation and Output
2.2. QUALITY MODEL 13 4. Number of Complex Formulas
5. Amount of Data being exchanged between Sheets 6. Number of References
The more Cells and Complex Formulas a Spreadsheet have, more difficult is to learn how to use it. The same if the Spreadsheet have many references and Data been exchanged between his Sheets. On the other hand to improve his learnability we can give different background colors for different types of Data, and separate the Input, Computation and Output parts.
• Operability: Is the capacity of being operated 1. Create\have data validation drop down lists 2. Separate Input, Computation and Output
If we separate the Input from both the Computation and Output then the Spreadsheet is easier to operate. Also if the Spreadsheet have data validation drop down lists, it would also be easier to operate.
• Attractiveness: Is the capacity to be attractive\appealing to the user 1. Create\have data validation drop down lists
2. Different colors for different types of Data 3. Separate Input, Computation and Output
As on the others sub-characteristics from the Usability, is important to have the Input, Computation and Output parts of the Spreadsheets separate from each other in order to be more appealing for the user. Beside that giving different background colors for different types of Data Cells and having data validation drop down lists, also improve the attractiveness.
2.2.4
E
fficiency
The amounts of resources used are compatible with the performance level of the Spread-sheet
14 CHAPTER 2. SPREADSHEET QUALITY MODEL 1. Number of V-LookUp
2. Number of Search Formulas used 3. Number of Complex Formulas
Both Search Formulas and V-LookUp functions are components that take a long time to compute, so the most of them that a Spreadsheet has the more time will be needed to compute the same Spreadsheet. Also if the Spreadsheet has many complex Formulas, it will also increase the computing time.
• Resources Utilization: 1. Number of V-LookUp 2. Amount of Non-Blank Cells 3. Number of Complex Formulas
Since the V-LookUp function use many resource, the most of V-LookUp functions a Spreadsheet has the more resources it needs. Beside that if the Spreadsheet has a high number of Non-Blank Cells or Complex Formulas, is going to use more resources.
2.2.5
Maintainability
The capacity to be modified, either to expand functionalities or to correct errors
• Analyzability: Is the capacity to be analyze, to conclude the effort needed for diag-nosis deficiencies
1. Number of Cells
2. Data well organized, easier to find faults and parts to be modified 3. Number of References
4. Number of Formulas
If a Spreadsheet has a big number of Cells, References or Formulas, is harder to ana-lyze and find the possible deficiencies. A good way to turn the Spreadsheet easier to analyze is to have the Data well organized (separate Input, Computation and Output) • Changeability: How well can a Spreadsheet be changed, conclude the effort needed
2.2. QUALITY MODEL 15 1. Well organized Data, easier to modify
2. Number of Cells Referenced 3. Number of Cell
A Spreadsheet with well-organized Data is easier to change and to remove faulty parts. On the other side if the Spreadsheet has a great number of Cells or Cells Referenced is harder to change.
• Stability: Capacity to be stable 1. Number of Complex Formulas
2. Number of Cells been referenced (Directly or indirectly) by many other Cells. A Spreadsheet lose stability if it has a big number of Cells been referenced by other Cells, since changing that first Cell can make spread errors all over the Spreadsheet. It also lose stability if it has many Complex Formulas, since changing just one Cell from the many referenced by the complex Formula can change the Formula result in to a wrong one.
• Testability: How well can the SpreadSheet be tested 1. Number of Formulas
The important on Testing is to confirm that the result we have is the one expected, on Spreadsheets we need only to check the Output Cells, that can be Formula Cells or Data Cells, but those last ones are usually labels so we just need to test the Formula Cells. So bigger is the number of Formula Cells, harder it is to test the Spreadsheet.
2.2.6
Portability
The capacity to be transferred from one environment to another.
• Adaptability: how well can the spreadsheet be adapted to environmental change 1. The more Macros the spreadsheet have, harder may be the adaption
Since Macros aren’t compatible with all the environment or Spreadsheet applications, the higher number of Macros on a Spreadsheet less adaptable that Spreadsheet is.
16 CHAPTER 2. SPREADSHEET QUALITY MODEL • Instability: Capacity to be installed on a designed environment
Doesn’t Apply
Since a Spreadsheet doesn’t need installation, Instability doesn’t apply on our case. • Co-Existence: how well can a spreadsheet co-exist with other spreadsheets on the
same operational environment
Doesn’t Apply
Spreadsheets are individuals and do not interfere with each other, so there isn’t any issue about them co-existing on the operational environment
• Replaceability: How well this spreadsheet can replace another spreadsheet or part of it
Doesn’t Apply
Each Spreadsheet have his own Data Cells, Formulas, etc so a Spreadsheet can only replace another one if it has the same components of the original Spreadsheet. But on that case this Spreadsheet is nothing more than a copy\backup from the original one, and can’t be considered as a unique and independent Spreadsheet with an indepen-dent purpose. So Replaceability doesn’t apply on Spreadsheets, since a Spreadsheet can only replace another one been a copy.
2.3. QUANTIFICATION ALGORITHMS 17
2.3
Quantification Algorithms
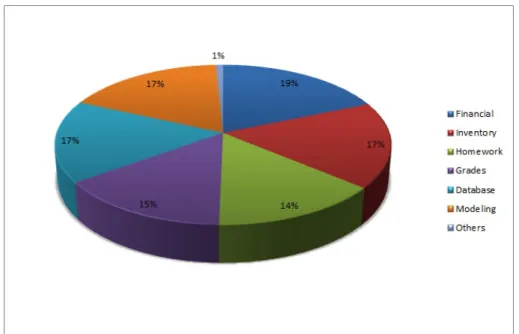
After defining the Quality Model we needed to define, based on the Metrics we had al-ready implemented, how to quantify each Characteristics and his Sub-Characteristics. And besides defining which metrics we needed to use for each one, we had also to study the “normal” values of the metrics on averages Spreadsheets. For that we used the EUSES consortium data Spreadsheet corpus, which is formed by 6 principle categories (Financial, Inventory, Homework, Grades, Database, Modeling) .
With more than 5600 real Spreadsheet files collected on the internet the corpus is a very good sample for our study and for the analysis of the metrics values. Not all those files were useful for our study or even suitable. We filtered the Bad and Duplicates files, and after that we kept only the Spreadsheet that didn’t fail on the SIG tool, having after all the filtering a total of 3658 files to analyze. Then we applied the metrics on the totally of the files, obtaining the same number of CSV files with the results. From those results, 3658 for each metrics, we could study their behavior and define the interval of value for each star rating. Having studying a such big sample as the EUSES consortium data Spreadsheet corpus, our interval values are defined on what we could expect as normal values on daily used Spreadsheets.
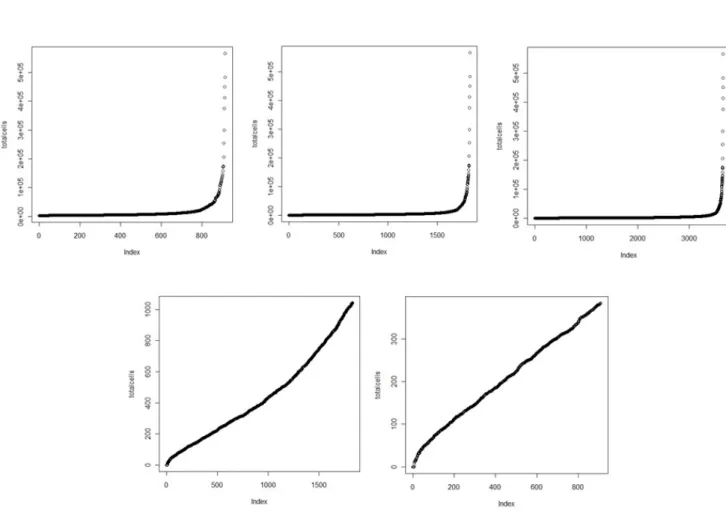
18 CHAPTER 2. SPREADSHEET QUALITY MODEL The rating used for our Quality Model is a 5-Stars range, representing 0 the lowest value, and 5 the higher value. The use of a 5-point scale can be found in many others fields. The Likert scale, used for questionaries’ in Social Science, is an example of that [5]. As told on the last paragraph, after applying the metrics in all the 3658 files, we had a good amount of measurements\results to be analyzed in order to define each range of the 5-stars. Various alternatives for aggregating measurements have been proposed: addition, central tendency measures, distribution parameter fitting, wealth inequality measures or custom formulae. In our particular case, central tendency using the median seemed to be the more suitable choice. The median have also been used to aggregates metrics by many other authors, for example Spinelli [11]. Using then the central tendency measures with the median, we aggregated the result in to our 5-stars range. Figure X presents the different graphics resulting of aggregating the Total Cells metric result’s .
2.3. QUANTIFICATION ALGORITHMS 19 The Spreadsheet showed on the next figure will be used as an example, to present the quantification of each metrics on this specific case and the respective rating. This example is one of the Spreadsheets available on the EUSES corpus.
Figure 2.5: Spreadsheet Example 2 - 02rise
2.3.1
Functionality
Example: With all his Sub-Characteristic having a 3 stars rating, the Spreadsheet example obtained a 3 stars rating on Functionality.
• Suitability
To quantify the suitability we count the number of incongruences
Table 2.1: Suitability 1
5 stars 4 stars 3 stars 2 stars 1 stars 0 stars [0,2] ]2,9] ]9,18] ]18,62] ]62,141] >141
20 CHAPTER 2. SPREADSHEET QUALITY MODEL
Table 2.2: Suitability 2
5 stars 4 stars 3 stars 2 stars 1 stars 0 stars [0,4] ]4,12] ]12,55] ]55,266] ]266,710] >710
The final qualification of the Suitability characteristic is given by the average number of star from these two methods.
Example: Our example Spreadsheet have 870 Blank Cells referenced on Formu-las, far more than the average number that is around 55, having because of that a rating of 0 stars on this metric. On the other side, the Spreadsheet doesn’t have other incongruences and obtain a 5 star rating on that metric. Even having a 0 rating star on the Blank Cells referenced on Formulas, since the Spreadsheet doesn’t have any more incongruence, we have a 2.5 star rating on Suitability, giving by the average rating of the 2 metrics.
• Accuracy:
To quantify Accuracy we count the number of incongruences Table 2.3: Accuracy 1
5 stars 4 stars 3 stars 2 stars 1 stars 0 stars [0,2] ]2,9] ]9,18] ]18,62] ]62,141] >141
And the number of Blank-Cells referenced on Formulas Table 2.4: Accuracy 2
5 stars 4 stars 3 stars 2 stars 1 stars 0 stars [0,4] ]4,12] ]12,55] ]55,266] ]266,710] >710
The final qualification of the Accuracy characteristic is given by the average number of star from these two methods.
Example: Since the Accuracy Sub-Characteristic have, for now, the same metrics as Suitability, we have the same 870 Blank Cells referenced on Formulas and 0 in-congruences as result of the metrics, giving us a rating of 0 and 5 stars respectively, with an average rating of 2.5 for Accuracy.
2.3. QUANTIFICATION ALGORITHMS 21 • Interoperability:
To quantify Interoperability we count the number of cells that have references Table 2.5: Interoperability 1
5 stars 4 stars 3 stars 2 stars 1 stars 0 stars [0,2] ]2,12] ]12,63] 63,187] ]187,416.5] >416.5
And the total of references
Table 2.6: Interoperability 2
5 stars 4 stars 3 stars 2 stars 1 stars 0 stars [0,33] ]33,80] ]80,304] ]304,1141] ]1141,2974] >2975
The final qualification of the Interoperability characteristic is given by the average number of star from these two methods.
Example: The example doesn’t have any cell referenced (Fan-Out metric), so it obtains a 5 stars rating on that metric. It also have 54 880 references, again a number way higher of the expected number of references on a Spreadsheet, that is around 304, obtaining a 0 stars rating. Since the rating of Interoperability is given by the average number of stars of the two metrics, we obtain a rating of 2.5 stars.
• Security:
At this moment, there isn’t any metric developed by our partners that allow us to quantify Security. The metrics that would be useful here would be the number of Protected Formulas and also the number of Protected Cells, allowing us to give the rating for this Sub-Characteristic.
2.3.2
Reliability
Example: The Reliability in our Spreadsheet example obtained a rating of 1 star, based on the average number of both his Sub-Characteristics.
• Maturity
To quantify maturity we count the difference between the number of Sheets the Spreadsheet have and the number of Sheets it use
22 CHAPTER 2. SPREADSHEET QUALITY MODEL
Table 2.7: Maturity 1
5 stars 4 stars 3 stars 2 stars 1 stars 0 stars
0 1 2 ]2,9] ]9,15] >15
And we also count every Blank Cell
Table 2.8: Maturity 2
5 stars 4 stars 3 stars 2 stars 1 stars 0 stars [0,8] ]8,60] ]60,320] ]320,1271.5] ]1271.5,3341] >3341
The final qualification of the Maturity characteristic is given by the average number of star from these two methods.
Example: This example have 4 Sheets, but only use 3, having for that a 4 stars rating on the number of used Sheets metric. It also has 2587 Blank Cells, a num-ber somehow a little higher that the average value on this metric, obtaining a 1 stars rating. The maturity Sub-Characteristic obtains then a 2.5 stars rating.
• Fault Tolerance
To quantify Fault Tolerance we count the number of references
Table 2.9: Fault Tolerance 1
5 stars 4 stars 3 stars 2 stars 1 stars 0 stars [0,33] ]33,80] ]80,304] ]304,1141] ]1141,2974] >2975
And we also count the number of Complex Formulas
Table 2.10: Fault Tolerance 2
5 stars 4 stars 3 stars 2 stars 1 stars 0 stars [0,1] ]1,4] ]4,18] ]18,66] ]66,162] >162
The final qualification of the Fault Tolerance characteristic is given by the average number of star from these two methods.
2.3. QUANTIFICATION ALGORITHMS 23 seen before, a number way higher than the expected, obtaining a 0 stars rating. And 164 Complex Formulas, also a number higher than the usual value expected, obtain-ing again a 0 stars ratobtain-ing. With 0 on both his metrics ratobtain-ing, Fault tolerance obtains also a 0 stars rating.
2.3.3
Usability
Example: With 3 of his 4 Sub-Characteristics obtaining a 0 stars rating, and the other one with a 5 stars rating, the Usability Characteristic on our Spreadsheet example obtains a 1 stars rating.
– Understanbility
To quantify understandibility we count the number of Cells
Table 2.11: Understanbility 1
5 stars 4 stars 3 stars 2 stars 1 stars 0 stars [0,208] ]208,385] ]385,1045] ]1045,2858] ]2858,5794] >5794
Example: There is a total of 18658 cells on our Spreadsheet example, when the average number is usually 1045, obtaining a 0 stars rating on Understanbility. – Learnability
To quantify learnability we count the number of Complex Formulas
Table 2.12: Learnability 1
5 stars 4 stars 3 stars 2 stars 1 stars 0 stars [0,1] ]1,4] ]4,18] ]18,66] ]66,162] >162
We also count the number of cell present on the Spreadsheet
Table 2.13: Learnability 2
5 stars 4 stars 3 stars 2 stars 1 stars 0 stars [0,208] ]208,385] ]385,1045] ]1045,2858] ]2858,5794] >5794
24 CHAPTER 2. SPREADSHEET QUALITY MODEL
Table 2.14: Learnability 3
5 stars 4 stars 3 stars 2 stars 1 stars 0 stars [0,33] ]33,80] ]80,304] ]304,1141] ]1141,2974] >2974
The final qualification of the Learnability characteristic is given by the average number of star from these three methods.
Example: As we saw before our example has 164 Complex Formulas, 18658 cells and 54880 references, obtaining a 0 stars rating on all those metrics, re-sulting on a 0 stars rating on Learnability.
– Operability To quantify Operability we count the number of Referenced Cells
Table 2.15: Operability 1
5 stars 4 stars 3 stars 2 stars 1 stars 0 stars [0,2] ]2,12] ]12,63] ]63,187] ]187,416.5] >416.5
Example: The Fan-Out metric returns 0 in the case of our Spreadsheet ex-ample, obtaining a 5 stars rating for both the metric and the Operability Sub-Characteristic.
– Attractiveness To quantify Attractiveness we count the number of Non-Blank Columns by used Sheet
Table 2.16: Attractiveness 1
5 stars 4 stars 3 stars 2 stars 1 stars 0 stars [0,3] ]3,5] ]5,8] ]8,12] ]12,18] >18
And also the number of Cells
Table 2.17: Attractiveness 2
5 stars 4 stars 3 stars 2 stars 1 stars 0 stars [0,208] ]208,385] ]385,1045] ]1045,2858] ]2858,5794] >5794
Example: The Attractiveness Sub-Characteristic depends on the number of Non-Blank Column per used Sheet, which on this case is 26, a number higher that the average on Spreadsheets that is 8. The result of this metric obtains then a 0 stars
2.3. QUANTIFICATION ALGORITHMS 25 rating. Beside that our example has 18658 cells, obtaining also a 0 stars rating on this metrics, and having both the metrics a 0 stars rating, Attractiveness obtains also a 0 stars rating
2.3.4
E
fficiency
Example: In our Spreadsheet example, Efficiency obtains a 0 stars rating, since both his Sub-Characteristics obtained a 0 stars rating too.
– Time Behavior
To quantify Time Behavior we count the number of Complex Formula on the Spreadsheet
Table 2.18: Time Behavior 1
5 stars 4 stars 3 stars 2 stars 1 stars 0 stars [0,1] ]1,4] ]4,18] ]18,66] ]66,162] >162
Example: The Spreadsheet example has an elevated number of Complex for-mulas, 164, obtaining a 0stars rating on both the metric and Time Behavior – Resources Utilization:
To quantify Resources Utilization we count the number of Non-Blank cell on the Spreadsheet
Table 2.19: Time Ressources Utilization 1
5 stars 4 stars 3 stars 2 stars 1 stars 0 stars [0,81] ]81,162] ]162,412] ]412,1125] ]1125,2196] >2196
And the number of Formulas
Table 2.20: Time Ressources Utilization 2 5 stars 4 stars 3 stars 2 stars 1 stars 0 stars
[0,1] ]1,4] ]4,18] ]18,66] ]66,162] >162
The final qualification of the Resource Utilisation characteristic is given by the average number of star from these two methods.
26 CHAPTER 2. SPREADSHEET QUALITY MODEL
Example: Our example have 16071 Non-Blank cells, a number quite higher than the expected on a Spreadsheet, obtaining for this reason a 0 stars rating. It also has 10316 Formula Cells, a number higher than expected too, obtaining the same 0 stars rating. With both the metrics obtaining 0 stars rating, Resources Utilization also obtain a 0 stars rating.
2.3.5
Maintainability
Example: Maintainability obtains a 1 stars rating on the Spreadsheet example since two of the Sub-Characteristics had a 0 stars rating, and the others two a 2.5 rating, which makes a 1.25 rating for Maintanability
• Analyzability
To quantify Analyzability we count the number of cell on the Spreadsheet
Table 2.21: Analyzability 1
5 stars 4 stars 3 stars 2 stars 1 stars 0 stars [0,208] ]208,385] ]385,1045] ]1045,2858] ]2858,5794] >5794
And we also count the number of Formulas
Table 2.22: Analyzability 2
5 stars 4 stars 3 stars 2 stars 1 stars 0 stars [0,1] ]1,4] ]4,18] ]18,66] ]66,162] >162
And finally we also count the number of references
Table 2.23: Analyzability 3
5 stars 4 stars 3 stars 2 stars 1 stars 0 stars [0,33] ]33,80] ]80,304] ]304,1141] ]1141,2974] >2974
The final qualification of the Anazybility characteristic is given by the average num-ber of star from these three methods.
2.3. QUANTIFICATION ALGORITHMS 27 Formulas and References. As we have seen before, those 3 metrics result on our ex-ample exceed by far the average values, obtaining all of them a 0 stars rating. For this reason, the Analyzability rating of our example is also 0 stars.
• Changeability To quantify Changeability we count the number of cell on the sheet Table 2.24: Changeability 1
5 stars 4 stars 3 stars 2 stars 1 stars 0 stars [0,208] ]208,385] ]385,1045] ]1045,2858] ]2858,5794] >5794
And also the number of Cells referenced
Table 2.25: Changeability 2
5 stars 4 stars 3 stars 2 stars 1 stars 0 stars [0,2] ]2,12] ]12,63] ]63,187] ]187,416.5] >416.5
The final qualification of the Changeability characteristic is given by the average num-ber of star from these two methods.
Example: Since the result of the Fan-Out metrics is 0, this metric obtains a 5 stars rating. Besides that, the Spreadsheet has 18658 Cells, which results on a 0 stars rating. The average result of this 2 metrics gives a 2.5 stars rating to Changeability.
• Stability: Capacity to be stable
To quantify Stability we count the number of Complex Formulas on the Spreadsheet Table 2.26: Stability 1
5 stars 4 stars 3 stars 2 stars 1 stars 0 stars [0,1] ]1,4] ]4,18] ]18,66] ]66,162] >162
And we also count the number of Cells referenced Table 2.27: Stability 2
5 stars 4 stars 3 stars 2 stars 1 stars 0 stars [0,2] ]2,12] ]12,63] ]63,187] ]187,416.5] >416.5
The final qualification of the Stability characteristic is given by the average number of star from these two methods.
28 CHAPTER 2. SPREADSHEET QUALITY MODEL
Example: As we shown on the last Sub-Characteristic the result of the Fan-Out metric is a 5 stars rating, that with the 0 stars rating obtaining from the number of Complex Formulas, makes Stability obtains a 2.5 stars rating.
• Testability
To quantify testability we count the number of Formulas on the Spreadsheet
Table 2.28: Testability 1
5 stars 4 stars 3 stars 2 stars 1 stars 0 stars [0,5] ]5,16] ]16,65] ]65,235] ]235,540] >540
Example: Depending only on the number of Complex Formulas, which are 163 in our example, Testability obtains a 0 stars rating.
2.3.6
Portability
The capacity to be transferred from one environment to another.
• Adaptability
At this time there isn’t metrics from our SSaaPP partners that allow us to count the number of Macros on a Spreadsheet, so we can’t quantify the Adaptability Sub-Characteristic and the Portability Sub-Characteristic yet.
The next figure is the result of applying our Quality Model on the example Spreadsheet, in our Web Application (See Chapter 4).
2.3. QUANTIFICATION ALGORITHMS 29
Chapter 3
Evaluation
Summary
In this Chapter we applied our Spreadsheet Quality Model 5 Spreadsheet files from each categories of the Euses repository, using the tool describer on the next chapter. Then we analyze and explain the results obtained.
As explained earlier the EUSES repository has 6 principal categories (Financial, Inventory, Homework, Grades, Database, Modeling), each of them is a unique type of Spreadsheet, suitable for his own purpose and more than 5600 files. Using the Spreadsheet Quality Model defined on Chapter 2, and the Web application described on the next Chapter, we analyze the 3658 Spreadsheets from the repository, that didn’t fail on SIG metric tool. The complete results are available on the SSaaPP project website, but on this chapter we have the result of 5 Spreadsheets for each category, with the results of the metrics and the star rating.
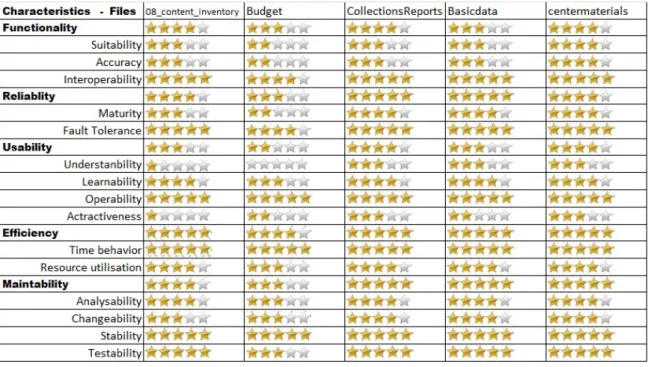
3.1
Database
For the Database sample, the files chosen were: “08_content_inventory”, “Budget”, “Col-lectionsReports”,” Basicdata” and “centermaterials”.
32 CHAPTER 3. EVALUATION
Figure 3.1: Results of Metrics for the Database Categorie
Figure 3.2: Results of the Quality Model for the Database Categorie
While “CollectionsReports”, “Basicadata” and “centermaterials” have an average num-ber of Cells, “Budget” and “08_content_inventory” have a high numnum-ber of cells, but most them are Blank-Cells, with only an average amount of data, obtaining low ratings on Un-derstanbility and Attractiveness. Only “Budget” has both formulas and references. For this reason, the other 4 files have 5-stars ratings on Testability, Interoperability and Fault Tol-erance. Since any of those files have Fan-out references or Complex formulas, all of them
3.2. MODELING 33 have obtaining 5-stars rating on Stability, Time Behavior and Operability.
3.2
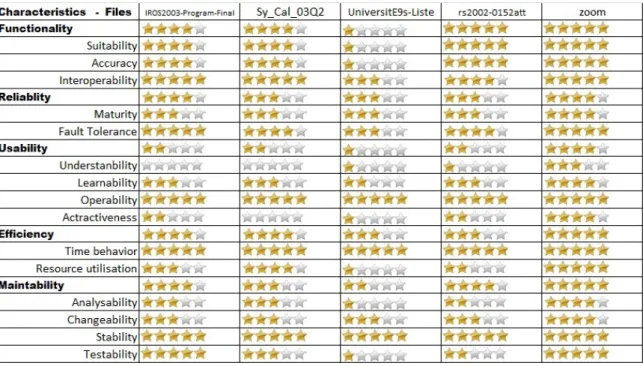
Modeling
The chosen files for the Modeling sample were:” IROS2003-Program-Final”,” Sy_Cal_-03Q2”, “UniversitE9s-Liste”,” rs2002-0152att” and “Zoom”.
Figure 3.3: Results of Metrics for the Modeling Categorie
34 CHAPTER 3. EVALUATION All the modeling examples, less Zoom, have a great number of Cells, with most of them been Blank-Cells, obtaining for this reason low ratings on Understanbility and At-tractiveness. The “Zoom” file in the other hand, having an average number of Cells and Non-Blank Cells obtains ratings of 3 and 4 stars on those Sub-Characteristics. Even having a great number of Blank-Cells, since all of the examples use all their Sheets, they still obtain 3-stars rating (4 on the case of “Zoom”) on Maturity. “UniversitE9s-Liste” and” rs2002-0152att” also have a great number of formulas and references, especially “UniversitE9s-Liste”, that makes them having low ratings on Resource Utilization, Analyzability and Testability. “UniversitE9s-Liste” also has much incongruence and Blank-Cells referenced in Formulas, leading to 1-stars rating on Suitability and Accuracy. Since any of those files have Fan-out references or Complex formulas, all of them have obtaining 5-stars rating on Stability, Time Behavior and Operability.
3.3
Grades
The Grades examples chosen are:” BoundariesbySt-Schcolor”,” 2000_places_School”, “abet-SampleGrades”,” 0Fall00Eval” and “dss-2001”.
3.4. FINANCIAL 35
Figure 3.6: Results of the Quality Model for the Grades Categorie
The” BoundariesbySt-Schcolor” example obtained 5-stars rating in almost every Sub-characteristic, showing that it is a file with some quality. This Spreadsheet only loses some quality since it doesn’t use all his Sheets (3-Stars in Maturity), has a number of Cells a little higher than the average (2-stars on Understanbility, 3-stars on Attractiveness and 4-stars on Analyzability and Changeability). The” 0Fall00Eval” has 187 Fan-Out references having a 2-Stars rating on Operability and Interoperability, and a 3-stars rating on Changeability for this reason. All those examples files beside” BoundariesbySt-Schcolor”, obtained low rating on Attractiveness since they had high number of cells and of Non-Blank-columns per Used-Sheet.
3.4
Financial
For the Financial sample we chose the following files:” MMMFinancialHistory”,” 02rise”, “WebFinancials2002”,” financial-greece_el” and “yrend-03”.
36 CHAPTER 3. EVALUATION
Figure 3.7: Results of Metrics for the Financial Categorie
Figure 3.8: Results of the Quality Model for the Financial Categorie
Since any of these files have Fan-Out they all obtain 5-stars rating on Operability, and beside “02rise” neither of them has Complex Formulas obtaining 5-stars ratings on Time Behavior and Stability. The” financial-greece_el” is also a file with some quality, obtaining 5-stars on almost every Sub-Characteristic, only losing some rating because of the high number of Blank-Cells and of Non-Blank-Columns per Used-Sheet. The” 02rise” file was analyzed on the last chapter, so no need to describe it again.
3.5. HOMEWORK 37
3.5
Homework
On the Homework category we chose these files:” 2101_Homework”,” 2003survey-results”, “AClassSchedule2003”,” EvaluationSpring04” and “Fin_Eval-Budgets-Web”.
Figure 3.9: Results of Metrics for the Homework Categorie
Figure 3.10: Results of the Quality Model for the Homework Categorie
First we will talk about the” 2101_Homework” Spreadsheet file. This file obtained 5-stars rating on every single Characteristic and Sub-Characteristic of our Quality Model.
38 CHAPTER 3. EVALUATION That doesn’t mean that it is a perfect example of a what Spreadsheet should be, but since it is a Spreadsheet with a small number of Cells (only 4 of them been Blank-Cells), with no formulas, incongruences or references, organized in only one Sheet with a few Columns, we can infer that this is a small but well organized Spreadsheet file with any errors, been the reason that it achieved a high rating in our model. For the rest of the files, we can see that they have none or only a few Formulas Cells and none Complex Formulas, obtaining good ratings in Time Behavior, Resource Utilization, Stability and Testability. But since the last 2 examples files have a great number of References, they lose some rating in Interoperability, Fault Tolerance, Learnability and Analyzability. Since any of those files have Fan-out references, all of them have obtaining 5-stars rating on Operability.
3.6
Inventory
For the last category the examples are:” InsuranceApplication”,” 2003-fairact”, “Licensing Inventory”,” Management__Plan_Sect” and “PrimaryProduction2003”.
3.6. INVENTORY 39
Figure 3.12: Results of the Quality Model for the Inventory Categorie
Since any of the files on this Inventory sample have Fan-out references or Complex for-mulas, all of them have obtaining 5-stars rating on Stability, Time Behavior and Operabil-ity. They also have all of them, a small amount of References and Blank Cells referenced in Formulas, obtaining good ratings on Functionality, especially “PrimaryProduction2003” that doesn’t have any, obtaining 5-stars rating in all Functionality Sub-Characteristic’s. And since any of them have, as told before, Complex Formulas, and with the small amount of References, all the samples achieve very good ratings on Fault Tolerance. On the other hand, all the samples files less “Licensing Inventory”, obtained low values on Understan-bility and Attractiveness due to their great number of Cells and of Non-Blank-Columns per Used-Sheet.
Chapter 4
Web Application
Summary
In this Chapter we present our Web Application, created to access Google Docs Spreadsheets and to apply it our Spreadsheet Quality Model. We will first talk about the technologies choose, and the connection with Google Docs. After that we will talk about the Ochiai Algorithm and how it is use in our Web Applica-tion. Finally we will explain how we apply the Quality Model and how are the results presented.
There is been a long debate about web applications replacing software applications [3]. Even if some functions are better suited for Web application, desktop applications wont became obsolete because of some concerns as security or performance.
But still, the advantages of Web applications are many like: never installed, browser based software doesn’t need installation or hard drive space; available anywhere and anytime, if there is an internet connection available; data is stored remotely; cross-platform compat-ibility; client computer is better protected against virus; enables social possibilities, like sharing in real-time our work.
So it was natural that some big company like Microsoft and Google launch at Web-based office suite (Microsoft Office Live and Google Docs respectively), since the possibility of accessing their files anywhere was a big advantage for the users, who can also store online theirs files and share them. Like it was told before, even if desktop applications (for ex-ample Microsoft Office) wont became obsolete, we can say that the Web-based versions of
42 CHAPTER 4. WEB APPLICATION office suite are the future.
In that line of thinking, we choose to create a Web application that would allow the user to login on his Google Docs account, so he could choose one of his spreadsheet files to be analyzed by our application and then give some information and feedback about the quality of the spreadsheet file, to the user. We chose Google Docs because of it compatibility with both GWT and Android SDK (also from Google) technologies.
The objectives of the Web Applications were to allow Google Docs users to analyze and check the quality of their spreadsheet anywhere and at any time, since both services are online. The analysis is made based on our model of quality for spreadsheets, using metrics developed by SSaaPP project partners SIG and MSc student Hugo Ribeiro.
For the GUI (Graphical User Interface) of the application, we used the GWT Designer, which is a powerful and easy way to use Java GUI designer. The GWT Designer allows us to create complicated windows in minutes, using and drag-and-drop approach on the widgets with want to use.
4.1
Connection with Google Docs
As it was told before, our primary objective was to allow the user from our Web Applica-tion to login and access to his Google Docs account and retrieve the list of his spreadsheets. Google have its own library which allow to use any of their API needed, in our case since we only want to manipulate the spreadsheets file, the Spreadsheet API was the only one we used.
The Google Data Client Library (and his Spreadsheet API) is compatible with GWT, but since all the code on the server side is compiled to JavaScript which it isn’t compatible with the Google Data Client Library, we can only work with library on the server side (that is not compiled to JavaScript). The communications between client and server sides are handling by RPC.
We create a simple interface to allow the user to login on his account, with the window only showing a message informing him that the application needs his credentials to access
4.1. CONNECTION WITH GOOGLE DOCS 43 his Google Docs account, two textboxes to write his Google ID and Password, and Button “Login” that call the login function.
Figure 4.1: Login Interface from the Web Application
Since we can only work with the Google Spreadsheet API on the server side, so on the client side we only handle to get both the Google ID and Password from the respective textboxes and pass them to the server side, and to do that we need to create a RPC service. For that we need first to create the service’s client-side interface Sessoes. The interface must extend the GWT RemoteServiceinterface and contain the signatures of the service methods that should be exposed to the client. Method parameters and return types must be serializable. A client-side asynchronous interface, based on the synchronous interface, must also be built before a service call can be made. The nature of asynchronous method calls requires the caller to pass in a callback object (AsyncCallback).
This callback object is used to notify the caller when an asynchronous call completes. Asynchronous methods cannot have return types, and so they must always return void. After an asynchronous call is made, all communication back to the caller is via the passed-in callback object.A service’s asynchronous passed-interface must be passed-in the same package and
44 CHAPTER 4. WEB APPLICATION have the same name, but with the suffix “Async”. So since our service interface is called “com.mycompany.project.client.Sessoes”,the asynchronous interface must be called
“com.mycompany.project.client.SessoesAsync”. An asynchronous “sibling” method should be defined for each method in your service’s synchronous interface. The method signature for these asynchronous sibling methods is the same as the synchronous methods signature, but with the addition of an asynchronous callback.
So using the RPC service we pass the user information (Google Id and Password) to the serve side to the function “login” that creates a Spreadsheets service, and the use this in-formation set the user credentials. With that, our application is allowed to access the user Google Spreadsheet account. The login function also get a feed containing a list of the cur-rently authenticated user’s spreadsheets, and from this feed we pass to a Arraylist of Strings the titles of all the user’s spreadsheets. This Arraylist is send back by the RPC service to the function (on the client side) that had called the login function.
Figure 4.2: List of Spreadsheets from the Web Application
At this moment our application presents another interface to the user, in which all the data will be presented and where the user can make his choices. The List of all his Spread-sheets are presented on a ListBox widget, where each one can be chosen. When one of the Spreadsheets is chosen from the list, a new RPC call is created that call the “getSheets” function on the server side. The Client side passes an integer, the index of the chosen Spreadsheet, with that index the function retrieve the Entry from the Spreadsheet. With
4.2. OCHIAI ALGORITHM 45 that the function gets a list of Worksheets entries, and gets the titles of all those Worksheets to an ArrayList that is send back by the RPC.
The list of Worksheets is then presented in another ListBox Widget, allowing the user to choose which Worksheet he wants to use.
Figure 4.3: List of Worksheets from the Web Application
4.2
Ochiai Algorithm
The Ochiai Algorithm used on this Web Application was developed by Rui Maranhão and André Riboira, and is based on the Ochiai similarity coefficient, taken from the molecular biology domain and introduced by Rui Maranhão in the context of fault localization [1]. This approach was used before on Software fault diagnosis, and was converted to be used on Spreadsheet by André Riboira. On this part we explain how we apply the Ochiai Algo-rithm on the Google Docs Spreadsheets.
The Ochiai Algorithm needs to receive two arguments, a matrix of Boolean where each row represent one output cell, and the column the cells that it use on his calculation (True for the ones used); and an array of Boolean with the cells that are faulty\wrong.It returns an array with the failing probability of each cell from the Spreadsheet.
46 CHAPTER 4. WEB APPLICATION
For helping on the calculation of the matrix, we created the Class “Celula”, where an object represents a Cell, with the Row and Column information of the Cell.
The RPC call from the client-side give to the “convmat” function the index of the work-sheet in which the user wants to apply the Ochiai Algorithm. From the Workwork-sheet Entry we can get a CellFeed. In a cell-based feed, each entry represents a single CellEntry, and eachCellEntryin the feed is a single cell. For the calculation of the needed matrix we first needed to find both all the singles Output cells, but also the cells that had formulas.
For that, a function “isFormula” was created to check if each cell were a formula creat-ing an ArrayList of “Celula” object with all the formulas. From all the formula we could have all the referenced cells that we would later use to see which ones are output cells. But since if we have, in our Spreadsheet a Cell A6 that have a formula “=SUM(B1,B2,B3)”, we get from the CellEntry “SUM(R[-5]C[1], R[-4]C[1], R[-3]C[1])” that have the coordi-nates of the referenced cell, from the position of the cell that have the formula, we needed to create some kind of parser that would give us the cells referenced in form of “Celula” object. The function “listCell” was our parser function that has as argument a string with the formula, and two integers that are the coordinates of the cell and return an arraylist of “Celula” object.
Having for each cell with a formula, all his referenced cells, adding then with the ones from the others cell with formula we get all the referenced cells. With all the referenced cells, we could filter from the original arraylist that had all the cells from the Worksheet, which ones aren’t on the referenced arraylist being output cells.
Then the function “calcMat” will create the matrix. For all the formula cell, the func-tion will do a breathfirst search on his referenced cells, so we can have all cells from who this formula cell depends on (for example, the formula used earlier SUM(B1,B2,B3), that referenced B1, if B1 itself is a formula like (=A4-A2), A4 and A2 are also cells that A6 depends on, so we need to have them also in the list of cells referenced by A6). So for each formula cell, on the matrix, all his referenced cell will be as “True” and the others ones as “False”. For the others output cells, that are simple cells, only themselves are at “True” and all the other ones as “False”. The results are presented on a TextArea.
4.3. SPREADSHEET QUALITY MODEL 47
Figure 4.4: Result of the Ochiai Algorithm
4.3
Spreadsheet Quality Model
Having our Spreadsheet Quality Model defined, we used the Metric results to apply our Star rating grading needed on the Google Docs Spreadsheets. Since Our SSaaPP partner SIG, use their metrics on POI objects (see further) we had a function that create the respec-tive POI object from the original Google Docs Spreadsheet so we could use the metrics. Those metrics are then applied to our POI object giving the results on the form of a CSV files.
We created a function on the server side, verInc(), that works as a parser, reading the data on the CSV file and transforming the values of the metrics we need into floats, and adding them to a ArrayList that is returned to the client side at the end of the function.
48 CHAPTER 4. WEB APPLICATION Then a new Class was created, QualityCal, which is instanced with the float Arraylist that contains the metrics values, with all the methods for calculating the star rating of each Characteristic and Sub-Characteristic of the Spreadsheet Quality Model. Since the star rat-ing widget used only allow Integer values, each method returns floats and those values are converted to an Integer only on the last level, giving us a better precision. For example for calculating the rating of Reliability, we first need to calculate the values of both Ma-turity and Fault tolerance. We keep both of their results as float to calculate the value of Reliability and just at this moment, we convert it to Integer and his respective value on rating. This approach can create some difference between the average number of the Sub-Characteristics stars and the number of stars of the Characteristic. On the example given before, if Maturity have a 2.5 value, it would have a 3 star rating, and Fault Tolerance with a 3.5 value would have a 4 star rating. So if we would use those converted values to calcu-lated Reliability it would give us a value of 3.5 with a 4 star rating. Keeping the float values of the two Sub-Characteristics gives us a value of 3 and a 3 star rating for Reliability, been more accurate but having some discrepancy between the number of stars.
Each calculation method take the metrics results it needs from the Arraylist, and then as de-fined in our model it calculates the rating of each metrics, and after the calculation of all the ratings, the method returns the rating value of that Characteristics or Sub-Characteristics.
On the Presentation level, the user can choose to analyze a Spreadsheet by clicking on the “Analyze” button, this action make appears a list with all the Characteristics (Function-ality, Reliability, Usability, Efficiency, Maintainability and Portability) and their respective star rating, calculated as told on the last paragraph. At this moment the user can have a general analyze of his Spreadsheet Quality, with which Characteristics are already good and which ones needs some improvements. For more detailed information the user can click on each one of the Characteristics making appears the respective Sub-Characteristics with their star ratings.