Mário Jorge Faria Barroca
outubro de 2013
Optimisation of the fed-batch production
of a silk-elastin-like protein: overcoming
acetate accumulation and plasmid instability
UMinho|20 13 Mário Jor ge F aria Barr oca Op timisation of t
he fed-batch production of a silk-elastin-lik
e protein:
overcoming acet
ate accumulation and plasmid inst
ability
Universidade do Minho
Mário Jorge Faria Barroca
outubro de 2013
Dissertação de Mestrado
Mestrado em Biofísica e Bionanossistemas
Optimisation of the fed-batch production
of a silk-elastin-like protein: overcoming
acetate accumulation and plasmid instability
Universidade do Minho
Escola de Ciências
Trabalho realizado sob a orientação do
James Anthony Collins
(Investigador Auxiliar, Universidade do Minho)
e da
Margarida Casal
iii
Acknowledgments/Agradecimentos
À generalidade dos professores do Mestrado em Biofísica e Bionanossistemas; pelos saberes e competências que em mim desenvolveram, pelas reflexões que me proporcionaram.
Em particular, ao Doutor Tony Collins e à Professora Doutora Margarida Casal, por me terem aceite como orientando, pelos sábios ensinamentos científicos e pedagógicos durante o desenvolvimento do projecto de investigação e escrita desta dissertação, mas também pelo estímulo, compreensão e amizade demonstradas. Obrigado!!
Um agradecimento muito especial aos meus companheiros do LBM, Raul, Margarida, João, Joana, André, Telma, Pedro, por todo tempo dedicado, paciência, sabedoria, respeito, vícios, e sobretudo a grande amizade que fizemos ao longo deste ano. Tornaram tudo muito mais fácil.
Um muito Obrigado!!!
A todos os meus colegas de mestrado, em especial, Rogério, David, Ana Luísa, Pedro, Diana, Filipa, Filipa Gonçalves, um agradecimento pelo companheirismo e força que proporcionaram.
Agradeço a todos os técnicos do departamento que foram sempre profissionais e ajudaram bastante na realização do trabalho, principalmente a D. Isabel, a Manuela Rodrigues e a Magda Graça por animarem me atenderem sempre que precisava, mesmo quando não precisavam de o fazer. Um sincero Obrigado!! Agradeço a todos os meus amigos que me aturaram durante este ano, principalmente a minha grandes amigas Nádia e Rosa Maria, que me deram forças e paciência para a realização desta tese, assim como pelos momentos divertidos que me fizeram viver, como boas amigas que são
Por último, mas sempre em primeiro, um agradecimento muito especial e muito sentido ao Serafim, à Manuela e ao Gonçalo pelas atenções que lhes devia e que este trabalho lhes tomou, assim como todo o amor e dedicação que deram a este filho. Sem eles nada era possível. Obrigado do fundo do coração!!!!!
v
Abstract
Silk-elastin-like proteins (SELPs) are protein based polymers composed of repetitive amino acid sequence motifs, or variants thereof, found in silk fibroin (GAGAGS) and mammalian elastin (VPGVG). These polymers have a high potential for use in the pharmaceutical, regenerative medicine and materials fields. The successful employment of these polymers in these different areas requires that they can be simply prepared in large quantities on an industrial scale. The present study attempted to increase the production levels of a novel recently described SELP (SELP-59-A) in E. coli.
Prior to the present study, the highest reported production level for SELPs was 500 mg/L in E. coli BL21(DE3) with an optimised batch fermentation in shake flasks approach1. It was shown that SELP production was limited with this
approach by the accumulation of acetic acid to toxic levels as well as by plasmid loss on induction. In an attempt to overcome these limitations, the use of a fed-batch production approach and of various plasmid stabilisation systems were investigated in the present study. A fed-batch approach was developed and optimised for the successful high cell density production of SELP-59-A. Pre- (0.4 h-1) and post-induction (0.1 h-1) growth rates, dissolved oxygen concentration
(15 %), dry cell weight (DCW) on induction (75 g/L) and IPTG concentration for induction (1 mM IPTG) were optimised and allowed for an almost 9-fold increase in SELP-59-A production. This allowed for a reduced cost process with a fed-batch phase of approximately 8 hours. Limiting factors identified were plasmid loss on induction, limitations in the oxygen transfer efficiency of the fermentation instrumentation used and an increased metabolic stress on the host cells following induction. Investigation of ampicillin resistance, kanamycin resistance and a Type II toxin/antitoxin post segregational suicide system (ccdB/ccdA) for reduced plasmid loss indicated the latter to allow for improved plasmid stability and a 50 % increase in SELP-59-A production under the conditions used. Removal or inactivation of the ampicillin resistance marker from the expression vector did not affect production but allows for the production of SELPs for use in biomedical applications. The SELP production levels reported here are the highest to date and represent a 10-fold increase on that previously reported.
vii
Resumo
As proteínas do tipo seda-elastina (SELPs) são uma nova classe de polímeros recombinantes de origem proteica, cuja composição consiste na combinação das sequências repetitivas de aminoácidos comummente encontradas nas proteínas naturais, fibroína (GAGAGS) e elastina (VPGVG). Estes polímeros têm um elevado potencial de aplicação nas áreas de medicina regenerativa, farmacêutica e materiais. Todavia, para que a sua aplicação seja bem sucedida, surge a necessidade de serem facilmente produzidos em larga escala. Como objetivo principal deste estudo, pretendeu-se aumentar os níveis de produção de uma SELP em E. coli. Até à data, o nível de produtividade volumétrica mais elevado descrito para SELPs foi de 500 mg/L, obtido em E. coli, e em condições otimizadas de fermentação em matrazes. Foi demonstrado que a produção de SELP era limitada não só devido à acumulação de ácido acético, conduzindo a níveis tóxicos para a célula, mas também devido à perda de plasmídeo pela indução. No âmbito desta tese e numa tentativa de ultrapassar estas limitações, recorreu-se a uma abordagem de produção em fed-batch, assim como a vários sistemas de estabilização de plasmídeo. Assim, foi desenvolvido e otimizado um processo de fed-batch, o qual demonstrou resultar na produção de SELP-59-A em culturas de elevada densidade celular. Com parâmetros otimizados tais como taxas de crescimento de pré- (0.4 h-1) e pós- indução (0.1h-1), concentração de oxigénio dissolvido (15%) e, indução com IPTG (1 mM IPTG, a um peso seco celular de 75 g/L), permitiu um aumento de quase 9 vezes em relação à produção volumétrica previamente descrita. Isto permitiu obter um processo de custo reduzido com uma fase de fed-batch de cerca de 8 horas. Como fatores limitantes, foram identificados: a perda de plasmídeo na indução, limitações na eficiência da transferência de oxigénio pelo equipamento utilizado e um aumento do stress metabólico nas células hospedeiras após indução. Os estudos de resistência à ampicilina, canamicina e um sistema toxina/antitoxina do tipo II (ccdB/ccdA), foram utilizados para reduzir a perda de plasmídeo, resultando num aumento da estabilidade do plasmídeo e por conseguinte num aumento de 50 % na produção de SELP-59-A. Os níveis de produção SELP relatados neste estudo são os mais altos descritos até hoje, representando um aumento de cerca de 10 vezes maior do que descrito na literatura.
ix
Index
Acknowledgments/Agradecimentos --- iii Abstract --- v Resumo --- vii Index --- ix Abbreviations list --- xiList of figures --- xiii
List of tables --- xv 1. Introduction --- 1 1.1. Polymers --- 3 1.1.1. Protein-Based Polymers --- 3 1.2. Fibrous Proteins --- 5 1.2.1. Elastin --- 7 1.2.2. Elastin-like Polymers --- 8 1.2.3. Silk --- 9 1.2.4. Silk-Elastin-like Proteins --- 10 1.3. Background --- 12 1.4. Objectives --- 18
2. Materials and Methods --- 19
2.1. Optimisation of the fed-batch process --- 21
2.1.1. Fed-Batch Production of SELP-59-A --- 21
2.1.2. Effect of growth rate on fed-batch process --- 25
2.1.3. Optimisation of post-induction growth rate --- 25
2.1.4. Optimisation of pre-induction growth rate --- 26
2.1.5. Optimisation of dissolved oxygen concentration --- 27
2.1.6. Optimisation of the dry cell weight at induction --- 28
2.1.7. Optimisation of IPTG concentration --- 29
x
2.2.1. Plasmid Isolation --- 33
2.2.2. Plasmid Quantification --- 33
2.2.3. Restriction Digestion --- 33
2.2.4. Fragment Purification --- 35
2.2.5. Preparing blunt-ended fragments --- 36
2.2.6. Fragment Ligation --- 36
2.2.7. Transformation --- 36
2.2.8. Confirmation of Constructs--- 37
2.2.9. Fed-Batch Production --- 37
3. Results and Discussion --- 39
3.1. Optimisation of Fed-batch Process --- 41
3.1.1. Effect of growth rate on fed-batch process --- 41
3.1.2. Optimisation of post-induction growth rate --- 47
3.1.3. Optimisation of pre-induction growth rate --- 50
3.1.4. Optimisation of dissolved oxygen concentration --- 51
3.1.5. Optimisation of dry cell weight at induction --- 51
3.1.6. Optimisation of IPTG concentration --- 53
3.2. Overcoming Plasmid Instability --- 54
4. Final Remarks and Future Perspectives --- 57
5. References --- 63
xi
Abbreviations list
Δbla – Ampicillin resistance gene Δblap – Ampicillin resistance promoter ampR – Ampicillin resistance
kDa – Kilo Dalton DCW – Dry Cell Weight DNA – Deoxyribonucleic acid dO2 – Dissolved oxygen
g – Gram h – Hour
HPLC – High performance liquid chromatography IPTG – Isopropyl β-D-1-thiogalactopyranoside ITT – Inverse temperature transition
kanR – Kanamycin resistance
L – Litre
LB – Lysogeny broth M – Molar
min – Minute
mRNA – Messenger ribonucleic acid NBS – New Brunswick Scientific nm – Nanometers
ºC – Degrees Celsius OD – Optical density
PBP - Protein Based Polymer PCR – Polymerase chain reaction qPCR – quantitative PCR
RNA – Ribonucleic acid rpm – Revolutions per minute SDS – Sodium dodecyl sulfate SELP – Silk-Elastin-like Polymer TCA – Tricarboxylic acid
w – Weight
xiii
List of figures
Figure 1. An overview of the process for protein based polymer synthesis via protein engineering ... 4
Figure 2. Illustration of stretch and relax state of elastin ... 8
Figure 3. Illustration of Silk structure ... 10
Figure 4. Schematic representation of silk-elastin-like protein (SELP-59-A) used in this study ... 12
Figure 5. Representation of E. coli BL21(DE3)/pET expression system ... ... 17
Figure 7. Schematic illustration of the approach used for preparation of
SELP 59 A/pStaby ... 34
Figure 8. Schematic illustration of the approach used for preparation of
SELP 59 A/pStaby Δblap and SELP-59-A/pStaby Δbla ... 35
Figure 9. Variations in control parameters during the fed-batch process with pre- and post-induction growth rates of 0.2 h-1 ...
Figure 10. Monitoring of process parameters during the fed-batch phase of production. Results for pre- and post-induction growth rates of 0.2 h-1 ...
Figure 11. SDS-Page analysis of intracellular production at 0, 1, 2, 3 and 4 hours of IPTG induction of fed-batch production with pre- and post-growth rates of 0.2 h-1 ...
Figure 12. Principal results obtained for fed-batch productions with pre- and post-induction growth rates of 0.2, 0.4 and 0.6 h-1 ...
Figure 13. Principal results obtained for fed-batch productions with a pre-induction growth rate of 0.2 h-1 and 0.6 h-1 and post induction growth rates 0.0 to
0.6 h-1 ...
Figure 14. Principal results obtained for fed-batch productions with pre induction growth rates of 0.2, 0.4, 0.6 and 0.8 h-1 and a post induction growth rate of
0.1 h-1 ...
13
Figure 6. Representation of pStaby Express toxin/antitoxin system
42 44 4 46 4 47 49 51
xiv
Figure 15. Principal results obtained for fed-batch productions with induction at dry cell weights of 50, 75 and 100 g/L ... Figure 16. Principal results obtained for fed-batch productions with 1, 3 and 6 mM IPTG for induction ... Figure 17. Principal results obtained for fed-batch productions the various vector constructs investigated ...
52
53
xv
List of tables
Table 1. Repeat motifs and crosslinking mechanisms for elastomeric proteins ... 6 Table 2. Mechanical properties of natural and synthetic fibres ... 7 Table 3. Conditions used for optimisation of the growth rate ... 25 Table 4. Conditions used for optimisation of the post-induction growth rate .... 26 Table 5. Conditions used for optimisation of the pre-induction growth rate ... 27 Table 6. Conditions used for optimisation of the dissolved oxygen concentration ... 28 Table 7. Conditions used for optimisation of the dry cell weight at induction .... 28 Table 8. Conditions used for optimisation of the IPTG concentration for induction ... 29 Table 9. Details of plasmids used in this study ... 31 Table 10. Details of E. coli strains used in this study ... 32
3
1.1.
Polymers
Polymers (poly – many, meros – parts) are naturally occurring or synthetic compounds made up of a large number of linked repeating structural subunits. The relatively simple basic subunits, known as monomers, are joined together (typically by covalent bonds) to form oligomers of varying sizes (dimers, trimers etc.) and eventually, through a large number of repeats, give rise to polymers. Polymers typically have molecular weights greater than 5000 g/mole, thereby allowing for chain entanglement, and can consist of up to millions of repeated units per polymer chain2.3.
1.1.1. Protein-Based Polymers
Protein-based polymers (PBPs), composed of repeating units of amino acids, have recently emerged as a promising new class of bioinspired materials. The repetitive amino acid motifs of these biopolymers are typically based on naturally occurring proteins and in particular on repetitive motifs found in naturally occurring fibrous or elastomeric proteins such as silk, elastin and resilin. These natural proteins serve functional, protective and structural purposes in nature and are typically characterized by remarkable physical, mechanical and biological properties with, in particular, a high strength and stability being often noted3.4.5.
PBPs, designed to display similar or improved properties to these, are of much interest from both a fundamental and applied point of view, and find potential application in biomedicine, pharmaceuticals, nanotechnology and as materials. They can be processed into fibres, films, nanoparticles and/or hydrogels and offer many advantages over conventional petroleum-based polymers, including being more environmentally friendly, renewable and biocompatible. Furthermore, they can be prepared by use of recombinant DNA technology which, in contrast to conventional synthetic polymers that tend to be produced as a polydispersed population, allows for the production of monodispersed PBPs in which the sequence, composition and length is strictly controlled. Here, the gene encoding
4
the protein based polymer of interest is introduced into a suitable host whereupon the protein producing machinery (i.e. transcription, translation and folding machinery) of this host is utilised to produce the polymer6.7.8.
Figure 1. An overview of the process for protein based polymer synthesis via protein engineering5.
The basic principle of PBP synthesis via recombinant DNA technology is illustrated in Figure 1. Amino acid sequences are designed to create specific folding patterns and desired new material properties, with the design being generally based on naturally occurring fibrous proteins found in nature but with novel designs being also possible. Indeed, use of protein engineering techniques to modify natural amino acid sequences might allow for novel materials with novel improved properties. The primary amino acid sequence is then reverse-translated into its corresponding nucleotide sequence and the desired DNA fragment synthesized by molecular biology approaches. Indeed, as many fibrous proteins are characterized by repetitive amino acid sequences, it is often possible to multimerise a smaller synthesized oligonucleotide sequence to prepare an artificial gene that codes for proteins of high molecular weight8. The gene is then
incorporated into circular plasmid DNA which can be transformed to an appropriate host, or directly integrated into host genome. Many hosts are currently available, including bacteria, yeast, fungi, plants and animals3.4.5 with
5
the bacterial host E. coli being the most commonly used as it displays a high growth rate, is relatively cheap and easy to cultivate and has been extensively studied.
1.2.
Fibrous Proteins
Fibrous proteins such as elastin, silk, resilin, abductin or wheat gluten are self-assembling proteins that display properties of extensibility, elastic recoil and/or high strength and stability. They are present in a variety of tissues, have precise biological functions and are critical for survival. Examples of their exploitation in nature include: insect wings that depend on resilin for flight by releasing stored energy to power the return stroke in response to each wing beat; human arteries that contain elastin in the walls to allow for contraction and the pumping of blood throughout the body; and spider silk that can be tougher than steel and allows for the entrapment of prey 9.10. Although evolutionarily unrelated, they all share a
common sequence design involving short highly repetitive sequences that impart elasticity, and often also strength, interspersed with elements capable of forming cross-links that help stabilise the polymer structures 11 (Table 1). The presence
of regularly repeated sequences implies the formation of a regular structure and although the direct determination of the structures of elastic proteins has proved problematic, the limited information that is available indicates that the repetitive sequences do form regular structures and that these may be important in the elastic mechanisms9.12.
6
Table 1. Repeat motifs and crosslinking mechanisms for elastomeric proteins 9.
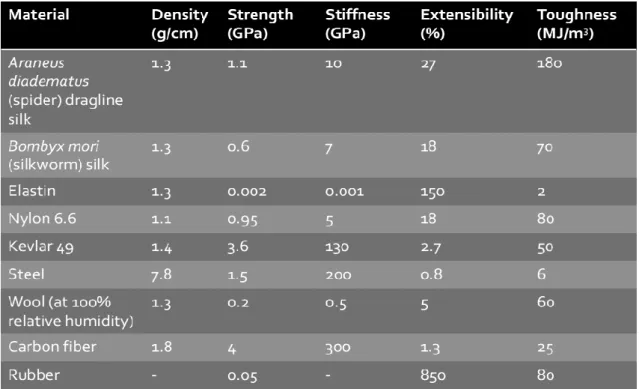
All of the elastomeric proteins have incredible elasticity, allowing for high deformation without rupture when submitted to stress and a recovery of their original form when relaxed. This property is known as resilience and is dependent on both the lengths and properties of the elastic domains and the degree of cross-linking. It appears to result from a predominantly entropic mechanism, with a decrease in conformational entropy occurring on stretching due to the restricted number of low energy conformations that the extended polypeptide chains can adopt. On removal of the stretching force, there is an increase in the number of conformations the polypeptide chains can adopt, thus providing the free energy for elastic recoil. Furthermore, many of these proteins are characterized by extremes of strength and toughness with, for example, spider dragline silk displaying a toughness higher than Kevlar and even steel (Table 2). This is attributed to the close packing of chains allowed by the small side-chained amino acids in the repetitive domains as well as to extensive cross linking.
7
Table 2. Mechanical properties of natural and synthetic fibres13.14.
Although fibrous proteins are found in many animals, only a few are known in detail, with the most studied including: abductin from arthropods, byssus from mussel, resilin from insects, silks from spiders and elastin from vertebrates3.9.13.14.
In this thesis PBPs based on elastin and silk will be investigated and both of these fibrous proteins will now be discussed.
1.2.1. Elastin
The resilience of some tissues, such as blood vessels, lungs, tendons and skin of higher vertebrates, is due to elastin, a connective tissue protein that provides a combination of strength and flexibility to the extracellular matrix. Elastins are composed of simple repeating sequences such as the pentapeptide, VPGVG, the hexapeptide, APGVGV, the nonapeptide, VPGFGVGAG and the tetrapeptide VPGG (V = valine, P = proline, G = glycine, A = alanine)12.15. Of these, the most
8
sequence is the most abundant in animal elastin and adapts a β-helix structure in the protein.
Figure 2. Illustration of stretch and relax state of elastin15.
Elastin displays its mechanical properties only in the condensed, partially hydrated phase that is formed above the critical aggregation temperature. It is generally believed that the elasticity of elastin is an entropy-based property resulting from the hydrophobic nature of the protein16.
1.2.2. Elastin-like Polymers
Elastin-like polymers (ELPs) are a new type of protein-based polymer derived from the repetitive amino acid sequence motifs of natural elastin. Here the repetitive elastin motifs are modified and/or combined in varying proportions to give rise to this new set of polymers with potentially novel mechanical and biological properties.
All functional ELPs show the so-called “inverse temperature transition” (ITT). This is a phase transitional behaviour in which, below a certain critical temperature (Tt), and in the presence of water, the polymer chains remain disordered. On the
9
contrary, above Tt, the polymer chain hydrophobically folds and assembles to form a phase separated state in which the chains adopt a dynamic, regular, non-random structure. In this folded and associated state, the chain loses essentially all of the ordered water structures of hydrophobic hydration17.18.
All ELPs behave as thermo-responsible smart polymers. However, adequate substitution of the monomer amino acids by other, can be used to modify the properties and expand the responsive nature of this family of polymers. Indeed many different polymers have been designed which show the capacity to perform more than 15 pairwise free energy transductions involving the intensive variables of mechanical force, temperature, pressure, chemical potential, electrochemical potential and electromagnetic radiation17.18.19.20.21.
1.2.3. Silk
Silk is the most thoroughly studied of the fibrous proteins. There are many forms of silk, of which that from Bombyx mori (Chinese silkworm silk) and dragline spider silk from Nephila clavipes (the golden orb weaver) have drawn most attention22. Spiders produce a large variety of silk types, each meant for a specific
purpose, such as for the trapping of prey or for suspension. Indeed these different types of spider silk are examples of nature’s high performance fibres with remarkable combinations of strength and toughness.
10 Figure 3. Illustration of Silk structure.
1.2.4. Silk-Elastin-like Proteins
Silk-elastin-like proteins (SELPs) are a family of biopolymers based on the highly repetitive amino acid sequence blocks of the naturally occurring fibrous proteins silk and elastin. They are diblock copolymers which combine the physicochemical and biological properties of the high tensile strength silk with highly resilient elastin, allowing for the fabrication of diverse materials with a high potential for use in the pharmaceutical, regenerative medicine and materials fields. Indeed, by varying the content and/or ratio of silk and elastin, SELPs can be fine tuned to give various polymers of diverse mechanical and biological properties. In fact, by Silks from both silkworms and spiders contain repetitive sequences of crystalline (e.g. GAGAGS) and amorphous domains (e.g. GPGGx, GPGQQ, GPGGY) (Table 1 and Figure 3). The crystalline domains are β−sheet regular structures which are believed to be responsible for the strength of the material, whereas the amorphous protein matrix introduces flexibility and increases the energy to break while also allowing the crystalline domains to orient under strain and thereby allow for increased strength.
11
this means one can vary the strength, flexibility, solubility, biodegradability and/or biocompatibility of the material produced1. For example, a high content of silk
β-sheet crystals gives rise to a polymer of high thermal and chemical stability but with reduced aqueous solubility. On the other hand, the periodic inclusion of the elastomeric sequence would reduce the overall crystallinity and increases its flexibility, aqueous solubility and biocompatibility. Hence one can fine tune the SELP with the desired properties to accomplish a particular function23.24.25.
Some examples of potential applications for SELPs include: controlled release systems for intracellular, intratumoral and gastrointestinal drug and gene delivery, in tissues regeneration as a support for the creation and repair of new tissues, in contact lens and synthetic corneas, and also in the automobile industry as environmentally friendly and biodegradable plastics25.26.27. While SELPs and
indeed PBPs in general have a high potential for application and offer many advantages over currently used petroleum based polymers, they are currently characterised by a high production cost which constitutes a major obstacle to the commercial viability of these. Indeed, the principal problem with the production of SELPs is their low production levels. They are produced by heterologous production with, up to now, E. coli being the most commonly used production host and with only mg/L productivities being reported1.24.
Hence a current major area of interest in the study of PBPs is in the improvement of the production levels and reduction of the production costs of these. This present project is focused on an attempt to optimise the production levels of a novel recently developed SELP28.29.
12
1.3.
Background
A number of novel SELPs consisting of multiple blocks of the silkworm silk consensus sequence GAGAGS in various combinations with a variant (VPAVG) of the natural mammalian elastin repetitive sequence block VPGVG have recently been synthesised and produced by the team where this work was developed24.
The single amino acid change (G to A) in the elastin motif has been found to have an effect on its mechanical properties, including a change in its mechanical response from elastic to plastic deformation, a two orders of magnitude increase in its young modulus value and the revelation of a hysteresis behaviour accompanying its reversible transition on heating. Hence, these novel SELPs incorporating this unique elastin-like repetitive motif (VPAVG) with that of silk (GAGAGS) should give rise to a new set of polymers with expanded and potentially enhanced properties and applicability1.24.
Figure 4. Schematic representation of silk-elastin-like protein (SELP-59-A) used in this study24.
In the present study we will investigate one of these novel SELPs, namely SELP-59-A which contains five blocks of the silk motif, GAGAGS and nine blocks of the elastin-like sequence, VPAVG. The aim of the project will be to optimise the production levels of this novel SELP.
SELP-59-A has already been subcloned into pCM13 (a modified pET-25b(+)
expression vector) and produced in E. coli BL21 (DE3)24. This is an IPTG
(β-D-1-thiogalactopyranoside)/lactose inducible system in which a highly active T7 RNA polymerase is used and in which the target gene expression is under the control of a T7 RNA polymerase promoter (Figure 5). The T7 promoter is only
13
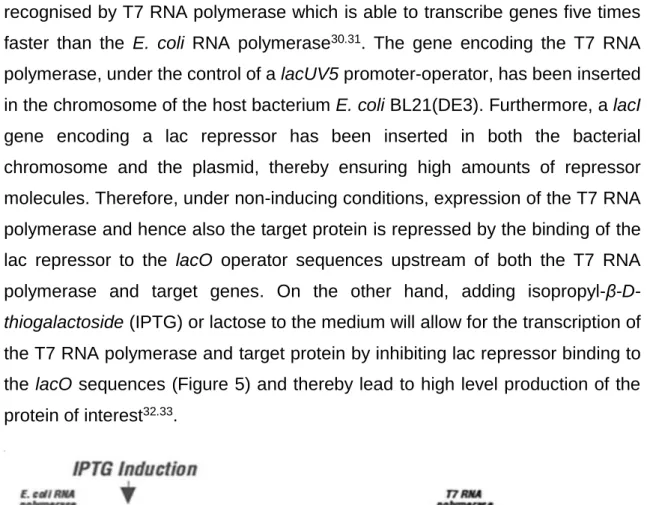
recognised by T7 RNA polymerase which is able to transcribe genes five times faster than the E. coli RNA polymerase30.31. The gene encoding the T7 RNA
polymerase, under the control of a lacUV5 promoter-operator, has been inserted in the chromosome of the host bacterium E. coli BL21(DE3). Furthermore, a lacI gene encoding a lac repressor has been inserted in both the bacterial chromosome and the plasmid, thereby ensuring high amounts of repressor molecules. Therefore, under non-inducing conditions, expression of the T7 RNA polymerase and hence also the target protein is repressed by the binding of the lac repressor to the lacO operator sequences upstream of both the T7 RNA polymerase and target genes. On the other hand, adding isopropyl-
β-D-thiogalactoside (IPTG) or lactose to the medium will allow for the transcription of
the T7 RNA polymerase and target protein by inhibiting lac repressor binding to the lacO sequences (Figure 5) and thereby lead to high level production of the protein of interest32.33.
Figure 5. Representation of E. coli BL21(DE3)/pET expression system33.
Previous studies with SELPs reported volumetric productivities of up to only 20 mg/L when using rich media for batch production in E. coli with the lacI regulated T7 system33. More recently, a systematic empirical optimisation of all
14
process parameters for the batch production in shake flasks of SELP-59-A with the pCM13-E. coli BL21(DE3) system allowed for the production of approximately 500 mg/L after purification1. Here, rich, buffered Terrific Broth (TB) at 37 ºC and
pH 6.8, and with high agitation and oxygenation as well as induction early in the stationary phase allowed for maximum production1. However, analysis of the
optimised process indicated that the selection agent (ampicillin) was rapidly degraded during the first hour of cultivation at a dry cell weight (DCW) of about 0.1 g/L and that consequently plasmid stability decreased dramatically on induction, thereby reducing polymer production levels. Furthermore, acetate was found to accumulate during the bioprocess to levels which were shown to be inhibitory to the host cells and hence reduced the maximum attainable cell density and hence also further reducing polymer levels.
Acetate accumulation during E. coli growth occurs when the carbon flux into the cells exceeds the capacity of the central metabolic pathway and in aerobic fermentations is typically a result of an uncontrolled cell growth in the presence of excess carbon source. Use of the fed-batch approach for the controlled growth of E. coli allows for the control and reduction of acetate accumulation and initial studies have already been carried out to investigate this approach for the production of SELP-59-A. With the fed-batch approach, controlled addition of a limiting essential ingredient (e.g. the carbon source, glucose) enables control of the growth rate and consequently also the rate of acetic acid production. The fed-batch production approach is typically composed of three phases: a fed-batch phase, a pre-induction fed-batch phase and a post-induction fed-batch phase. In the batch phase, E. coli is allowed to grow in the presence of excess nutrients until all carbon sources (i.e. glucose and all organic acids produced during the process) are exhausted and allows for the attainment of an stable initial culture density before the fed-batch phase. During the fed-batch phase the limiting carbon source is fed at a desired rate so as to maintain cell growth at a desired rate as defined by the mass balance equation for cell growth34.35. Finally, when
the cells have reached a desired cell density, protein production is induced by addition of IPTG or lactose and feeding is continued post induction until the fermentation is stopped. Initial investigations of the fed-batch approach with the
15
0.6 h-1 both pre and post-induction allowed for the successful reduction of acetate
accumulation levels and hence enabled high cell density fermentations (approx. 50 g/L DCW, approximately 10 times higher than with the batch production approach) and an accompanying improved polymer production. Induction at a DCW of 50 g/L allowed for the obtention of approximately 3 g/L of SELP-59-A after purification. However, this optimisation is incomplete. No attempts were made to optimise or identify the optimal pre and post induction growths rates which would allow for improved production levels or reduced process times, furthermore, the maximum cell density and optimal inducer concentration for maximising production were not investigated. Therefore, in the present study, we attempted to address this.
As already mentioned, a second problem noted for the batch production process was plasmid instability on induction, with total loss of plasmid being observed 2 hours after induction. The initial studies with the fed-batch approach also highlighted this problem with again rapid plasmid loss being noted on induction. Plasmid containing host cell resistance to ampicillin is achieved by the production of plasmid encoded β-lactamase which degrades the antibiotic and hence allows for the host cell survival. However, during cell growth the extracellular levels of this can accumulate to levels which can result in total degradation of all ampicillin present, thereby eliminating the selection pressure and thereby also facilitating the rapid plasmid loss observed as a result of the increased metabolic burden placed on the cells during induction. In the present study we will attempt to overcome the limitation of plasmid instability by investigating the use of kanamycin as the selection agent and by investigating the use of a toxin/antitoxin post segregational suicide system.
Kanamycin acts by interacting with the 30S subunit of prokaryotic ribosomes and inhibit translation. A commonly used system for resistance to this antibiotic is by the intracellular production of a phosphotransferase (Neomycin phosphotransferase II) which inactivates the antibiotic by converting them to the inactive 3’-phosphate form. Here it is hypothesised that the intracellular location and action of this enzyme may lead to an improved persistence of kanamycin in the medium. Furthermore, in the vector used in the present study, the kanamycin resistance gene is in the opposite orientation to the T7 promoter, so induction of
16
the T7 promoter should not result in an increase in kanamycin gene product. This property can reduce the metabolic burden and may lead to a positive effect on protein production33.
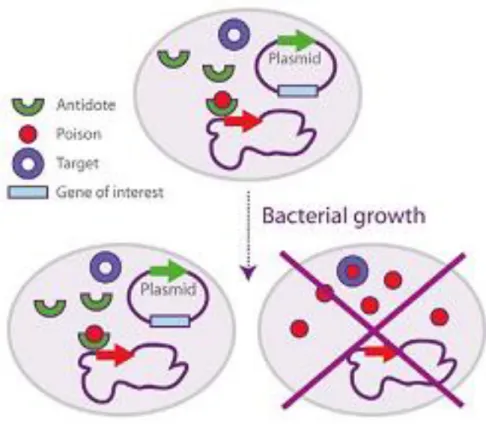
Toxin/antitoxin post segregational suicide systems are composed of two or more genes encoding a toxin and another gene encoding a respective antidote. Cells producing the toxin cannot survive unless the antitoxin is introduced and therefore plasmids containing the gene for the antitoxin will be preferentially maintained. Only those cells with a plasmid allowing for antitoxin production and their daughter cells that inherit the plasmid will survive i.e. the plasmid confers an evolutionary advantage to cells. Toxin/antitoxin post segregational suicide systems are divided into three Types. Type I is based on antitoxin inactivation by the base pairing of an RNA antitoxin with toxin mRNA. With Type II, used in this study, an antitoxin protein strongly binds a toxin protein, thereby inhibiting it. Type III has not been well studied but is believed to inactivate the toxin protein directly with antitoxin RNA. Here we will look at a Type II toxin/antitoxin system, namely the ccdB/ccdA poison/antidote system, for improved plasmid stability during
SELP-59-A production. The StabyExpress 1.2 kit will be used, here a toxin gene
(ccdB) has been introduced in the chromosome of an expression host (E. coli SE1) and the antidote gene (ccdA) under the control of a constitutive promoter has been introduced in the expression vector (pStaby 1.2) (Figure 6)36.
17
Figure 6. Representation of pStaby Express toxin/antitoxin system36.
The pStaby 1.2 expression vector used in this study for the investigation of toxin/antitoxin post segregational suicide systems for plasmid stabilisation is also characterised by the constitutive production of a β-lactamase. While this allows for a simplified selection and screening of cells containing this vector, it also places an increased metabolic burden on the cells. Here we will examine the effect of removing the promoter for this gene, thereby preventing β-lactamase production, as well as the effect of removing both the promoter and gene, thereby preventing β-lactamase production and also reducing vector size37.
18
1.4.
Objectives
The principal objective of this study is to maximise production levels and reduce the production process time for SELP-59-A. To achieve this, the work was divided into two main sections:
Optimisation of the fed-batch process o Optimise pre-induction growth rate o Optimise post-induction growth rate
o Determine the maximum achievable cell density with the fermentation system used
o Optimise IPTG concentration for maximum SELP-59-A production
Overcoming plasmid instability
o Examine and compare the use of various plasmid stabilisation systems: ampicillin resistance (ampR), kanamycin resistance (kanR
)
and the ccdB/ccdA toxin/antitoxin post segregational suicide system
o Reduce the metabolic burden on the cell by elimination of ampicillin production from the production plasmid
Examine the effect of removal of the AmpR promoter
(SELP-59-A/pStaby Δblap)
Examine the effect of removal of the whole AmpR gene and
21
The present project is divided into two main sections: 2.1) Optimisation of the fed-batch process 2.2) Overcoming plasmid instability
2.1.
Optimisation of the fed-batch process
For optimisation of the high cell density fed-batch production of SELP-59-A the
SELP-59-A/pCM13/E. coli BL21(DE3) expression host as provided for the study
was used. The variables investigated were: pre-induction growth rate (0.2 – 0.8 h -1), post-induction growth rate (0.1 – 0.6 h-1), dissolved oxygen (dO
2) concentration
(15 – 55 %), cell density (50 – 100 g/L DCW) and inducer concentration (1 – 6 mM IPTG). Comparative fed-batch studies, with a complete on-line (pH, temperature, dO2, agitation), off-line (SELP-59-A production levels, glucose, organic acids,
phosphate and nitrogen levels, total number of viable cells, plasmid stability) and at-line (biomass concentration) analysis of all process parameters, were carried out and compared for all variables investigated.
2.1.1. Fed-Batch Production of SELP-59-A
Fermentation was carried out in a BioFlo 110 Modular Benchtop 3 litre Fermentor (New Brunswick Scientific-NBS) with centralised monitoring, control and data collection via a BioCommand General Purpose Multi-Loop controller (NBS) and the BioCommand Plus 3.3 software (NBS).
Two precultures were used in the preparation of the inoculum for the fermentation culture; a first preculture in 50 mL lysogeny broth with ampicillin (LB) and a second preculture in 100 mL of a modified M9 minimal medium with ampicillin (MMLBM). This latter medium, MMLBM, was based on the minimal media described in38.39. A mid log phase pre-culture was used to inoculate 900 mL of
22
Temperature was maintained at 37 ºC, pH at 6.8 with 25 % NH4OH and 3 M
H3PO4, and dissolved oxygen (dO2) at 25 % for the batch phase and 15 - 55 %
for the fed-batch phase by cascading to agitation (200 - 1100 rpm) and O2 (only
at fed-batch phase). The air flow rate was maintained at 5 L min.-1 and foaming
was controlled with antifoam Y-30 emulsion (Sigma).
The fed-batch phase was started when all the carbon sources present had been exhausted after an overnight batch phase and as indicated by a sustained increase in the dO2 levels above 50 %. During the fed-batch phase, the growth
rate was controlled at a desired rate by the glucose feeding rate as determined by the mass balance equation39:
M𝑆(t) = F𝐹(t)SF(t) = ( µ(𝑡)
𝑌𝑥 𝑠⁄ + 𝑚) 𝑉(𝑡)𝑋(𝑡) (1)
where MS(t) is the mass feeding rate of the glucose substrate (g h-1) at time t, FF
is the volumetric feeding rate of the feed solution (L h-1), SF the glucose
concentration of the feed solution (g h-1), µ the desired specific growth rate (h-1),
YX/S the yield coefficient (0.4 g g-1), m the specific maintenance coefficient (0.025
g g-1 h-1), V the cultivation volume (L) and X the biomass concentration (g L-1).
The actual biomass concentration was measured every hour and the culture volume calculated from a determination of the volumes sampled, the acid or base added and the feeding rate, and used to calculate the required rate of glucose feeding using equation (1). Furthermore, every 15 minutes, the feeding rate was calculated from equation (1) and from estimates of the biomass concentration and culture volume as follows
𝑋(𝑡)𝑉(𝑡) = 𝑋𝑡𝐹𝑉𝑡𝐹𝑒µ(𝑡−𝑡𝐹) (2)
where tF is the time when the biomass concentration and culture volume were
last measured, X(t) is the biomass concentration at time t, V(t) the culture volume at time t, XtF is the biomass concentration at tF and VtF is the culture volume at time
tF.
In addition to a glucose feed, a second feeding solution of 600 mM phosphate and 1200 mM nitrogen was also applied so as to maintain phosphate at
23
concentrations between 50 and 300 mM and nitrogen between 50 and 100 mM throughout the fermentation.
Induction of SELP-59-A production was carried out with filter sterilised isopropyl β-D-1-thiogalactopyranoside (IPTG) with an induction period of 4 hours.
Fed-batch Protocol: See Annexe I
2.1.1.1. Analytical Methods for Monitoring of Fed-batch
process
At-line (biomass concentration) and off-line (SELP-59-A production levels, glucose, organic acids, phosphate and nitrogen levels, total number of viable cells, plasmid stability) analyses of process parameters were carried out and compared for each fed-batch production. Cultures were aseptically sampled every hour and used directly for analysis of dry cell weight (DCW), optical density measurements (OD600nm), enumeration of total viable cell numbers and plasmid
stability. Extracellular samples were taken every hour and maintained at -20 ºC until analysis of sugar and organic acid content (by HPLC) as well as phosphate concentration and nitrogen concentration. Cell pellets from 0.5 mL culture samples were collected before induction and every hour thereafter and stored at -20 ºC until SDS-PAGE analysis.
The optical density at 600nm was measured on a Genesys 20 spectrophotometer
(ThermoSpectronics).
Biomass dry cell weights (DCW, g/L) were determined from the weights of
washed pellets of 2 mL culture samples dried overnight at 70 °C.
Organic acids (citric, tartaric, malic, succinic, lactic, acetic and formic), carbohydrate (glucose) and ethanol levels in culture supernatants collected every
hour were monitored using a Rezex™ 8 μm ROA-organic acid H+(8%) high performance liquid chromatography column (Phenomenex). 2.5 mM H2SO4 was
24
by refractive index measurement with an Elite LaChrom L-2490 RI detector (VWR Hitachi) at 40°C. An Elite LaChrom (VWR Hitachi) chromatography system was used with the EZChrom Elite 3.3.2 SP2 software for data collection and analysis. Culture supernatant samples were treated with 10 % TCA to remove protein contaminants, centrifuged for 5 minutes at maximum speed and the supernatant filtered through a 0.22 µm filter before HPLC analysis. The HPLC protocol used is detailed in Annexe II.
To ensure that adequate phosphate was present throughout the fermentations, the phosphate concentration in the culture supernatants of samples taken every hour was monitored. The phosphate assay described in40 was used, see Annexe
III for details.
Ammonia-nitrogen concentration in the culture supernatants was determined by
the Berthelot colour reaction as previously described41, see Annexe IV for details.
Viable cell numbers were determined by serially diluting culture samples in sterile
phosphate buffered saline (8 g/L NaCl, 0.2 g/L KCl, 1.44 g/L Na2HPO4, 0.24 g/L
KH2PO4, pH 7.4) and spread plating 25 µL of the 10-5 – 10-7 dilutions in duplicate
on LB agar plates (10 g/L bacto tryptone; 5 g/L yeast extract, 5 g/L NaCl, 20 g/L agar). After incubation overnight at 37 ºC, cell numbers were enumerated.
Plasmid stability in viable cells was monitored by repicking 100 isolated colonies
from the LB plates to LB + ampicillin plates (10 g/L bacto tryptone; 5 g/L yeast extract, 5 g/L NaCl, 20 g/L agar, 100 μg/mL ampicillin) and incubating overnight at 37 ºC. Plasmid stability is expressed as the percentage of the cells growing on LB which are able to grow on the antibiotic containing media.
Intracellular (from cell pellets of 0.5 mL cultures) and extracellular SELP-59-A
production levels were monitored by means of PAGE with a 10 %
SDS-PAGE gel and staining with 3M CuCl2. See Annexe V for details of the protocol
used.
Purified SELP-59-A production levels for the various fed-batch productions was
determined from the weight of purified polymer. The purification protocol24 is
25
removed by acid pH treatment (pH 3.5) and SELP-59-A then precipitated from the supernatant by treatment with 22 % ammonium sulphate. Following extensive dialysis in water the purified SELP-59-A was then lyophilised and weighed.
2.1.2. Effect of growth rate on fed-batch process
Initial attempts in developing the fed-batch process involved the investigation of constant pre- and post-induction growth rates (µ) of 0.2, 0.4 and 0.6 h-1. The
process was carried out as described in 2.1.1 above and analysed as described in 2.1.1.1. The dissolved oxygen concentration was maintained at 35 % during the fed-batch phase and induction was with 3 mM IPTG at a DCW of 50 g/L.
Table 3. Conditions used for optimisation of the growth rate.
Pre-Induction Growth Rate Post-Induction Growth Rate dO2 (%) Induction DCW [IPTG] (mM) 0.2 0.2 35 50 3 0.4 0.4 35 50 3 0.6 0.6 35 50 3
2.1.3. Optimisation of post-induction growth rate
Fed-batch productions were carried out as described in 2.1.1 above with pre-induction growth rates of 0.2 and 0.6 h-1 and post-induction growth rates (µ) of
0.1, 0.2, 0.4 or 0.6 h-1. All process parameters were monitored as described in
2.1.1.1 above and each fermentation was repeated at least two times. The dissolved oxygen concentration was maintained at 35 % during the fed-batch
26
phase and induction was carried out at a dry cell weigh of 50 g/L with 3 mM IPTG in all cases.
Table 4. Conditions used for optimisation of the post-induction growth rate
Pre-Induction Growth Rate (h-1) Post-Induction Growth Rate (h-1) dO2 (%) Induction Dry Cell Weight (g/L) [IPTG] (mM) 0.2/0.6 0.1 35 50 3 0.2/0.6 0.2 35 50 3 0.2/0.6 0.4 35 50 3 0.2/0.6 0.6 35 50 3
2.1.4. Optimisation of pre-induction growth rate
The effect of the pre-induction growth rate on the fed-batch process was investigated by carrying out the fed-batch process as described in 2.1.1 above with the desired specific growth rate (µ) set at 0.2, 0.4, 0.6 or 0.8 h-1 during the
fed-batch phase prior to induction. Following induction at a DCW of 50 g/L with 3 mM IPTG the desired specific growth rate was reduced to 0.1 h-1. The dissolved
oxygen concentration was maintained at 35 % during the fed-batch phase, all process parameters were monitored as described in 2.1.1.1 above and each fermentation was repeated at least two times.
27
Table 5. Conditions used for optimisation of the pre-induction growth rate
Pre-Induction Growth Rate Post-Induction Growth Rate dO2 (%) Induction DCW [IPTG] (mM) 0.2 0.1 35 50 3 0.4 0.1 35 50 3 0.6 0.1 35 50 3 0.8 0.1 35 50 3
2.1.5. Optimisation of dissolved oxygen concentration
The effect of the dissolved oxygen concentration on the fed-batch process was investigated by carrying out the fed-batch process as indicated in 2.1.1 with dissolved oxygen concentration during the fed-batch phase being maintained at 15, 35 or 55 % and monitoring and comparing all process variables as indicated in 2.1.1.1 above. A pre-induction growth rate of 0.4 h-1 and post-induction growth
rate of 0.1 h-1 was used and induction was carried out at a dry cell weigh of 50
28
Table 6. Conditions used for optimisation of the dissolved oxygen concentration
Pre-Induction Growth Rate (h-1) Post-Induction Growth Rate (h-1) dO2 (%) Induction Dry Cell Weight (g/L) [IPTG] (mM) 0.4 0.1 15 50 3 0.4 0.1 35 50 3 0.4 0.1 55 50 3
2.1.6. Optimisation of the dry cell weight at induction
The fed-batch process was carried out as described in 2.1.1 with a pre-induction growth rate of 0.4 h-1 - 0.1 h-1, a post-induction growth rate of 0.1 h-1, dO2 set at
35 % during the fed-batch phase and with induction with 3 mM IPTG at dry cell weighs of 50, 75 and 100 g/L. The lower pre-induction growth rates were used at the higher dry cell weights in an attempt to maintain dO2 levels above 0 %. All
process variables were monitored as indicated in 2.1.1.1 above.
Table 7. Conditions used for optimisation of the dry cell weight at induction
Pre-Induction Growth Rate (h-1) Post-Induction Growth Rate (h-1) dO2 (%) Induction Dry Cell Weight (g/L) [IPTG] (mM) 0.4 0.1 35 50 3 0.4 0.1 35 75 3 0.4 0.1 35 100 3
29
2.1.7. Optimisation of IPTG concentration
Induction at a DCW of 75 g/L with 1, 3 or 6 mM IPTG was investigated with the fed-batch process described in 2.1.1 above, with a pre-induction growth rate of 0.4 h-1 and post-induction growth rate of 0.1 h-1. The oxygen concentration was
maintained at 35 % during the fed-batch phase and all process variables were monitored as indicated in 2.1.1.1.
Table 8. Conditions used for optimisation of the IPTG concentration for induction
Pre-Induction Growth Rate (h-1) Post-Induction Growth Rate (h-1) dO2 (%) Induction Dry Cell Weight (g/L) [IPTG] (mM) 0.4 0.1 35 75 1 0.4 0.1 35 75 3 0.4 0.1 35 75 6
30
2.2.
Overcoming plasmid instability
For overcoming problems with plasmid instability observed during part 2.1 of this study we investigated various means of plasmid stabilisation and their effect in the fed-batch process for SELP-59-A production. Various vector constructs were prepared by molecular biology approaches (restriction digestion, fragment purification and ligation), transformed to their appropriate expression hosts and their use in the fed-batch production of SELP-59-A investigated and compared using the standard fed-batch approach described in 2.1.1 above. A complete on-line (pH, temperature, dO2, agitation), off-line (SELP-59-A production levels,
sugar, organic acid, phosphate and nitrogen levels, total number of viable cells, plasmid stability) and at-line (cell density) analysis of all process variables as described in 2.1.1.1 was carried out and compared in all cases.
Four different means of plasmid stabilisation were investigated:
ampicillin resistance (control, pCM13/E. coli BL21(DE3) as used in 2.1 above),
kanamycinresistance (pET29a(+)/E. coli BL21(DE3))
ccdB/ccdA toxin/antitoxin post segregational suicide system (pStaby/E.
coli SE1)
reduction of the metabolic burden on the cell by elimination of ampicillin production from the production plasmid (pStaby Δblap/E. coli DE1 and pStaby Δbla/E. coli SE1).
31
Table 9. Details of plasmids used in this study
Plasmid Selection Marker
pCM13/SELP-59-A Ampicillin
Modified pET-25b(+)
(Novagen) vector containg the gene for SELP-59-A. Provided for this study24.
pET29a(+) Kanamycin pET Expression System
(Novagen))
pStaby 1.2 Ampicillin and
ccdB/ccdA
Modified pET-21b(+) vector containing gene for antitoxin
ccdA (Delphi Genetics).
pStaby 1.2 Δblap ccdB/ccdA
pStaby 1.2 with promoter for ampicillin resistance gene removed. Prepared in this study
pStaby 1.2 Δbla ccdB/ccdA
pStaby 1.2 with ampicillin resistance gene and promoter removed. Prepared in this study
32
Table 10. Details of E. coli strains used in this study
Strains
Information
XL1Blue
recA1 endA1 gyrA96 thi-1 hsdR17 supE44 relA1 lac[F’ proAB+ lac LqZΔM15 Tn
10(Tetr)]
Used as cloning host for pET vector constructs
BL21(DE3)
F- ompT gal dcm lon hsdSb(rb-
mb-) λ(DE3 [lacl lacUV5-T7
gene 1 ind1 Sam7 nin5])
Used as expression host for pET vector constructs
BL21(DE3)/pCM13 /SELP-59-A
BL21(DE3) transformed with expression vector pCM13 with
SELP-59-A gene inserted24
Provided for this study24
CYS21
F-, CmR, mcrA, endA1,
Δ(mrr-hsdRMS-mcrBC) (restriction-,
modification-), Φ80lacZΔM15,
ΔlacX74, recA1, Δ(ara, leu)7697, araD139, galU, galK, nupG, rpsl, ccdB+
Cloning host for pStaby vector constructs. Contains chromosomal copy of gene for ccdB toxin.
SE1
F-, CmR, ompT, lon,
hsdSB
(restriction-,modification-), gal, dcm,DE3
(lacI, T7 polymerase under the
control of the PlacUV5
promoter), ccdB+
Variant of E. coli
BL21(DE3) containing chromosomal copy of gene for ccdB toxin. Expression host for
pStaby vector
constructs.
33
2.2.1. Plasmid Isolation
SELP-59-A/pCM13 plasmid was isolated and purified from SELP-59-A/pCM13/E. coli BL21(DE3) by use of the GenElute™ Plasmid Miniprep Kit (Sigma-Aldrich)
as recommended by the manufacturer (see Annexe VII). Purified plasmids pET29a(+) (Novagen) and pStaby 1.2 (Delphi Genetics) were obtained from the manufacturers.
2.2.2. Plasmid Quantification
Plasmid concentration was determined by absorbance measurements at 260 nm using a NanoDrop ND 1000 spectrophotometer (Thermo Scientific) as recommended by the manufacturer (see Annexe VIII for protocol details). The nucleic acid quantification is made using the Beer-Lambert equation, modified to use an extinction coefficient with units of ng-cm/µL (50 ng-cm/µL for double-stranded DNA).
The 260 nm/280 nm and 260 nm/230 nm absorbance values ratios were used to determine sample purity and the absence of protein or other organic compound contamination, respectively.
2.2.3. Restriction Digestion
Restriction digestion was used in the construction of SELP-59-A/pET29a(+), and
SELP-59-A/pStaby 1.2 (see Figure 7 for an illustration of the approach used) and
in the removal of the AmpR promoter as well as the whole AmpR gene and
promoter from SELP-59-A/pStaby 1.2 (see Figure 8 for an illustration of the approaches used).
Restriction digestion with NdeI (Thermo Scientific) and BlpI (Thermo Scientific) was used to remove the SELP-59-A gene from SELP-59-A/pCM13 before
34
insertion into similarly digested pET29a(+) and pStaby 1.2. The double digestion was carried out at 37 ºC in Tango buffer via a two step protocol as described in Annexe IX.
Figure 7. Schematic illustration of the approach used for preparation of
SELP 59 A/pStaby.
For removal of the AmpR promoter from SELP-59-A/pStaby 1.2 (i.e. preparation
of SELP-59-A/pStaby Δblap) double digestion with SspI (Thermo Scientific) was carried out as recommended by the manufacturer. See Annexe IX for details of the protocol used.
For removal of both the AmpR gene and promoter from SELP-59-A/pStaby 1.2
(i.e. preparation of SELP-59-A/pStaby Δbla) double digestion with SspI (Thermo Scientific) and Eam1105I (Thermo Scientific) was used. See Annexe IX for details of the protocol used.
35
Figure 8. Schematic illustration of the approach used for preparation of
SELP 59 A/pStaby Δblap and SELP-59-A/pStaby Δbla.
2.2.4. Fragment Purification
Following restriction digestion of the SELP-59-A/pCM13, pET29a(+), pStaby 1.2 and SELP-59-A/pStaby 1.2 vectors, the samples were then run on a 1.5 % agarose gel so as to allow for separation and purification of the digest fragments and further analysis (see Annexe X). The gel fragments containing the DNA bands of interest were removed and purified by use of the Ezway™ Gel Extraction Kit (Komabiotech) as recommended by the manufacturer (Annexe XI).
36
2.2.5. Preparing blunt-ended fragments
During preparation of SELP-59-A/pStaby Δbla, filling-in of the SspI - Eam1105I digest fragment was required so as to ensure blunt ends and allow for recircularisation. Here the accuzyme DNA polymerase mix (Bioline Ltd) was used as described by the manufacturers (see Annexe XII).
2.2.6. Fragment Ligation
The purified SELP-59-A fragment was inserted into pET29a(+) and pStaby 1.2, and the SELP-59-A/pStaby Δblap and SELP-59-A/pStaby Δbla fragments were re-circularised by ligation with T4 DNA ligase (Thermo Scientific) as recommended by the manufacturer (Annexe XIII).
2.2.7. Transformation
SELP-59-A/pET29a(+) was transformed to E. coli strains XL1Blue (cloning strain)
and BL21(DE3) (expression strain) using standard protocols (Annexe XIV). Vectors containing the ccdA antidote gene (i.e. A/pStaby,
SELP-59-A/pStaby Δbla, SELP-59-A/pStaby Δblap) were transformed to E. coli strains
CYS21 (cloning strain) and SE1 (expression strain) using the protocols provided with the Staby Expression Kit (Annexe XIV).
37
2.2.8. Confirmation of Constructs
Confirmation of correct preparation of constructs was performed by plasmid isolation (2.2.1 above) followed by restriction digestion (2.2.3) and agarose gel analysis (2.2.4) of fragments.
2.2.9. Fed-Batch Production
Comparative fed-batch productions with complete process analyses were carried out for all five constructs using the protocols described in 2.1.1 and 2.1.1.1 above. A pre-induction growth rate of 0.5 h-1 and post-induction growth rate of 0.1 h-1
was used, dO2 was maintained at 35 % during the fed-batch phase and induction
with 3 mM IPTG was carried out at a DCW of 25 g/L. The post induction period was extended to 8 hours.
3.
Results and
Discussion
41
3.1.
Optimisation of Fed-batch Process
The objective of this first section of the project was to develop and optimise a fed-batch process for the high cell density production of SELP-59-A in the BioFlo 110 benchtop 3L fermentor with the SELP-59-A/pCM13/E. coli BL21(DE3) expression system. To achieve this objective we established a fed-batch process and optimised process variables such as pre- and post-induction growth rates, dissolved oxygen (dO2) concentration, cell density and inducer concentration.
Each of these parameters was investigated and optimised in the fed-batch process with, in all cases, a full analysis of process parameters.
3.1.1. Effect of growth rate on fed-batch process
A fed-batch process was developed for the high cell density production of SELP-59-A and applied and monitored as described in the Materials and Methods section. Initially the effect of pre and post induction growth rates (µ) of 0.2, 0.4, 0.6 and 0.8 h-1 with dO2 at 35 % were investigated for the attainment of cell
densities of 50 g/L before induction with IPTG. With growth rates up to 0.6 h-1 a
DCW of 50 g/L was successfully achieved whereas with 0.8 h-1 the maximum cell
density achievable was only 40 - 45 g/L. Indeed, with this latter growth rate, continued feeding leads to a decrease in DCW, indicative of cell disruption. A DCW of 50 g/L is already 10 times higher than that achieved with the optimised batch production approach previously reported with the same expression system1
and points to the fed-batch process developed here being suitable for overcoming some of the limitations to cell growth inherent to batch production approaches. Figure 9 shows the results for the monitoring of the control parameters for the fed-batch process with pre- and post-induction growth rates of 0.2 h-1 and it can
be seen that these were successfully maintained at the desired levels throughout the process i.e. 37 ± 1 ºC, pH 6.8 ± 0.1, dO2 = 25 ± 10% during the batch phase
42
changes in feeding rate), phosphate concentration between 50 and 300 mM and nitrogen concentration between 50 and 100 mM. This points to appropriate feeding and control regimes having been developed and successfully applied here and indeed similar profiles were observed for all studies reported in this thesis, hence only the results for the 0.2 – 0.2 h-1 study will be discussed here.
Figure 9. Variations in control parameters during the fed-batch process with pre- and post-induction growth rates of 0.2 h-1, 35 % dO
2 and induction with 3 mM IPTG at 50 g/L
dry cell weight. A) shows the results for the on-line monitoring throughout both the batch (0 - 18 h) and fed-batch (18 - 29 h) phases and B) the variations in the phosphate (PO4)
and nitrogen (N) concentrations during the fed-batch phase only. The vertical dotted line indicates the time point of IPTG induction.
43
From Figure 9A it can be seen that the dO2 level varies throughout the
fermentation as a result of cell requirements and of the response of the control system (i.e. response of agitation rate and O2 addition) to dO2 levels below the
permitted values (i.e. ≥ 25 – 35 % dO2). Initially the dO2 level decreases as the
cells grow until the lower set dO2 limit of 25 % is reached (batch-phase)
whereupon the agitation rate increases to the maximum allowed so as to ensure maintenance of a sufficient level of dO2. Following further incubation, an increase
in dO2 concentration leads to a rapid decrease in the agitation rate and is believed
to be due to reduced cell growth as a result of an exhaustion of all the glucose present. The cells then grow on organic acids produced during the batch phase, the complete utilisation of which is indicated by a further rise in dO2 levels.
Hereupon, the fed-batch phase of controlled glucose feeding and cell growth is initiated with the expected response of a decrease in dO2 levels and a rapid
compensatory increase in agitation rate and O2 addition being noted. Finally, on
induction with IPTG at a DCW of 50 g/L the O2 consumption increases slightly
before slowly decreasing until the fermentation is stopped four hours after induction.
From Figure 9B it can be seen that phosphate and nitrogen levels were maintained throughout the process at levels known to be limiting and non-toxic to the cells7 and hence indicating that the feeding protocol developed for our
second feed solution (phosphate/nitrogen feed) was successful during the process. Interestingly, throughout this project, while it was found that phosphate consumption was maintained throughout the fed-batch process, nitrogen consumption decreased following induction. Indeed this has been previously reported for E. coli cells following induction and is suggested to be indicative of an impaired cell metabolism following induction7.
Figure 10 shows the results for the analysis of the process parameters for all three growth rates investigated. It can be clearly seen that 50 g/L DCW was successfully achieved before induction, upon which an arrestation of cell growth is observed. In fact, at the higher growth rates investigated a decrease in the DCW is observed following induction. Indeed this has been previously reported for recombinant protein production in E. coli and is believed to be due to an
44
increased metabolic stress on the cells following induction and a diversion of cell resources to protein expression1.42.
Figure 10. Monitoring of process parameters during the fed-batch phase of production. Results for pre- and post-induction growth rates of 0.2 h-1 (A, B), 0.4 h-1 (C, D) and 0.6 h -1 (E, F) with 35 % dO
2 and induction at 50 g/L dry cell weight with 3 mM IPTG are shown.